Chapter Outline
Oral anticoagulant treatment using vitamin K antagonists 426
Standardisation of oral anticoagulant treatment 426
Calibration of thromboplastins 426
Local calibration of thromboplastins and direct INR determination 428
Determination of the international normalised ratio 428
Therapeutic range and choice of thromboplastin 429
Management of overanticoagulation 429
Heparin treatment 429
Selection of patients 430
Laboratory control of heparin treatment 430
Activated partial thromboplastin time for heparin monitoring 431
Near-patient heparin monitoring 432
Anti-Xa assay for heparin 432
Protamine neutralisation test 433
Heparin-induced thrombocytopenia 433
Direct acting oral anti-IIa and anti-Xa agents 435
Ecarin clotting time 436
Thrombolytic therapy 436
Laboratory control of thrombolytic therapy 436
Investigation of a patient who bleeds while taking thrombolytic agents or immediately afterward 437
Antiplatelet therapy 437
Anticoagulant and antithrombotic therapy is given to prevent formation or propagation of thrombi. Anticoagulant drugs, unlike fibrinolytic agents, have little if any effect on an already-formed thrombus. There are five main classes of drugs that require consideration:
- 1.
Coumarins and indanediones, which are orally active and act by interfering with the γ-carboxylation step in the synthesis of the vitamin K-dependent factors (see p. 371).
- 2.
Heparin, heparinoids (low molecular weight and synthetic compounds) and the heparin pentasaccharide (fondaparinux), which have a complex action on haemostasis, the main effect being the potentiation and acceleration of the effect of antithrombin.
- 3.
Direct thrombin and Xa inhibitors. These include derivatives of hirudin (natural or recombinant), and a number of orally active synthetic compounds which are now entering clinical use.
- 4.
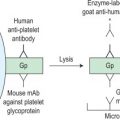
Antiplatelet drugs such as aspirin, nonsteroidal anti- inflammatory drugs, dipyridamole, inhibitors of the P2Y 12 adenosine diphosphate (ADP) receptor and inhibitors of glycoprotein IIb/IIIa function, some of which are antibodies. Novel agents targeting other platelet receptors and functions are also in development.
- 5.
Thrombolytic agents including streptokinase, urokinase and tPA as well as a number of recombinant tPA derivatives with modified properties.
Oral anticoagulant treatment using vitamin K antagonists
It has not yet proved possible to produce a therapeutic reduction in thrombotic tendency without increasing the risk of haemorrhage. The purpose of laboratory control is to maintain a level of hypocoagulability that effectively minimises the combined risks of haemorrhage and thrombosis: the therapeutic range. This range will be different for different patients and individual responses to oral anticoagulant treatment with vitamin K antagonists are extremely variable, so must be regularly and frequently controlled by using laboratory tests to ensure that the anticoagulant effect remains within the therapeutic range.
Selection of patients
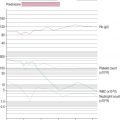
Before starting oral anticoagulant treatment it is advisable to perform the first line coagulation screen: a prothrombin time (PT), an activated partial thromboplastin time (APTT) and a platelet count. Any abnormality of these tests must be investigated because a contraindication to the use of oral anticoagulants may be revealed and an abnormality will confound their use for controlling anticoagulant effect. History and clinical examination should be assessed to ensure that no local or general haemorrhagic diathesis exists.
Methods used for the laboratory control of oral anticoagulant treatment
The one-stage PT of Quick is the most commonly used test. Originally, lack of standardisation of the thromboplastin preparations and methods of expressing the PT results led to great discrepancies in the reported results and hence also in anticoagulant dosage. The use of the International Sensitivity Index (ISI), to assess the sensitivity of any given thromboplastin, and the International Normalised Ratio (INR), to report the results, has minimised these difficulties and greatly improved uniformity of anticoagulation throughout the world.
Chromogenic substrate assays of factors X, VII or II have been used for the control of anticoagulant treatment and might be necessary when baseline tests are abnormal. Although it is possible to use such a single factor measurement, it must be remembered that the PT measures the effect of three vitamin K-dependent factors (factors VII, X and II) and is also affected by the presence of PIVKAs (proteins induced by vitamin K absence or antagonism), which are the acarboxy forms of vitamin K-dependent factors. It thus gives a better assessment of the situation in vivo: in addition data on the appropriate individual factor levels corresponding to a given INR are limited. ,
The Thrombotest of Owren and the prothrombin and proconvertin (P&P) method of Owren and Aas were used in the past, but they are no longer recommended for oral anticoagulant control. Historically, standardisation of oral anticoagulant therapy was carried out following the procedure described below. It is now possible to simplify this by using local procedures which are discussed afterwards.
Standardisation of oral anticoagulant treatment
- 1.
A thromboplastin is chosen, and its ISI is determined by comparison with a reference thromboplastin.
- 2.
The log mean normal PT is determined for that thromboplastin.
- 3.
PTs are performed on patient samples, and the results are converted to an INR.
World Health Organisation (WHO) Reference Preparations are available from the National Institute for Biological Standards and Control (NIBSC) ( www.nibsc.org ). Certified preparations calibrated against the WHO material are available from the Institute for Reference Materials and Measurements (IRMM) ( https://ec.europa.eu/jrc/institutes/irmm/ ) and from commercial suppliers (see p. 535). All the reference preparations have been calibrated, now sometimes indirectly, against a primary WHO reference of human brain thromboplastin, which was established in 1967. ,
The following terms are used in the calibration procedure described below:
International Sensitivity Index (ISI). This is the slope of the calibration line obtained when the PTs obtained with the reference preparation are plotted on the vertical axis of log-log paper and the PTs obtained by the test thromboplastin are plotted on the horizontal axis. The same normal and anticoagulated patient plasma samples are used for both sets of results.
International Normalised Ratio (INR). This is the PT ratio for a sample, which, by calculation, would have been obtained had the original primary, human reference thromboplastin been used to perform the PT. Its calculation is shown below.
Calibration of thromboplastins
Principle
The test thromboplastin should be calibrated against a reference thromboplastin of the same species (rabbit vs. rabbit, bovine vs. bovine) although reference plasmas from different species must at some stage be compared with each other. All reference preparations are calibrated in terms of the primary material of human origin and have an ISI which is assigned after a collaborative study involving many laboratories from different countries.
Reagents
Normal citrated plasma. From 20 healthy donors.
- •
Anticoagulated plasma. From 60 patients stabilised on oral anticoagulant treatment for at least 6 weeks.
The tests need not all be done at the same time; they may be carried out on freshly collected samples on successive days.
- •
Reference and test thromboplastins.
- •
CaCl 2 . 0.025 mol/l.
Method
Carry out PT tests as described on p. 380. Test each plasma in duplicate with each of the two thromboplastins in the following order with minimum delay between tests:
| Reference Thromboplastin | Test Thromboplastin | |
|---|---|---|
| Plasma 1 | Test 1 | Test 2 |
| Test 4 | Test 3 | |
| Plasma 2 | Test 5 | Test 6 |
| Test 8 | Test 7, etc. |
Record the mean PT for each plasma. If there is a discrepancy of more than 10% in the clotting times between duplicates, repeat the test on that plasma.
Calibration
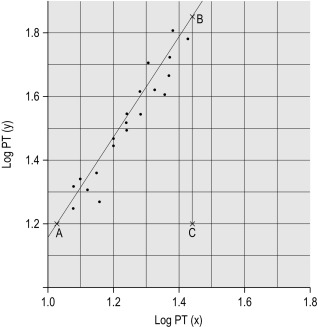
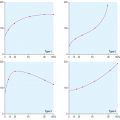
Plot the PTs on log-log graph paper, with results using the reference preparation (y) on the vertical axis and results with the test thromboplastin (x) on the horizontal axis ( Fig. 20-1 ). If using arithmetical paper, plot the logarithms of the PTs ( Fig. 20-2 ). The relationship between the two thromboplastins is determined by the slope of the line (b).
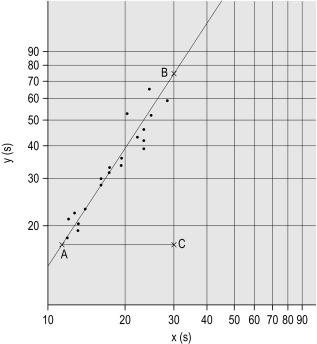
b = B to C A to C
. In this example B to C = 55 mm, A to C = 35 mm, b = 55/35 = 1.57. The ISI of the reference thromboplastin was 1.11. Therefore the ISI of the test thromboplastin = 1.11 × 1.57 = 1.74.
An estimate of the slope can be obtained as shown in Figures 20-1 and 20-2 ; this can then be used to obtain the ISI of the test thromboplastin. Alternatively the slope can be calculated using a computer or online system to apply simple linear regression. This has been shown to be sufficiently accurate compared to the orthogonal regression that is theoretically preferable. A procedure for manual calculation of the slope is given in previous editions of this book.
Whenever possible, however, to obtain a reliable measurement, the following more complicated calculation should be used instead.
Calculation of international sensitivity index
The natural logarithms of the PTs obtained using the reference thromboplastin and the test thromboplastin are called y i and x i , respectively, where i = 1,2,3…N for N pairs of results.
The following designations are then made:
x 0 and y 0 are the arithmetical means of the N values of x i and y i , respectively.
Q 1 and Q 2 are the sums of the squares of ( x i − x 0 ) and ( y i − y 0 ), respectively.
P is the sum of their products Σ( x i − x 0 )( y i – y 0 )
E = Q 2 – Q 1 2 + 4 P 2
And b = Q 2 − Q 1 + E 1 / 2 2 P
Related posts:
Stay updated, free articles. Join our Telegram channel

Full access? Get Clinical Tree


