Chapter Outline
The haemoglobin molecule 283
Structural variants of haemoglobin 284
Haemoglobins with reduced solubility 284
Unstable haemoglobins 285
Haemoglobins with altered oxygen affinity 285
Haemoglobin M 285
Thalassaemia syndromes 286
Investigation of patients with a suspected haemoglobinopathy 289
Laboratory detection of haemoglobin variants 289
Blood count and film 290
Collection of blood and preparation of haemolysates 291
Control samples 291
Quality assurance 291
Cellulose acetate electrophoresis at alkaline pH 292
Agarose gel electrophoresis 294
Automated high performance liquid chromatography 294
Capillary electrophoresis 296
Isoelectric focusing 297
Tests for haemoglobin S 297
Neonatal (newborn) screening 299
Detection of an unstable haemoglobin 299
Detection of haemoglobin Ms 300
Detection of altered affinity haemoglobins 301
Differential diagnosis of common haemoglobin variants 301
Investigation of suspected thalassaemia 301
Methods for investigation of thalassaemia 301
Quantification of haemoglobin A 2 302
Measurement of haemoglobin A 2 by elution from cellulose acetate 303
Measurement of haemoglobin A 2 by microcolumn chromatography 304
Measurement of haemoglobin A 2 by microcolumn chromatography with Tris-HCl buffers 304
Measurement of haemoglobin A 2 by microcolumn chromatography with glycine-potassium cyanide developers 305
Modification for the measurement of haemoglobin S 305
Measurement of haemoglobin A 2 by high performance liquid chromatography 306
Measurement of haemoglobin A 2 by capillary electrophoresis 306
Interpretation of haemoglobin A 2 values 306
Quantification of haemoglobin F 306
Modified Betke method for the estimation of haemoglobin F 307
Assessment of the intracellular distribution of haemoglobin F 308
Interpretation of haemoglobin F values 308
Assessment of iron status in thalassaemia 308
Red cell inclusions 309
Demonstration of haemoglobin H inclusions 309
Fetal diagnosis of globin gene disorders 310
The haemoglobin molecule
Human haemoglobin is formed from two pairs of globin chains each with a haem group attached. Seven different globin chains are synthesised in normal subjects; two, ε and ζ, are characteristic of the embryo and contribute to four transient embryonic haemoglobins referred to as haemoglobins Gower 1, Gower 2, Portland 1 and Portland 2. Haemoglobin F is the predominant haemoglobin of fetal life and comprises the major proportion of haemoglobin found at birth. Haemoglobin A is the major haemoglobin found in adults and children. Haemoglobins A 2 and F are found in small quantities in adult life (approximately 2–3.3% and 0.2–1.0%, respectively). The adult proportions of haemoglobins A, A 2 and F are usually attained by 6–12 months of age.
The individual chains synthesised in postnatal life are designated α, β, γ and δ. Haemoglobin A has two α chains and two β chains (α 2 β 2 ); haemoglobin F has two α chains and two γ chains (α 2 γ 2 ) and haemoglobin A 2 has two α chains and two δ chains (α 2 δ 2 ). The α chain is thus common to all three types of haemoglobin molecule.
α chain synthesis is directed by two α genes, α2 and α1, on chromosome 16 and β and δ chain synthesis by single β and δ genes on chromosome 11; γ chain synthesis is directed by two genes, G γ and A γ, also on chromosome 11. The globin genes are shown diagrammatically in Figure 14-1 .

The four chains are associated in the form of a tetramer: the α 1 β 1 (and equivalent α 2 β 2 ) contact is the strongest and involves many amino acids with many interlocking side chains; the α 1 β 2 (and equivalent α 2 β 1 ) contact is less extensive, and the contacts between similar chains are relatively weak. The binding of a haem group within the haem pocket in each chain is vital for the oxygen-carrying capacity of the molecule and stabilises the whole molecule. If the haem attachment is weakened, the globin chains dissociate into dimers and monomers.
There are many naturally occurring, genetically determined variants of human haemoglobin (> 1000) and although many are harmless, some have serious clinical effects. Collectively, the clinical syndromes resulting from disorders of haemoglobin synthesis are referred to as ‘haemoglobinopathies’. They can be grouped into three main categories:
- 1.
Those resulting from a genetically determined structural variant of haemoglobin, such as haemoglobin S.
- 2.
Those owing to failure to synthesise one or more of the globin chains of haemoglobin at a normal rate, as in the thalassaemias.
- 3.
Those owing to failure to complete the normal neonatal switch from fetal haemoglobin (haemoglobin F) to adult haemoglobin (haemoglobin A). This category comprises a group of disorders referred to as hereditary persistence of fetal haemoglobin (HPFH).
An individual can also have a combination of two or more of these abnormalities (e.g. a variant haemoglobin can be synthesised at a reduced rate).
Structural variants of haemoglobin
Alterations in the structure of haemoglobin are usually brought about by point mutations affecting one or, in some cases, two codons encoding amino acids of the globin chains. An example of such a point mutation is haemoglobin S caused by the substitution of valine for glutamic acid in position 6 of the β-globin chain (β6 Glu → Val ). Less commonly, structural change is caused by shortening or lengthening of the globin chain. For example, five amino acids are deleted in the β chain of haemoglobin Gun Hill, whereas in haemoglobin Constant Spring, 31 amino acids are added to the α chain. Mutations associated with a frame shift can also lead to synthesis of a structurally abnormal haemoglobin, which may be either shorter or longer than normal. There may also be combinations of segments of β and either γ or δ chains resulting in hybrid haemoglobins; the β and δ combinations are known as the Lepore (5′δ3′β) and anti-Lepore (5′β3′δ) haemoglobins.
Many variant haemoglobins are haematologically and clinically silent because the underlying mutation causes no alteration in the function, solubility or stability of the molecule. Many of these variants are separated from their normal counterpart using electrophoresis or chromatography, but some are not and remain undetected. Some structural variants are associated with severe clinical phenotypes in the homozygous or even heterozygous state; these mutations affect the physical or chemical properties of the haemoglobin molecule, resulting in changes in haemoglobin solubility, stability or oxygen-binding properties. Some of these variants separate on electrophoresis or chromatography, whereas others do not. It is fortunate that the common haemoglobin variants that have clinical or genetic significance (e.g. haemoglobins S, C, D Punjab , E and O Arab ) are readily detectable by electrophoretic and chromatographic techniques.
Haemoglobins with reduced solubility
Haemoglobin S
By far the most common variant haemoglobin is sickle haemoglobin or haemoglobin S. Haemoglobin S has poor solubility in the deoxygenated state and can polymerise. The red cell shows a characteristic shape change because of polymer formation and becomes distorted and rigid, the so-called sickle cell (see p. 76, Fig. 5-53 ). In addition, intracellular polymers lead to red cell membrane changes, generation of oxidant substances and abnormal adherence of red cells to vascular endothelium and neutrophils.
Clinical syndromes associated with common structural variants and those owing to their interaction with β thalassaemia are shown in Table 14-1 .
| Haemoglobin | Genotype | Name | Clinical Problems |
|---|---|---|---|
| S | β A /β S | Sickle cell trait | Usually none |
| β S /β S | Sickle cell anaemia | Moderate anaemia, significant haemolysis, vaso-occlusive episodes and their consequences | |
| C | β A /β C | C trait | None |
| β C /β C | C disease | Mild haemolytic anaemia, increased incidence of gallstones | |
| D Punjab | β A /β D Punjab | D trait | None |
| β D /β D Punjab | D disease | Occasional mild anaemia | |
| O Arab | β A /β O Arab | O trait | None |
| β O Arab /β O Arab | O disease | Haemolytic anaemia | |
| Interactions | β S /β C | Sickle cell/haemoglobin C disease | Mild anaemia, haemolysis, vaso-occlusive episodes |
| β S /β D Punjab | Sickle cell/haemoglobin D disease | As for sickle cell anaemia | |
| β S /β O Arab | Sickle cell/haemoglobin O disease | As for sickle cell anaemia | |
| β S /β 0 thalassaemia | Sickle/β 0 thalassaemia | As for sickle cell anaemia | |
| β S /β + thalassaemia | Sickle/β + thalassaemia | Milder than sickle cell anaemia, severity being determined by the percentage of haemoglobins A and F | |
| β C /β thalassaemia | C/β thalassaemia | Mild haemolytic anaemia | |
| β D Punjab /β thalassaemia | D/β thalassaemia | Mild haemolytic anaemia | |
| β O Arab /β thalassaemia | O/β thalassaemia | Thalassaemia intermedia |
Sickle cell disease
Sickle cell disease is a collective name for a group of conditions causing clinical symptoms that result from the formation of sickled red cells. It is common in people originating from Africa, but it is also found in considerable numbers of people of Indian, Arabic and Greek descent.
The homozygous state or sickle cell anaemia (β genotype SS) causes moderate anaemia resulting largely from the reduced oxygen affinity of haemoglobin S, although there is also significant haemolysis. The main clinical disability arises from repeated episodes of vascular occlusion by sickled red cells resulting in acute crises and eventually in end organ damage. The clinical severity of sickle cell anaemia is extremely variable. This is partly due to the effects of inherited modifying factors, such as interaction with α thalassaemia or increased synthesis of haemoglobin F, and partly to socioeconomic conditions and other factors that influence general health.
Sickle cell trait (β genotype AS), the heterozygous state, is very common, affecting millions of people worldwide. There are no associated haematological abnormalities other than occasional target cells. In vivo sickling occurs only at very high altitudes and when oxygen pressure is low for other reasons. Spontaneous haematuria, owing to sickling in the renal papillae, is found in about 1% of people with sickle cell trait.
Sickle cell/haemoglobin C disease is a compound heterozygous state for haemoglobins S and C. The abbreviation ‘SC disease’ is ambiguous and should be avoided; however, the term haemoglobin SC disease is acceptable. This compound heterozygous state usually results in a milder form of sickle cell disease.
Sickle/β thalassaemia arises as a result of inheritance of one β S and one β thalassaemia gene. Africans and Afro-Caribbeans with this condition are often heterozygous for a mild β + thalassaemia allele resulting in the production of about 20% of haemoglobin A. This gives rise to a mild sickling disorder. The less common coinheritance of β S and β 0 thalassaemia is associated with severe sickle cell disease. Interaction of haemoglobin S with haemoglobin D Punjab (haemoglobin D Los Angeles ) or with Hb O Arab gives rise to severe sickle cell disease.
Haemoglobin C
Haemoglobin C is the second most common structural haemoglobin variant in people of African descent. The replacement of glutamic acid in position 6 of the β chain by lysine results in a haemoglobin molecule with a highly positive charge, decreased solubility and a tendency to crystallise. Haemoglobin C does not give a positive sickle solubility test. Heterozygotes are asymptomatic, but target cells and irregularly contracted cells may be present in blood films. Homozygotes may have mild haemolytic anaemia with numerous target cells and irregularly contracted cells (see Chapter 5, Fig. 5-49 ). Coinheritance of β C and β 0 or β + thalassaemia results in mild or moderate haemolytic anaemia.
Other sickling haemoglobins
In addition to haemoglobin S, there are at least thirteen haemoglobins (haemoglobins C Ziquinchor , C Harlem , C Ndjamena , S Antilles , S Cameroon , S Clichy , S Jamaica Plain , S Oman , S Providence , S San Martin , S South End , S Travis , S Wake ) that have both the β6 glutamic acid to valine substitution and an additional substitution, resulting from a second point mutation, in the same β globin chain. These haemoglobins also have a positive solubility test since they are prone to polymerise but generally exhibit different electrophoretic and chromatographic properties from haemoglobin S. They have clinical significance similar – but not necessarily identical – to that of haemoglobin S (e.g. haemoglobin S Antilles and haemoglobin S Oman are associated with an even greater propensity to sickling than haemoglobin S).
Unstable haemoglobins
Amino acid substitutions close to the haem group, or at the points of contact between globin chains, can affect protein stability and result in intracellular precipitation of globin chains. The precipitated globin chains attach to the red cell membrane giving rise to Heinz bodies, and the associated clinical syndromes were originally called the congenital Heinz body haemolytic anaemias. Changes in membrane properties may lead to haemolysis, often aggravated by oxidant drugs. There is considerable heterogeneity in the haematological and clinical effects of unstable haemoglobins. Many are almost silent and are detected only by specific tests, whereas others are more unstable, causing haemolytic anaemia in the heterozygous state. Haemoglobin Köln is the most common variant in this rare group of disorders. ,
Haemoglobins with altered oxygen affinity
Haemoglobin variants with altered oxygen affinity are a rare group of variants that result in increased or reduced oxygen affinity. Mutations that increase oxygen affinity are generally associated with benign lifelong erythrocytosis. This may be confused with polycythaemia vera and in the past has been inappropriately treated with cytotoxic drugs and 32 P.
Haemoglobin variants with decreased oxygen affinity are, with the exception of haemoglobin S, even less common and are usually associated with mild anaemia and cyanosis. However, owing to the reduced oxygen affinity, these patients are not functionally anaemic despite the reduced haemoglobin concentration (Hb). The low steady-state Hb in haemoglobin S homozygotes is, to a considerable extent, a result of its reduced oxygen affinity.
Measurement of oxygen dissociation is described on p. 251.
Haemoglobin M
The haemoglobin M group is another rare group of variants. Such haemoglobins have a propensity to form methaemoglobin, generated by the oxidation of ferrous iron (Fe ++ ) in haem to ferric (Fe +++ ) iron, which is incapable of binding oxygen. Despite marked cyanosis, there are few clinical problems. Most are associated with substitutions that disrupt the normal six-ligand state of haem iron.
Methaemoglobinaemia is also found in congenital nicotinamide adenine dinucleotide (NAD) H methaemoglobin reductase deficiency, as well as after exposure to oxidant drugs and chemicals (nitrates, nitrites, quinones, chlorates, phenacetin, dapsone and many others).
Thalassaemia syndromes
The thalassaemia syndromes are a heterogeneous group of inherited conditions characterised by defects in the synthesis of one or more of the globin chains that form the haemoglobin tetramer. The clinical syndromes associated with thalassaemia arise from the combined consequences of inadequate haemoglobin production and of unbalanced accumulation of one type of globin chain. The former causes anaemia with hypochromia and microcytosis; the latter leads to ineffective erythropoiesis and haemolysis. Clinicopathological manifestations range from completely asymptomatic microcytosis to profound anaemia that is incompatible with life and can cause death in utero ( Table 14-2 ). This clinical heterogeneity arises as a result of the variable severity of the primary genetic defect in haemoglobin synthesis and the coinheritance of moderating factors, such as the capacity to synthesise increased amounts of haemoglobin F.
| Clinically asymptomatic |
| Silent carriers |
| α + thalassaemia heterozygotes (some cases) |
| Rare forms of β thalassaemia heterozygosity |
| Thalassaemia minor (low MCH and MCV, with or without mild anaemia) |
| α + thalassaemia heterozygotes (some cases) |
| α 0 thalassaemia heterozygotes |
| α + thalassaemia homozygotes |
| β 0 thalassaemia trait |
| β + thalassaemia trait |
| Some cases of haemoglobin E/β thalassaemia |
| Thalassaemia intermedia (transfusion independent) * |
| Some β + /β + thalassaemia homozygotes and compound heterozygotes |
| Interaction of β 0 /β 0 , β 0 /β + or β + /β + with α thalassaemia |
| Interaction of β 0 /β or β + /β with triple α |
| Haemoglobin H disease |
| α 0 /haemoglobin Constant Spring thalassaemia |
| β 0 /δβ or β + /δβ thalassaemia compound heterozygotes |
| δβ/δβ thalassaemia |
| Some cases of haemoglobin E/β thalassaemia and haemoglobin Lepore/β thalassaemia |
| Rare cases of heterozygotes for β thalassaemia mutation, particularly involving exon 3 (‘dominant β thalassaemia’) |
| Thalassaemia major (transfusion dependent) |
| β 0 /β 0 thalassaemia |
| β + /β + thalassaemia |
| β 0 /β + thalassaemia |
| Some cases of β 0 /haemoglobin Lepore and β + /haemoglobin Lepore thalassaemia |
| Some cases of β 0 /haemoglobin E and β + /haemoglobin E thalassaemia |
* β thalassaemia intermedia is defined as a symptomatic condition in which regular transfusion is not essential to maintain life; however some patients have a poor quality of life and may benefit from transfusion as their condition progresses (e.g. when there is increasing splenomegaly).
Thalassaemias are generally inherited as alleles of one or more of the globin genes located on either chromosome 11 (for β, γ and δ chains) or on chromosome 16 (for α chains). They are encountered in every population in the world but are most common in the Mediterranean littoral and near equatorial regions of Africa and Asia. Gene frequencies for the α and β thalassaemias on a global basis range from 1% to more than 80% in areas where malaria is endemic.
β thalassaemia syndromes
Many different mutations cause β thalassaemia and related disorders. These mutations can affect every step in the pathway of globin gene expression: transcription, processing of the messenger ribonucleic acid (mRNA) precursor, translation of mature mRNA and preservation of post-translational integrity of the β chain. More than 400 mutations have been described. Most types of β thalassaemia are the result of point mutations affecting the globin gene, but some large deletions are also known. Certain mutations are particularly common in some communities. This helps to simplify prenatal diagnosis, which is carried out by detection or exclusion of a particular mutation in fetal deoxyribonucleic acid (DNA).
The effect of different mutations varies greatly. At one end of the spectrum are a group of rare mutations, mainly involving exon 3 of the β globin gene, which are so severe that they can produce the clinical syndrome of thalassaemia intermedia in the heterozygous state. At the other end are mild alleles that produce thalassaemia intermedia in the homozygous or compound heterozygous state and some that are so mild that they are haematologically completely silent, with normal mean cell volume (MCV), mean cell haemoglobin (MCH) and haemoglobin A 2 in the heterozygous state. In between are the great majority of β + and β 0 alleles, which cause β thalassaemia major in the homozygous or compound heterozygous state and in the heterozygous state give rise to a mild anaemia or Hb at the low end of the normal range, with microcytosis and a raised haemoglobin A 2 .
β thalassaemia major is a severe, transfusion-dependent, inherited anaemia. There is a profound defect of β chain production. Excess α chains accumulate and precipitate in the red cell precursors in the bone marrow resulting in ineffective erythropoiesis. The few cells that leave the marrow are laden with precipitated α chains and are rapidly removed by the reticuloendothelial system. The constant erythropoietic drive causes massive expansion of bone marrow and extramedullary erythropoiesis. If untreated, 80% of children with β thalassaemia major die within the first 5 years of life.
Heterozygotes for β thalassaemia alleles usually have either a normal Hb with microcytosis or a mild hypochromic microcytic anaemia; haemoglobin A 2 is elevated and haemoglobin F is sometimes also elevated. Laboratory features of various β thalassaemia syndromes are shown in Table 14-3 .
| Phenotype | Genotype | Usual MCV | Usual MCH | Haemoglobin A 2 | Haemoglobin H Inclusions |
|---|---|---|---|---|---|
| α thalassaemia | |||||
| α + thalassaemia heterozygosity | − α/αα | N | N | N or ↓ | − |
| α + thalassaemia homozygosity | − α/− α | N or ↓ | N or ↓ | N or ↓ | ± |
| α 0 thalassaemia heterozygosity | − −/αα | ↓ | ↓ | N or ↓ | + |
| Haemoglobin H disease | |||||
| Mild or moderate | − −/− α | ↓ | ↓ | N or ↓ | +++ |
| Severe | − −/α T α | ↓ | ↓ | N or ↓ | +++ |
| Haemoglobin Bart’s hydrops fetalis (α thalassaemia major) α 0 homozygosity | − −/− − | ↓ | ↓ | − | − |
| β thalassaemia | |||||
| β thalassaemia trait | β 0 /β or β + /β | ↓ | ↓ | ↑ | − |
| β thalassaemia trait with normal Hb A 2 | β + /β | ↓ | ↓ | N | − |
| δβ thalassaemia trait | δβ 0 /β | ↓ | ↓ | N or ↓ | − |
| Hb Lepore trait | δβ Lepore /β | ↓ | ↓ | N or ↓ | − |
| β thalassaemia intermedia | Heterogeneous | ↓ | ↓ | ↑ or N | − |
| β thalassaemia major | β 0 /β 0 , β 0 /β + , β + /β + | ↓ | ↓ | ↑ or N | |
α thalassaemia syndromes
There are four α thalassaemia syndromes: α + thalassaemia trait, where one of the two globin genes on a single chromosome is absent or fails to function; α 0 thalassaemia trait, where a chromosome has no functional α genes; haemoglobin H disease, usually with three genes absent or defective; and haemoglobin Bart’s hydrops fetalis, where all four genes are absent or severely defective. These syndromes are usually a result of deletions of one or more genes, although approximately 20% of the mutations described are nondeletional; nondeletional α thalassaemias include some where a variant haemoglobin is synthesised at a greatly reduced rate (e.g. haemoglobin Constant Spring). α + thalassaemia is particularly common in Africa and Southeast Asia, whereas α 0 thalassaemia is common in Southeast Asia and also occurs in certain Mediterranean countries. The laboratory features are shown in Table 14-3 .
Haemoglobin Bart’s hydrops fetalis occurs mainly in people from Southeast Asia but is also occasionally observed in people from Greece, Turkey and Cyprus. An affected fetus will be stillborn or will die shortly after birth. Severe anaemia and oedema are the hallmarks of this condition. Women carrying a hydropic fetus have a high incidence of complications of pregnancy. Prenatal diagnosis should be offered for women at risk of having a fetus with haemoglobin Bart’s hydrops fetalis.
Haemoglobin H disease gives rise to haemolytic anaemia; rarely patients require transfusion or splenectomy.
α 0 thalassaemia trait is characterised by microcytosis. The Hb may be normal or slightly reduced. α + thalassaemia trait can be completely silent, or there may be borderline microcytosis with a slightly reduced or normal MCH. Haematologically, homozygosity for α + thalassaemia trait resembles heterozygosity for α 0 thalassaemia trait, but the genetic implications are very different. Both α + thalassaemia trait and α 0 thalassaemia trait are more difficult to diagnose than β thalassaemia trait because there is no characteristic elevation in haemoglobin A 2 , and haemoglobin H inclusions may not be demonstrated. Definitive diagnosis of α thalassaemia trait is more reliably made with the use of DNA techniques or globin chain biosynthesis studies.
Thalassaemic structural variants
These are abnormal haemoglobins, such as the Lepore haemoglobins, characterised by both a biosynthetic defect and an abnormal structure ( Table 14-4 ).
| Haemoglobin | Structure | When Heterozygous | When Homozygous | In Combination with Other Haemoglobinopathies , |
|---|---|---|---|---|
| Lepore | Hybrid of part of δ and part of β chain owing to unequal crossover | Microcytosis, sometimes mild anaemia | Thalassaemia major or intermedia | With β thalassaemia gives thalassaemia major or intermedia |
| E † | β 26Glu → Lys resulting in a structural variant and a false splice site | Microcytosis, sometimes mild anaemia | Microcytosis, mild anaemia | With β thalassaemia gives thalassaemia major or intermedia |
| Constant Spring or Paksé | Elongated α chain owing to incorporation of 31 extra amino acids | Microcytosis, mild anaemia | Microcytosis, mild anaemia or haemoglobin H disease | With α 0 thalassaemia gives haemoglobin H disease |
* Many other thalassaemic structural variants have been described but are much rarer than the three shown in this table.
† 13–30% frequency in Cambodia, Thailand, Vietnam and some parts of China.
Increased haemoglobin F in adult life
Haemoglobin production in man is characterised by two major switches in the haemoglobin composition of the red cells. During the first 3 months of gestation, human red cells contain embryonic haemoglobins (see p. 283), whereas during the last 6 months of gestation, red cells contain predominantly fetal haemoglobin. The major transition from fetal to adult haemoglobin synthesis occurs in the perinatal period, and by the end of the first year of life, red cells have a haemoglobin composition that usually remains constant throughout adult life. The major haemoglobin is then haemoglobin A, but there are small amounts of haemoglobins A 2 and F. Only 0.2–1.0% of total haemoglobin in adult human red cells is haemoglobin F and it is restricted to a few cells called ‘F cells’. Both the number of F cells and the amount of haemoglobin F per cell can be increased in various conditions, particularly if there is rapid bone marrow regeneration.
The general organisation of human globin gene clusters is shown in Figure 14-1 . The products of two γ genes differ in only one amino acid: G γ has glycine in position 136, whereas A γ has alanine. In fetal red cells, the ratio of G γ to A γ is approximately 3:1; in adult red cells, it is approximately 2:3.
In recent years there has been much interest in the attempts to manipulate the fetal switch pharmacologically. If it were possible to reactivate haemoglobin F synthesis reliably beyond the perinatal period, both β thalassaemia major and sickle cell disease would be ameliorated.
Inherited abnormalities that increase haemoglobin F concentration
More than 50 mutations that increase haemoglobin F synthesis have been described. , They result in one of two phenotypes, hereditary persistence of HPFH or δβ thalassaemia; differentiation between these two phenotypes is not always simple but has clinical relevance. In general, HPFH has a higher percentage of haemoglobin F and much more balanced chain synthesis. The most common, the African type of HPFH, is associated with a high concentration of haemoglobin F (15–45%), pancellular distribution on Kleihauer staining and normal red cell indices. Mutations causing increased synthesis of haemoglobin F are mostly deletions, but some nondeletional mutations have also been described. In contrast, subjects with δβ thalassaemia have lower levels of haemoglobin F accompanied by microcytosis. The major clinical significance of these abnormalities is their interaction with β thalassaemia and haemoglobin S. Compound heterozygotes for either of these conditions and HPFH have a much milder clinical syndrome than homozygotes for haemoglobin S or β thalassaemia. Compound heterozygotes for either of these conditions and δβ thalassaemia have a condition much closer in severity to the homozygous states for HPFH or δβ thalassaemia.
Increased haemoglobin F is also found in many other haematological conditions, including inherited red cell aplasia and inherited aplastic anaemia (Blackfan–Diamond syndrome and Fanconi anaemia, respectively), juvenile myelomonocytic leukaemia and some myelodysplastic syndromes. A small but significant increase in haemoglobin F may occur in the presence of erythropoietic stress (haemolysis, bleeding, recovery from acute bone marrow failure) and in pregnancy.
Investigation of patients with a suspected haemoglobinopathy
Investigation of a person at risk of a haemoglobinopathy encompasses the confirmation or exclusion of the presence of a structural variant, thalassaemia or both. If a structural haemoglobin variant is present, it is necessary to ascertain the clinical significance of the particular variant so that the patient is appropriately managed. If it is confirmed that thalassaemia trait is present, it is not usually necessary to determine the precise mutation because the clinical significance is usually negligible. The exception to this is an antenatal patient whose partner has confirmed or suspected thalassaemia trait. If prenatal diagnosis is being considered, mutation analysis is necessary to predict fetal risk accurately and to facilitate prenatal diagnosis (see p. 134).
Because the inheritance of a haemoglobinopathy per se has genetic implications, it is important that genetic counselling is available for these patients.
In the majority of patients, the presence of a haemoglobinopathy can be diagnosed with sufficient accuracy for clinical purposes from knowledge of the patient’s ethnic origin and clinical history (including family history) and the results of physical examination combined with relatively simple haematological tests. Initial investigations should include determination of Hb and red cell indices. A detailed examination of a well-stained blood film should be carried out. In some instances, a reticulocyte count and a search for red cell inclusions gives valuable information. Assessment of iron status by estimation of serum ferritin is sometimes necessary to exclude iron deficiency. Other important basic tests are high performance liquid chromatography (HPLC), capillary electrophoresis (CE) or cellulose acetate electrophoresis (CAE), a sickle solubility test and measurement of haemoglobin A 2 and F percentages. In the case of common haemoglobin variants and classic β thalassaemia trait, accurate data from these tests will permit a reliable diagnosis without the need for more sophisticated investigations. However, definitive diagnosis of some thalassaemia syndromes can only be obtained using DNA technology (see p. 134 and p. 135). Similarly, in particular situations, haemoglobin variants will require unequivocal identification by the use of DNA technology or protein analysis by mass spectrometry. Individuals or families who require such investigation must be carefully selected on the basis of family history and on the results of the basic investigations described later in this chapter. Large-scale screening programmes are increasingly being undertaken in some countries where individual case histories and the results of other laboratory tests are not usually available. The problems of such programmes are discussed on p. 299.
The majority of errors occurring in the detection and identification of a haemoglobinopathy are the result of either failure to obtain correct laboratory data or failure to interpret data correctly. In this chapter, a sequence of investigations is proposed based on procedures that should be available in the laboratory of any major hospital. Automated HPLC has largely replaced haemoglobin electrophoresis as the initial investigative procedure in laboratories analysing large numbers of samples. Capillary electrophoresis is currently less used than HPLC. Isoelectric focusing (IEF) is, in general, used only to a limited extent, mainly for neonatal screening or in specialist laboratories, and it is only briefly described here.
Laboratory investigation of a suspected haemoglobinopathy should follow a defined protocol, which should be devised to suit individual local requirements. The data obtained from the clinical findings, blood picture and electrophoresis or HPLC will usually indicate in which direction to proceed. The investigation for a structural variant is described in the first section and that for a suspected thalassaemia syndrome in the second section of this chapter. Screening tests for thalassemia trait and haemoglobin E trait that may be especially applicable in under-resourced areas are described in Chapter 26 .
Laboratory detection of haemoglobin variants
A proposed scheme of investigation is shown in Figure 14-2 and a list of procedures follows: ,
- 1.
Blood count and film examination (see below)
- 2.
Collection of blood and preparation of haemolysates (see p. 291)
- 3.
Cellulose acetate electrophoresis, Tris buffer, pH 8.5 (see p. 292)
- 4.
Acid agarose gel electrophoresis, pH 6.0 (see p. 294)
- 5.
Automated high performance liquid chromatography (see p. 294)
- 6.
Capillary electrophoresis (see p. 296)
- 7.
Isoelectric focusing (see p. 297)
- 8.
Tests for haemoglobin S (see p. 297)
- 9.
Detection of unstable haemoglobins (see p. 299)
- 10.
Detection of haemoglobin Ms (see p. 300)
- 11.
Detection of altered affinity haemoglobins (see p. 301)
- 12.
Differentiation of common structural variants (see p. 301)
- 13.
Neonatal screening (see p. 299)
- 14.
Tests, such as zinc protoporphyrin estimation, to exclude iron deficiency as a cause of microcytosis (see Chapter 9 )
- 15.
Molecular techniques (see Chapter 8 )
- 16.
Procedures for use in under-resourced laboratories (see Chapter 26 ).
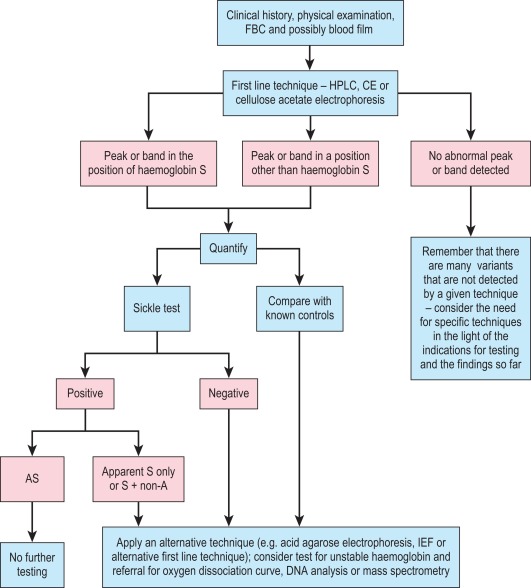
Globin chain electrophoresis at pH 8.0 and 6.3 and citrate agar electrophoresis at acid pH are now rarely performed. Methods can be found in previous editions of this book.
Blood count and film
The blood count, including Hb and red cell indices, provides valuable information useful in the diagnosis of both α and β thalassaemia interactions with structural variants (see Chapter 3 ). A film examination may reveal characteristic red cell changes such as target cells in haemoglobin C trait, sickle cells in sickle cell disease and irregularly contracted cells in the presence of haemoglobin C or an unstable haemoglobin (see Chapter 5 ).
Discriminant functions using various formulae have been proposed as a basis for further testing for thalassaemia, , but we do not advise their use. Although such functions and formulae do indicate whether thalassaemia or iron deficiency is more likely, they may lead to individuals who have both iron deficiency and thalassaemia trait not being tested promptly. Generally this is not a problem and indeed it may be preferable to keep the patient under observation until iron deficiency has been treated and then to reassess the likelihood of thalassaemia trait. However, many of the patients who require testing for thalassaemia are women who are already pregnant. In such patients the likely delay in testing is unacceptable. Moreover, these formulae have generally not been validated for use during pregnancy. For these reasons, we advise that whenever genetic counselling might be required, testing for β thalassaemia trait should be carried out in all individuals with an MCH < 27 pg and screening for α 0 thalassaemia trait should be carried out in those individuals with an MCH < 25 pg who belong to an ethnic group in which α 0 thalassaemia is prevalent.
Collection of blood and preparation of haemolysates
Ethylenediaminetetra-acetic acid (EDTA) is the most convenient anticoagulant because it is used for the initial full blood count and film (see Chapter 1 ), although samples taken into any anticoagulant are satisfactory. Cells freed from clotted blood can also be used.
Preparation of haemolysate for qualitative haemoglobin electrophoresis
See individual methods.
Preparation of haemolysate for the quantification of haemoglobins and stability tests
Preparation of haemolysate is necessary for quantification of haemoglobin A 2 or a variant haemoglobin by elution and for the quantification of haemoglobin F by alkali denaturation. It is also essential for reliable heat stability tests.
Lyse 2 volumes of washed packed cells in 1 volume of distilled water. Shake the tubes vigorously for approximately 1 min, then centrifuge at 1200 g (3000 rev/min on a standard bench-top centrifuge) for 30 min at 4 °C. Transfer the supernatant to a clean sample container and adjust the Hb to 100 ± 10 g/l with water. The quality of the haemolysate is much improved by the addition of carbon tetrachloride (1 volume) prior to shaking the haemolysate mixture. However, the use of organic solvents is not recommended in many countries and therefore should be omitted. Be aware that if an unstable haemoglobin is suspected, organic solvents should be avoided in haemolysate preparation.
Note : Whole blood samples are best stored as washed, packed cells frozen as droplets in liquid nitrogen and subsequently stored at − 20 °C, − 70 °C or over liquid nitrogen. Alternatively, haemolysates may also be frozen at − 20 °C, − 70 °C or over liquid nitrogen.
Control samples
Interpretation of migration patterns of test samples is undertaken by comparison with the migration and separation of known variant haemoglobins used as control materials. Ideally, a mixture of haemoglobins A, F, S and C should be included on each electrophoretic separation. This material can be prepared as follows:
- 1.
The control can be made from either the combination of a sickle cell trait sample (A + S) combined with a haemoglobin C trait sample (A + C) and normal cord blood (F + A) or the combination of normal cord blood with a sample from a person with sickle cell/haemoglobin C compound heterozygosity (S + C).
- 2.
Prepare lysates by the method given for a purified haemolysate.
- 3.
Mix equal volumes of the lysates together and add a few drops of 0.3 mol/l KCN (20 g/l).
- 4.
Analyse samples by electrophoresis to assess quality.
- 5.
Aliquot and store frozen.
Note : Repeated freezing and thawing should be avoided.
Lyophilised controls are stable for considerably longer than liquid and can be purchased from commercial sources.
Quality assurance
Because the haemoglobinopathies are inherited conditions, some of which carry considerable clinical and genetic implications, precise documentation and record-keeping are of paramount importance. The use of cumulative records when reviewing a patient’s data is very useful, because it of itself constitutes an aspect of quality assurance. In some situations, repeat sampling, family studies or both may be required to elucidate the nature of the abnormality in an individual.
In-house standard operating procedures should be followed carefully, particularly in this field of haematology, where a small difference in technique can make a significant difference in the results obtained and can lead to misdiagnosis. Many of the techniques described have attention drawn to specific technical details that are important for ensuring valid results.
It is necessary to use reference standards and control materials in each of the analyses undertaken and in some cases to use duplicate analysis to demonstrate precision. There are international standards for haemoglobins F and A 2 (see p. 536), whereas in some countries national reference preparations are also available from national standards institutions. These are extremely valuable because the target values have been established by collaborative studies. Control materials can be prepared in-house or obtained commercially. Samples stored as whole blood at 4 °C can be used reliably for several weeks. All laboratories should confirm the normal range for their particular methods and the normal range obtained should not differ significantly from published data.
All laboratories undertaking haemoglobin analysis should participate in an appropriate proficiency testing programme (see p. 539). In the UK, the National External Quality Assessment Service (NEQAS) provides samples for sickle solubility tests, for detection and quantification of variant haemoglobins and for quantification of haemoglobins A 2 , F and S.
National and international guidelines have been published for all aspects of the investigations given here. ,
Cellulose acetate electrophoresis at alkaline pH
Haemoglobin electrophoresis at pH 8.4–8.6 using cellulose acetate membrane is simple, reliable and rapid. It is satisfactory for the detection of most common, clinically important haemoglobin variants.
Principle
At alkaline pH, haemoglobin is a negatively charged protein, and when subjected to electrophoresis will migrate toward the anode (+). Structural variants that have a change in the charge on the surface of the molecule at alkaline pH will separate from haemoglobin A. Haemoglobin variants that have an amino acid substitution that is internally sited may not separate, and those that have an amino acid substitution that has no effect on overall charge will not separate by electrophoresis.
Equipment
- •
Electrophoresis tank and power pack. Any horizontal electrophoresis tank that will allow a bridge gap of 7 cm. A direct current power supply capable of delivering 350 V at 50 mA is suitable for both cellulose acetate and acid agarose gels.
- •
Wicks of filter or chromatography paper
- •
Blotting paper
- •
Applicators . These are available from most manufacturers of electrophoresis equipment, but fine microcapillaries are also satisfactory.
- •
Cellulose acetate membranes . Plastic-backed membranes (7.6 × 6.0 cm) are recommended for ease of use and storage.
- •
Staining equipment
Reagents
- •
Electrophoresis buffer. Tris/EDTA/borate (TEB), pH 8.5. Tris-(hydroxymethyl)aminomethane (Tris), 10.2 g; EDTA (disodium salt), 0.6 g; boric acid, 3.2 g; water to 1 litre. The buffer should be stored at 4 °C and can be used up to 10 times without deterioration.
- •
Wetting agent. For example, Zip Zone Prep solution (Helena Laboratories, www.helena.com ): 1 drop of Zip Zone Prep in 100 ml water
- •
Fixative/stain solution. Ponceau S ( www.helena.com ), 5 g; trichloroacetic acid, 7.5 g; water to 1 litre
- •
Destaining solution. 3% (v/v) acetic acid, 30 ml; water to 1 litre
- •
Haemolysing reagent. 0.5% (v/v) Triton X-100 ( www.helena.com ) in 100 mg/l potassium cyanide.
Method
- 1.
Centrifuge samples at 1200 g for 5 min. Dilute 20 μl of the packed red cells with 150 μl of the haemolysing reagent. Mix gently and leave for at least 5 min. If purified haemolysates are used, dilute 40 μl of 100 g/l haemolysate with 150 μl of lysing reagent.
- 2.
With the power supply disconnected, prepare the electrophoresis tank by placing equal amounts of TEB buffer in each of the outer buffer compartments. Wet two chamber wicks in the buffer, and place one along each divider/bridge support ensuring that they make good contact with the buffer.
- 3.
Soak the cellulose acetate by lowering it slowly into a reservoir of buffer. Leave the cellulose acetate to soak for at least 5 min before use.
- 4.
Fill the sample well plate with 5 μl of each diluted sample or control and cover with a 50 mm coverslip or a ‘short’ glass slide to prevent evaporation. Load a second sample well plate with Zip Zone Prep solution.
- 5.
Clean the applicator tips immediately prior to use by loading with Zip Zone Prep solution and then applying them to a blotter.
- 6.
Remove the cellulose acetate strip from the buffer and blot twice between two layers of clean blotting paper. Do not allow the cellulose acetate to dry.
- 7.
Load the applicator by depressing the tips into the sample wells twice and apply this first loading onto some clean blotting paper. Reload the applicator and apply the samples to the cellulose acetate.
- 8.
Place the cellulose acetate plates across the bridges, with the plastic side uppermost. Place two glass slides across the strip to maintain good contact. Electrophorese at 350 V for 25 min.
- 9.
After 25 min electrophoresis, immediately transfer the cellulose acetate to Ponceau S and fix and stain for 5 min.
- 10.
Remove excess stain by washing for 5 min in the first acetic acid reservoir and for 10 min in each of the remaining two. Blot once, using clean blotting paper and leave to dry.
- 11.
Label the membranes and store in a protective plastic envelope.
Interpretation and comments
Figure 14-3 shows the relative electrophoretic mobilities of some common haemoglobin variants at pH 8.5 on cellulose acetate. Satisfactory separation of haemoglobins C, S, F, A and J is obtained ( Fig. 14-4 ). In general, haemoglobins S, D and G migrate closely together, as do haemoglobins C, E and O Arab . Differentiation between these haemoglobins can be obtained by using acid agarose gels, HPLC or IEF. There are slight differences in mobility between haemoglobins S, Lepore and D Punjab and also between haemoglobins C and E. Generally, the Lepore haemoglobins and Hb D Punjab migrate slightly anodal to haemoglobin S (i.e. they are slightly faster than S); haemoglobin C migrates slightly cathodal to haemoglobin E (i.e. it is slightly slower than E). These differences are, however, too subtle to avoid the necessity for a second confirmatory technique.
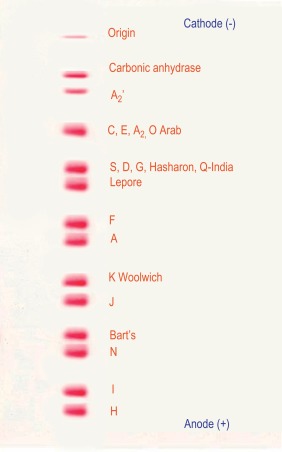
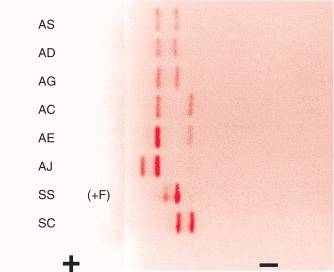
All samples showing a single band in either the S or C position should be analysed further using acid agarose gel electrophoresis, HPLC or IEF to exclude the possibility of a compound heterozygote state such as SD, SG, CE or CO Arab .
The quality of separation resulting from this procedure is affected primarily by both the amount of haemoglobin applied and the positioning of the origin. Also, delays between application of the sample and commencement of the electrophoresis, delay in staining after electrophoresis or inadequate blotting of the acetate prior to application will cause poor results. This technique is sensitive enough to separate haemoglobin F from haemoglobin A and to detect haemoglobin A 2 variants as long as the strip is inspected carefully.
If an abnormal haemoglobin is present, the detection of a haemoglobin A 2 variant band in conjunction with the abnormal fraction is evidence that the variant is an α chain variant.
When an abnormal haemoglobin is found, it may be of diagnostic importance to measure the percentage of the variant; this can be done by the electrophoresis with elution procedure for haemoglobin A 2 estimation given on p. 303. Quantification of haemoglobin S is often clinically useful, both in patients with sickle cell disease who are being treated by transfusion and for the diagnosis of conditions in which haemoglobin S is co-inherited with α and β thalassaemia, as outlined in Table 14-5 . Quantification of haemoglobin S can be done with HPLC, electrophoresis with elution or microcolumn chromatography.
| MCV | % S | % A | % A 2 | % F | |
|---|---|---|---|---|---|
| AS | N | 35–38 | 62–65 | < 3.5 | < 1 |
| SS | N | 88–93 | 0 | < 3.5 | 5–10 |
| S/β 0 thalassaemia | L | 88–93 | 0 | > 3.5 | 5–10 |
| S/β + thalassaemia | L | 50–93 | 3–30 | > 3.5 | 1–10 |
| S/HPFH | N | 65–80 | 0 | < 3.5 | 20–35 |
| AS/α + thalassaemia | N/L | 28–35 | 62–70 | < 3.5 | < 1 |
| AS/α 0 thalassaemia | L | 20–30 | 68–78 | < 3.5 | < 1 |
| SS/α thalassaemia | N/L | 88–93 | 0 | < 3.5 | 1–10 |
Agarose gel electrophoresis
Agarose gels are commercially available as for both alkaline and acid electrophoresis. They are simple to use and particularly useful in laboratories that process small numbers of samples.
Reagents and method
The manufacturer’s method should be followed.
Interpretation
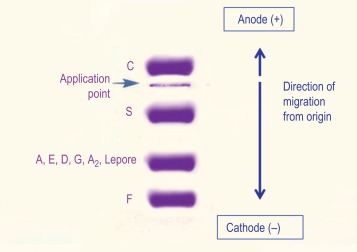
With alkaline systems, in general the same separation patterns are obtained as for CAE, but where individual application notes are available these should be used for reference. Because not all kits provide these, laboratories may need to build up their own data on known variants. At acid pH, the migration pattern helps to distinguish haemoglobin S from D/G and haemoglobin C from E ( Fig. 14-5 ).
Automated high performance liquid chromatography
Automated cation-exchange HPLC is being used increasingly as the initial diagnostic method in haemoglobinopathy laboratories with a high workload. Both capital and consumable costs are higher than with haemoglobin electrophoresis, but labour costs are less; overall costs may be similar. In comparison with haemoglobin electrophoresis, HPLC has four advantages:
- 1.
The analysers are automated and thus require less staff time and permit processing of large batches.
- 2.
Very small samples (5 μl) are sufficient for analysis; this is especially useful in paediatric work.
- 3.
Quantification of normal haemoglobins (including haemoglobin A 2 ) and variant haemoglobins is available on every sample.
- 4.
A provisional identification of a larger proportion of variant haemoglobins can be made.
Principle
HPLC depends on the interaction of charged groups on the ion exchange material with charged groups on the haemoglobin molecule. A typical column packing is 5 μm spherical silica gel. The surface of the support is modified by carboxyl groups to have a weakly cationic charge, which allows the separation of haemoglobin molecules with different charges by ion exchange. When a haemolysate containing a mixture of haemoglobins is adsorbed onto the resin, the rate of elution of different haemoglobins is determined by the pH and ionic strength of any buffer applied to the column. With automated systems now in use, elution of the charged molecules is achieved by a continually changing salt gradient; fractions are detected as they pass through an ultraviolet/visible light detector and are recorded on an integrating computer system. Analysis of the area under these absorption peaks gives the percentage of the fraction detected. The time of elution (retention time) of any normal or variant haemoglobin present is compared with that of known haemoglobins, providing quantification of both normal haemoglobins (A, F and A 2 ) and many variants.
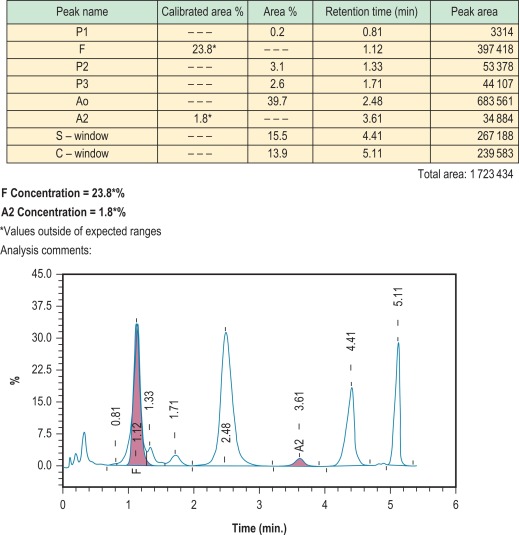
Figure 14-6 shows a schematic representation of an HPLC system and Figure 14-7 shows a chromatogram of a mixture of different haemoglobins. Systems are available from various manufacturers.

Method
The manufacturer’s procedure should be followed. To prolong the life of the column it is important to follow the manufacturer’s instructions with regard to the concentration of haemoglobin in the sample to be injected.
Interpretation and comments
Results are generally accurate and reproducible, but as with every method of haemoglobin analysis, controls should be run with every batch. Controls are provided by manufacturers and should be used according to their instructions. If the system is being used for the detection of haemoglobin variants, elution times can be compared with those of known controls; actual times, however, are affected by the batch of buffer and column, the age of the column and the laboratory temperature. A better comparison may be obtained using the relative elution time, which is calculated by dividing the elution time of the variant with that of the main haemoglobin A fraction. It should be noted that haemoglobin A is separated into its component fractions of A 0 and A 1 , and the A 1 fraction frequently subdivides into several peaks. Skill is required in interpretation of the results because various normal and abnormal haemoglobins may have the same retention time, and a glycosylated variant haemoglobin will have a different retention time from the nonglycosylated form. HPLC usually separates haemoglobins A, A 2 , F, S, C, D Punjab and G Philadelphia from each other. , However, both haemoglobin E and haemoglobin Lepore co-elute with haemoglobin A 2 (as other haemoglobins co-elute with A, S and F). The retention time of glycosylated and other derivatives of haemoglobin S can be the same as those of haemoglobins A 0 and A 2 . Since derivatives of haemoglobin S co-elute with haemoglobin A 2 , percentages of A 2 by this method are inaccurate in the presence of S, and therefore do not have the same significance as percentage of haemoglobin A 2 measured by alternative methods. For these reasons, and because there are more than 1000 known variants, HPLC can never definitively identify any haemoglobin. It is important to analyse variants found using second-line techniques, such as a sickle solubility test, alkaline and acid electrophoresis, or iso-electric focusing.
HPLC is also applicable for the quantification of Hb A 1c for the monitoring of diabetes mellitus; to make optimal use of staff and equipment, this procedure is sometimes carried out in haematology laboratories. In fact, an increased glycosylated fraction is not infrequently noted when HPLC is performed for investigation of a suspected haemoglobinopathy. Unless the patient is already known to suffer from diabetes mellitus, this abnormality should be drawn to the attention of clinical staff.
Capillary electrophoresis
Principle
Capillary zone electrophoresis is an automated method in which haemoglobins are separated from each other by electrophoresis at alkaline pH within a capillary tube. The separation of normal and variant haemoglobins is similar to that of CAE at alkaline pH but because the pH is slightly different and the voltage is higher, results are not identical. Haemoglobin E separates from haemoglobin A 2 and haemoglobin C shows partial separation from haemoglobin A 2 . Haemoglobins C and E separate from each other and haemoglobins S and D Punjab separate from each other. Typical separation is shown in Figure 14-8 .
Method
The recommendations of the instrument manufacturer should be followed. Controls are provided by manufacturers.
Interpretation and comments
Advantages of this technique include low sample volume, rapid throughput, availability of haemoglobin A 2 quantification and ease of interpretation in comparison with HPLC and IEF, since post-translationally modified haemoglobins are not separated from the parent haemoglobin. The Capillarys instruments that are mainly used for this technique have the disadvantage that the migration position of a variant haemoglobin is only determined in the presence of haemoglobins A and A 2 . If either of these is absent, they must be added in order for the instrument to identify the likely nature of a variant haemoglobin. As for other methods, provisional identification must be confirmed by a second method.
Isoelectric focusing
Principle
IEF utilises a matrix containing carrier ampholytes of low molecular weight and varying isoelectric points (pIs). These molecules migrate to their respective pIs when a current is applied, resulting in a pH gradient being formed; for haemoglobin analysis, a pH gradient of 6–8 is usually used. Haemoglobin molecules migrate through the gel until they reach the point at which their individual pIs equal the corresponding pH on the gel. At this point, the charge on the haemoglobin is neutral and migration ceases. The pH gradient counteracts diffusion and the haemoglobin variant forms a discrete narrow band. ,
Method
Pre-prepared plates of either polyacrylamide or agarose gel can be obtained from various manufacturers. For the exact method, the manufacturer’s instructions should be followed. Controls should be included in each run. It is useful to have one control containing haemoglobins A, F, S and E and another containing A, F, D Punjab and C.
Interpretation and comments
IEF is satisfactory for analysis of haemolysates, whole blood samples or dried blood spots. The use of dried blood spots is suitable for samples that have to be transported long distances and where only a few drops of blood can be obtained. Whereas IEF has the advantage that it separates more variants than cellulose acetate, it also has the disadvantage that it separates haemoglobin into its post-translational derivatives. For instance, haemoglobin F separates into F 1 (acetylated F) and F 11 ; haemoglobin A can produce five bands – A 0 , A 1 , A(αmet), A(βmet) and A(αβmet) – and similarly for other haemoglobins. This makes interpretation more difficult. Identification of variants is still only provisional using IEF, and second-line methods should be used for further analysis.
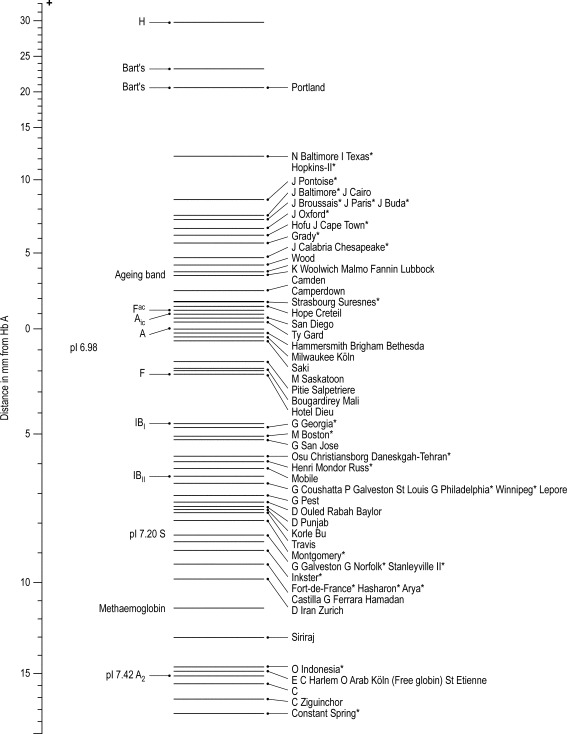
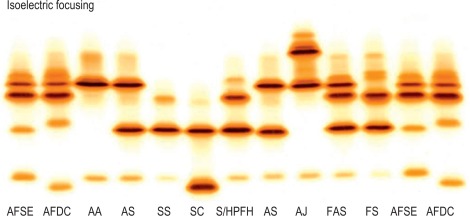
Figure 14-8 shows the relative isoelectric points of some common haemoglobin variants, and Figure 14-9 shows the separation obtained.
Tests for haemoglobin S
Tests to detect the presence of haemoglobin S depend on the decreased solubility of this haemoglobin at low oxygen tensions.
Sickling in whole blood
The sickling phenomenon may be demonstrated in a thin wet film of blood (sealed with a petroleum jelly/paraffin wax mixture or with nail varnish). If haemoglobin S is present, the red cells lose their smooth, round shape and become sickled. This process may take up to 12 h in haemoglobin S trait, whereas changes are apparent in homozygotes and compound heterozygotes after 1 h at 37 °C.
These changes can be hastened by the addition of a reducing agent such as sodium dithionite as follows:
Reagents
- •
Disodium hydrogen phosphate ( Na 2 HPO 4 ). 0.114 mol/l (16.2 g/l)
- •
Sodium dithionite ( Na 2 S 2 O 4 ). 0.114 mol/l (19.85 g/l). Prepare freshly just before use.
- •
Working solution. Mix 3 volumes of Na 2 HPO 4 with 2 volumes of Na 2 S 2 O 4 to obtain a pH of 6.8 in the resultant solution. Use immediately.
Method
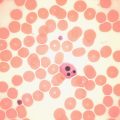
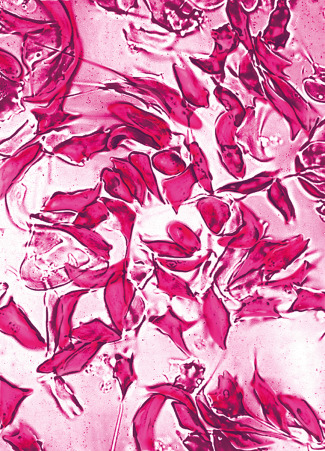
Add 5 drops of the freshly prepared reagent to 1 drop of anticoagulated blood on a slide. Seal between slide and coverslip with a petroleum jelly/paraffin wax mixture or with nail varnish. Sickling takes place almost immediately in sickle cell anaemia and should be obvious in sickle cell trait within 1 h ( Fig. 14-10 ). A test on a positive control containing haemoglobin A plus haemoglobin S must be performed at the same time.
Haemoglobin S solubility test
Principle
Sickle cell haemoglobin is insoluble in the deoxygenated state in a high molarity phosphate buffer. The crystals that form refract light and cause the solution to be turbid.
Reagents
- •
Phosphate buffer. Anhydrous dipotassium hydrogen phosphate, 215 g; anhydrous potassium dihydrogen phosphate, 169 g; sodium dithionite, 5 g; saponin, 1 g; water to 1 litre.
Note : Dissolve the K 2 HPO 4 in water before adding the KH 2 PO 4 , then add the dithionite and finally the saponin. This solution is stable for 7 days. Store refrigerated.
Method
- 1.
Pipette 2 ml of reagent into three 12 × 75 mm test tubes.
- 2.
Allow the reagent to warm to room temperature.
- 3.
Add 10 μl of packed cells (from EDTA-anticoagulated blood) to one tube, 10 μl of packed cells from a known sickle cell trait subject as a positive control to the second tube and 10 μl packed cells from a normal subject as a negative control to the final tube.
- 4.
Mix well and leave to stand for 5 min.
- 5.
Note : The blood reagent mixture should be light pink or red. A light orange colour indicates that the reagent has deteriorated.
- 6.
Hold tube 2.5 cm in front of a white card with narrow black lines and read for turbidity, in comparison with the positive and negative control samples.
- 7.
If the test appears to be positive, centrifuge at 1200 g for 5 min. A positive test will show a dark red band at the top, whereas the solution below will be pink or colourless.
Interpretation and comments
A positive solubility or sickling test indicates the presence of haemoglobin S and as such is useful in differentiating it from haemoglobins D and G, which migrate with haemoglobin S on CAE at alkaline pH, and similarly for the confirmation of the nature of a variant haemoglobin provisionally identified as S by HPLC or IEF. Positive results are also obtained on samples containing the rare haemoglobins that have both the haemoglobin S mutation and an additional mutation in the β chain. A positive solubility test merely indicates the presence of a sickling haemoglobin and does not differentiate between homozygotes, compound heterozygotes and heterozygotes. In an emergency, it may be necessary to decide if an individual suffers from sickle cell disease before the haemoglobin electrophoresis or HPLC results are available. In these circumstances, if the solubility test is positive, a provisional diagnosis of sickle cell trait can be made if the red cell morphology is normal on the blood film. If the blood film shows any sickle cells or numerous target cells, irrespective of the Hb, a provisional diagnosis of sickle cell disease should be made; many patients with sickle cell/haemoglobin C compound heterozygosity will have a normal Hb. Remember that the sickle test is likely to be negative in infants with sickle cell disease.
False-positive results have been reported in severe leucocytosis, in hyperproteinaemia (such as multiple myeloma) and in the presence of an unstable haemoglobin, especially after splenectomy. The use of packed cells, as described in this method, minimises the problem of false-positive results caused by hyperproteinaemia and hyperlipidaemia.
False-negative results can occur in patients with a low Hb and the use of packed cells will overcome this problem. False-negative results may also occur if old or outdated reagents are used and if the dithionite/buffer mixture is not freshly made. False-negative results are likely to be found not only in infants younger than age 6 months but also in other situations (e.g. post-transfusion) in which the haemoglobin S level is < 20%.
All sickle tests, whether positive or negative, must be confirmed by electrophoresis or HPLC at the earliest opportunity.
Neonatal (newborn) screening
Cord blood or a heel prick sample should be tested from all babies at risk of sickle cell disease or β thalassaemia major (i.e. where the mother has a gene for haemoglobin S, C, D Punjab , E, O Arab , Lepore or β or δβ thalassaemia trait and the father either has a genetic abnormality that could interact or is of unknown status). If a cord blood specimen is used, it is important that the sample is collected by venepuncture of the cleaned umbilical vein to avoid contamination with maternal blood, because even small quantities of maternal blood can cause a case of sickle cell disease to be misdiagnosed as sickle cell trait.
In areas where the frequency of haemoglobinopathies is high, universal neonatal (newborn) screening should be undertaken where possible. Universal neonatal screening for sickle cell disease is now carried out throughout the United Kingdom. The screening programme is linked to the existing dried blood spot screening programme in place for phenylketonuria and congenital hypothyroidism and uses the same dried blood spot specimen. It must be emphasised that the main function of this screening is to detect sickle cell disease, although many cases of β thalassaemia major are also detected, dependent on the mutations present. Dried blood spot samples are tested using HPLC and IEF – HPLC is typically the first-line test and abnormalities are confirmed by IEF. The use of mass spectrometry is becoming increasingly popular for newborn screening. Haemoglobin eluted from dried blood spots is subjected to targeted detection of relevant haemoglobin variants. This is proving an efficient approach in newborn screening laboratories where mass spectrometers are commonly used. Haemoglobin electrophoresis is not recommended for the analysis of dried blood spots. Analysis of cord blood samples is undertaken as a clinician-led request rather than for general screening. If umbilical cord blood samples are used, they can be examined by haemoglobin electrophoresis using cellulose acetate at alkaline pH or citrate agar at acid pH, or by HPLC or IEF. If any abnormality is detected, a confirmatory technique should also be undertaken.
Babies provisionally diagnosed as having SS, SC, SD Punjab , SO Arab or Sβ thalassaemia should be retested within 6–8 weeks of birth. After confirmation of the diagnosis, they should be followed in a paediatric clinic, immediately started on prophylactic penicillin to prevent pneumococcal infections and appropriately managed in the long term. β thalassaemia major is suspected when haemoglobin A is either absent or greatly reduced at birth. Such babies are retested for confirmation. The diagnosis of β thalassaemia trait cannot be reliably made until 12 months of age unless DNA techniques are used (see p. 134).
Detection of an unstable haemoglobin
Haemoglobin variants exhibit a wide range of instability but the clinically unstable haemoglobins can be detected by both the heat stability test and the isopropanol test. However, minor degrees of instability that have little or no clinical significance may need other techniques. The unstable haemoglobins are frequently silent using electrophoretic or chromatographic techniques, and tests for haemoglobin instability are essential in the detection or exclusion of an unstable haemoglobin.
Several methods are available for the demonstration of haemoglobin instability. Samples analysed should be as fresh as possible and certainly less than 1 week old. Controls should be of the same age as the test sample; a normal cord blood sample can be used as a positive control. The isopropanol test uses chemically prepared controls.
Heat stability test
Principle
When haemoglobin in solution is heated, the hydrophobic van der Waals bonds are weakened and the stability of the molecule is decreased. , Under controlled conditions, unstable haemoglobins precipitate, whereas stable haemoglobins remain in solution.
Reagent
- •
Tris-HCl buffer, pH 7.4, 0.05 M. Tris, 6.05 g; water to 1 litre. Adjust the pH to 7.4 with concentrated HCl. (It is essential that Tris-sensitive electrodes are used.)
Method
- 1.
Add 0.2 ml of lysate, freshly prepared by the purified haemolysate method (given on p. 291), to a tube containing 1.8 ml of buffer. The negative control is obtained from a fresh normal sample.
- 2.
Place the tubes in a water bath at 50 °C. Examine the tubes at 60, 90 and 120 min for precipitation.
Interpretation and comments
A significantly unstable haemoglobin will have undergone marked precipitation at 60 min and profuse flocculation at 120 min. The normal control may show some (fine) precipitation at 60 min, but this should be minimal.
Isopropanol stability test
Principle
When haemoglobin is dissolved in a solvent such as isopropanol, which is less polar than water, the hydrophobic van der Waals bonds are weakened, and the stability of the molecule is decreased. Under controlled conditions, unstable haemoglobins precipitate, whereas stable haemoglobins remain in solution. This method has the advantage that it does not require a 50 °C water bath, and positive controls can be made by modification of the reagent buffer.
Reagents
- •
Tris-HCl buffer, pH 7.4, 0.1 mol/l. Tris, 12.11 g; water to 1 litre. Adjust the pH to 7.4 with concentrated HCl. It is essential that Tris-sensitive electrodes are used.
- •
Isopropanol buffer, 17%. Make 17 volumes of isopropanol up to 100 volumes with tris-HCl buffer. The 17% isopropanol buffer solution may be stored in a tightly stoppered glass bottle for 3 months at 4 °C.
- •
Positive controls. These are buffers produced by adding small amounts of zinc to the standard 17% isopropanol buffer. For the strongest positive control (5 +), add 0.6 mmol/l zinc acetate and for the weaker positive control (1 +), add 0.1 mmol/l zinc acetate to the buffer. Samples containing haemoglobin E or haemoglobin F can also be used as weak positive controls.
Method
- 1.
Prepare oxyhaemoglobin haemolysates from test and normal control samples as given on p. 291.
- 2.
Pipette 2.0 ml of the standard isopropanol buffer into two tubes, followed by 2.0 ml of the 1 + and 5 + control solutions, respectively, into two further tubes.
- 3.
Add 0.2 ml of test sample to the first tube. Add 0.2 ml normal control sample into the three remaining tubes.
- 4.
Place the tubes in a water bath at 37 °C for 30 min. Examine the tubes at 5, 20 and 30 min for turbidity and fine flocculation.
Interpretation and comments
A normal sample will remain clear until 30 min, when a slight cloudiness may appear. Some unstable haemoglobins will show clearly observable precipitation even after 5 min incubation, whereas milder variants will not show precipitation until 20 min.
Positive results may be given by samples containing as little as 10% haemoglobin F or by samples containing increased methaemoglobin as a result of prolonged storage. If the normal sample undergoes premature precipitation, check the temperature of the water bath because it is likely to be higher than 37 °C.
False-negative results should be avoided by continuing the incubation until the normal control undergoes precipitation.
Detection of haemoglobin Ms
Methaemoglobin (Hi) has iron present in the ferric form. An inherited variant haemoglobin that undergoes oxidation to methaemoglobin more readily than haemoglobin A is referred to as haemoglobin M with an additional identifier (e.g. haemoglobin M Iwate). This is one of the causes of a very rare condition, congenital methaemoglobinaemia. The other cause of inherited methaemoglobinaemia is methaemoglobin reductase deficiency (see p. 225). Methaemoglobin levels vary, but may be as high as 40% of the total haemoglobin. Methaemoglobinaemia per se may also be caused by oxidant chemicals.
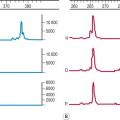
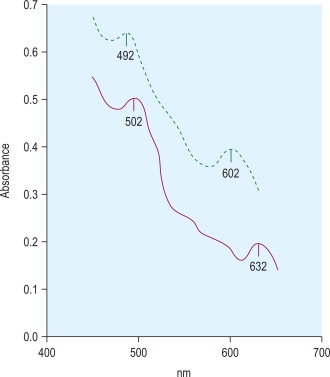
Methaemoglobin variants may be detected by haemoglobin electrophoresis at pH 7, but almost all can be distinguished from methaemoglobin A (Hi A) by their absorption spectra. Each methaemoglobin has its own distinct absorption spectrum. Hi A has two absorption peaks at 502 nm and 632 nm, whereas the peak absorbances for the variant haemoglobin Ms are at different wavelengths ( Fig. 14-11 ).
Reagent
- •
Potassium ferricyanide. 0.1 mol/l.
Method
- 1.
Lyse washed red cells from a blood sample of known haemoglobin A and of the test sample with water to give haemoglobin concentration of about 1 g/l.
- 2.
Convert the haemoglobin to Hi by the addition of 5 μl of potassium ferricyanide solution to each ml of haemolysate.
- 3.
Leave for 10 min at room temperature.
- 4.
Record the spectrum of Hi A using an automatic scanning spectrometer.
- 5.
Compare to the spectrum of Hi in the test sample.
Detection of altered affinity haemoglobins
Electrophoretic and chromatographic techniques are frequently unsuccessful in separating these abnormal haemoglobins and cannot be relied on for detection because the amino acid substitution often does not involve a change in charge.
The most informative investigation is the measurement of the oxygen dissociation curve (see p. 251). The most significant finding is a decreased Hill constant (‘n’ value) because this can only come about by a change in the structure of the haemoglobin. The p50 may be either increased (low affinity haemoglobin) or decreased (high affinity haemoglobin). High affinity haemoglobins result in an increase in Hb, whereas low affinity haemoglobins result in a decrease in Hb. The p50 alone may be affected by other factors such as the high concentration of 2,3-diphosphoglycerate (2,3-DPG) (e.g. in pyruvate kinase deficiency. Aspects of this are discussed in Chapter 11 .)
Differential diagnosis of common haemoglobin variants
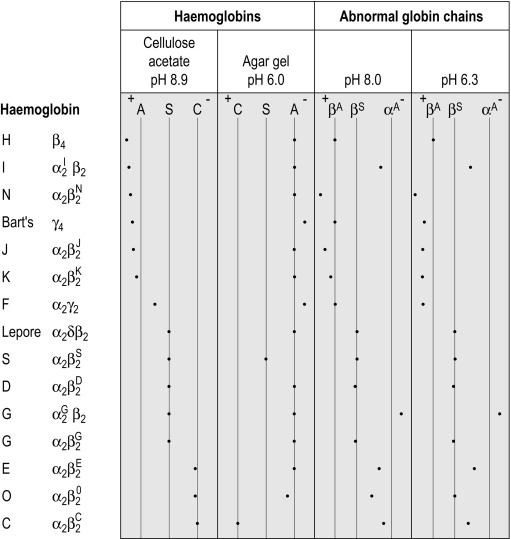
Suggested methods for differential diagnosis are given in Table 14-6 , and Figure 14-12 gives a comparison of some common variants using different techniques.
| Initial Finding on Cellulose Acetate Electrophoresis | Most Likely Variant | Differentiation |
|---|---|---|
| Band in position of haemoglobin S | Haemoglobin S, D Punjab , G Philadelphia , Lepore * | Blood count, quantification, solubility test, acid agarose gel electrophoresis, IEF, HPLC |
| Band in position of haemoglobin C | Haemoglobin C, E, O Arab | Quantification, acid agarose gel electrophoresis, IEF, HPLC |
| Very fast band | Hb I, H | H bodies |
Investigation of suspected thalassaemia
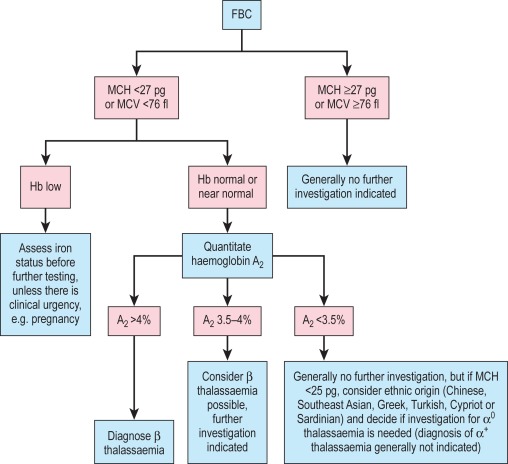
A suggested scheme of investigations is shown in Figure 14-13 ; the methods used are listed in the following section. In addition, it should be noted that:
- 1.
Estimates of haemoglobin A 2 between 3.4% and 3.7% need careful assessment and should be repeated.
- 2.
Haemoglobin A 2 values in α thalassaemia trait are usually below 2.5%. Some types of β thalassaemia trait have normal haemoglobin A 2 values.
Methods for investigation of thalassaemia
- 1.
Full blood count with red cell indices and blood film and, in selected cases, reticulocyte count
- 2.
Haemoglobin A 2 measurement by CAE with elution (see p. 303)
- 3.
Haemoglobin A 2 measurement of microcolumn chromatography (see p. 304)
- 4.
Automated HPLC (see p. 294)
- 5.
CE
- 6.
Quantification of haemoglobin F (see p. 306)
- 7.
Assessment of the distribution of haemoglobin F (see p. 308)
- 8.
Assessment of iron status (see p. 169)
- 9.
Demonstration of red cell inclusion bodies (see p. 309)
- 10.
DNA analysis (see p. 135)
Blood count and film
The blood count, including Hb and red cell indices, provides valuable information useful in the diagnosis of both α and β thalassaemia. In classic cases, there will be an elevation in the red cell count, accompanied by a decrease in MCV and MCH. The mean cell haemoglobin concentration (MCHC) and red cell distribution width (RDW) are often normal in thalassaemia trait, whereas in iron deficiency anaemia they are more likely to be abnormal. The blood film may show features such as target cells, basophilic stippling and microcytosis in the absence of hypochromia, which point to a diagnosis of thalassaemia trait. Anisochromasia, which is a feature of iron deficiency, is not usual in α and β thalassaemia trait, although it may be seen in haemoglobin H disease. Haemoglobin H disease is also characterised by marked poikilocytosis. The reticulocyte count is increased in haemoglobin H disease.
Quantification of haemoglobin A 2
An increased haemoglobin A 2 level is characteristic of heterozygous β thalassaemia and its accurate measurement is required for the diagnosis or exclusion of β thalassaemia trait. Estimations may be made by elution after CAE, by chromatography – either microcolumn or HPLC, or by CE.
Measurement of haemoglobin A 2 by elution from cellulose acetate
Principle
Haemolysate is separated into its component fractions by alkaline electrophoresis on cellulose acetate membrane. The relative proportions of the separated fractions are quantified by spectrometry of the eluates of the separated fractions. ,
Equipment
- •
Electrophoresis tank and power pack (see p. 292)
- •
Wicks of double filter paper or chromatography paper
- •
Cellulose acetate membranes (78 × 150 mm)
Reagent
- •
TEB buffer, pH 8.5. Tris(hydroxymethyl) methylamine, 40.8 g; disodium EDTA, 2.4 g; orthoboric acid, 12.8 g; water to 4 litres.
Method
- 1.
Prepare a purified haemolysate from washed red cells as described on p. 291. The haemolysate may be kept at 4 °C for up to 1 week before analysis.
- 2.
With the power supply disconnected, pour equal amounts of TEB buffer into both the anode and the cathode chambers. Cut lengths of filter or chromatography paper, soak them in the buffer chamber and place them along the bridge supports as wicks. Set the bridge gap to 7 cm.
- 3.
Soak the cellulose acetate by carefully floating the cellulose acetate sheet onto the surface of the buffer, making sure that no air bubbles are trapped underneath it. When the sheet has absorbed the buffer, submerge the sheet. Leave for at least 5 min, remove and blot carefully between two sheets of blotting paper.
- 4.
Position the cellulose acetate across the bridge supports so that the long end of the sheet is on the anodal side. Using a ruler as a guideline, apply 30 μl of lysate to each sheet 1 cm from the cathode in a single line. Leave 1 cm margin at each end of the application line.
- 5.
Run at a constant voltage of 250 V until separation is complete. This will take approximately 60 min and there should be at least a 1 cm gap between the A and A 2 bands at the end of the run. Check the separation at 40 min, ensuring that the haemoglobin A (or fast moving variants such as haemoglobin H, J or N) do not travel onto the wicks. Check again at 5–10 min thereafter. Samples with a variant band between the A and A 2 bands will take up to 30 min longer to obtain satisfactory separation.
- 6.
Remove the sheet, holding it carefully at the anodal wick contact; do not place on a work surface. Cut off and discard the cellulose acetate that has been in contact with the cathodal wick. Cut a ‘blank’ strip of approximately 2 cm wide from the cathodal end of one sheet (do not use cellulose acetate that includes the application line). Cut out the haemoglobin A 2 section, cutting the band into pieces approximately 1 cm square directly into a clean universal container. Cut out any variant band in the same way, and finally cut out the haemoglobin A band.
- 7.
Add 4 ml of distilled water to both the blank and haemoglobin A 2 containers and add 16 ml water to the haemoglobin A container. Variant bands are usually eluted in 8 ml of water, although this may vary.
- 8.
Mix the eluates for 20 min and mix again by inversion just before measuring the absorbance.
- 9.
Read the absorbance of the blank against water at 415 nm. This reading should be < 0.005. Read the absorbances of the haemoglobin solutions at 415 nm against the cellulose acetate blank.
Calculation
% haemoglobin A 2 = A b s o r b a nce of haemoglobin A 2 × 100 Absorbance of haemoglobin A 2 + ( Absorbance of haemoglobin A × 4 )
Stay updated, free articles. Join our Telegram channel

Full access? Get Clinical Tree


