Chapter 12 Investigation of the hereditary haemolytic anaemias
membrane and enzyme abnormalities
The various initial steps to be taken in the investigation of a patient suspected of having a haemolytic anaemia are outlined in Chapter 11 and the changes in red cell morphology that may be found in haemolytic anaemias are illustrated in Chapter 5. This chapter describes procedures useful in investigating haemolytic anaemias suspected to result from defects within the red cell membrane or deficiency of enzymes important in red cell metabolism.
Investigation of membrane defects
Procedures to assess red cell flexibility (rigidity) using polycarbonate membrane filtration,1 and red cell deformability measurements on specialized equipment such as the Laser-assisted Optical Rotational Cell Analyser (LORCA)2 have been described elsewhere.
Osmotic fragility as measured by lysis in hypotonic saline
Principle
The method to be described is based on that of Parpart et al.3 Small volumes of blood are mixed with a large excess of buffered saline solutions of varying concentration. The fraction of red cells lysed at each saline concentration is determined colorimetrically. The test is normally carried out at room temperature (15–25°C).
Method
Notes
Osmotic Fragility after Incubating the Blood at 37°C for 24 Hours
Method
Defibrinated blood should be used, care being taken to ensure that sterility is maintained.
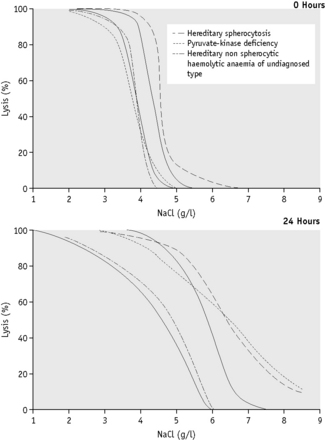
Because the fragility may be markedly increased (Fig. 12.2), set up additional hypotonic solutions containing 7.0 g/l and 8.0 g/l NaCl. In addition, use a solution equivalent to 12.0 g/l NaCl because sometimes, as in HS, lysis may take place in 9.0 g/l NaCl. In this case, use the supernatant of the tube containing 12.0 g/l NaCl as the blank in the colorimetric estimation.
The incubation fragility test is conveniently combined with the estimation of the amount of spontaneous autohaemolysis (p. 252).
Factors Affecting Osmotic Fragility Tests
The extent of the effect of pH and temperature on osmotic fragility was well illustrated in the paper of Parpart et al.3 The effect of pH is more important: a shift of 0.1 of a pH unit is equivalent to altering the saline concentration by 0.1 g/l, the fragility of the red cells being increased by a decrease in pH. An increase in temperature decreases the fragility, an increase of 5°C being equivalent to an increase in saline concentration of about 0.1 g/l.
Further details of the factors that affect and control haemolysis of red cells in hypotonic solutions were given by Murphy.4
Recording the Results of Osmotic Fragility Tests
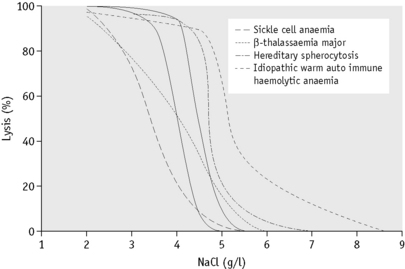
In the past, osmotic fragility most often has been expressed in terms of the highest concentration of saline at which lysis is just detectable (initial lysis or minimum resistance) and the highest concentration of saline in which lysis appears to be complete (complete lysis or maximum resistance). It is, however, useful also to record the concentration of saline causing 50% lysis (i.e. the median corpuscular fragility, MCF) and to inspect the entire fragility curve (Fig. 12.1). The findings in health are summarized in Table 12.1.
Table 12.1 Osmotic fragility in health (at 20°C and pH 7.4)
| Fresh blood (g/l NaCl) | Blood incubated 24 h, 37°C (g/l NaCl) | |
|---|---|---|
| Initial lysis | 5.0 | 7.0 |
| Complete lysis | 3.0 | 2.0 |
| MCF (50% lysis) | 4.0–4.45 | 4.65–5.9 |
MCF, median corpuscular fragility.
Alternative methods of recording osmotic fragility
In disease, tailed curves also skew the line to varying degrees at the other end of the probability plot. To obtain increment-haemolysis curves, the differences in lysis between adjacent tubes are plotted against the corresponding saline concentrations. Definitely bimodal curves may be obtained during recovery from a haemolytic episode.5
Interpretation of Results
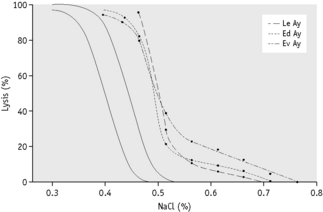
The osmotic fragility of freshly taken red cells reflects their ability to take up a certain amount of water before lysing. This is determined by their volume-to-surface area ratio. The ability of the normal red cell to withstand hypotonicity results from its biconcave shape, which allows the cell to increase its volume by about 70% before the surface membrane is stretched; once this limit is reached lysis occurs.6 Spherocytes have an increased volume-to-surface area ratio; their ability to take in water before stretching the surface membrane is thus more limited than normal and they are therefore particularly susceptible to osmotic lysis. The increase in osmotic fragility is a property of the spheroidal shape of the cell and is independent of the cause of the spherocytosis. Characteristically, osmotic fragility curves from patients with HS who have not been splenectomized show a ‘tail’ of very fragile cells (Fig. 12.3). When plotted on probability paper, the graph indicates two populations of cells: the very fragile and the normal or slightly fragile. After splenectomy the red cells are more homogeneous, the osmotic fragility curve indicating a more continuous spectrum of cells, from fragile to normal.
Decreased osmotic fragility indicates the presence of unusually flattened red cells (leptocytes) in which the volume-to-surface area ratio is decreased. Such a change occurs in iron deficiency anaemia and thalassaemia in which the red cells with a low mean cell haemoglobin (MCH) and mean cell volume (MCV) are unusually resistant to osmotic lysis (Fig. 12.1). A simple one-tube osmotic fragility is a useful screening test for β thalassaemia and some haemoglobinopathies in countries with a high incidence of these abnormalities (p. 612). Reticulocytes and red cells from patients who have been splenectomized also tend to have a greater amount of membrane compared with normal cells and are osmotically resistant. In liver disease, target cells may be produced by passive accumulation of lipid and these cells, too, are resistant to osmotic lysis.7
The osmotic fragility of red cells after incubation for 24 h at 37°C is also a reflection of their volume-to-surface area ratio, but the factors that alter this ratio are more complicated than in fresh red cells. The increased osmotic fragility of normal red cells, which occurs after incubation (Fig. 12.2), is mainly caused by swelling of the cells associated with an accumulation of sodium that exceeds loss of potassium. Such cation exchange is determined by the membrane properties of the red cell, which control the passive flux of ions, and the metabolic competence of the cell, which determines the active pumping of cations against concentration gradients. During incubation for 24 h, the metabolism of the red cell becomes stressed and the pumping mechanisms tend to fail, one factor being a relative lack of glucose in the medium.
The osmotic fragility of red cells that have an abnormal membrane, such as those of HS and hereditary elliptocytosis (HE), increases abnormally after incubation (Fig. 12.2). Similar results occur in hereditary stomatocytosis.8 The results with red cells with a glycolytic deficiency, such as those of pyruvate kinase (PK) deficiency, are variable. In severe deficiencies, osmotic fragility may increase substantially (Fig. 12.2), but, in other cases, the fragility may decrease owing to a greater loss of potassium than gain of sodium. In thalassaemia major and minor, osmotic fragility is frequently markedly reduced after incubation, again owing to a marked loss of potassium.9 A similar, although usually less marked, change is seen in iron deficiency anaemia.
To summarize, measurement of red cell osmotic fragility provides a useful indication as to whether a patient’s red cells are normal because an abnormal result invariably indicates abnormality. The reverse is, however, not true (i.e. a result that is within the normal range does not mean that the red cells are normal). The findings in some important haemolytic anaemias are summarized in Table 12.2.
Table 12.2 Osmotic fragility in haemolytic anaemias: a summary
| Condition | Notes |
|---|---|
| A. Associated with increased osmotic fragility (OF) | |
| Hereditary spherocytosis (HS) | Entire curve may be ‘shifted to the right’, or most of it may be within the normal range but with a ‘tail’ of fragile cells. Curve within normal range in 10–20% of cases. After incubation for 24 h, abnormalities usually more marked, but still some false-negative results. Splenectomy does not affect MCF but reduces the tail of fragile cells |
| Hereditary elliptocytosis (HE) | As in HS, but in general changes less marked. Abnormal OF usually correlates with severity of haemolysis (i.e. OF is normal in non-haemolytic HE) |
| Hereditary stomatocytosis | As in HS with large osmotically fragile cells with low MCHC |
| Other inherited membrane abnormalities | Results variable; with milder disorders curve more likely to be abnormal after incubation for 24 h |
| Autoimmune haemolytic anaemia | Tail of fragile cells roughly proportional to number of spherocytes; rest of curve normal (or even left-shifted on account of reticulocytosis) |
| B. Associated with decreased OF | |
| Thalassaemia | MCF decreased in all forms of thalassaemia, except in some α thalassaemia heterozygotes; usually the entire curve is left-shifted |
| Enzyme abnormalities | OF usually normal (anaemia originally referred to as hereditary nonspherocytic), but tail of highly resistant cells may be seen on account of high reticulocyte court. After incubation for 24 h, there may be a tail of fragile cells |
| Hereditary xerocytosis | Increased resistance to osmotic lysis and increased MCHC |
| Iron deficiency | Curve shifted to left, wholly or partly, depending on proportion of hypochromic red cells |
OF, osmotic fragility; HE, hereditary elliptocytosis; HS, hereditary spherocytosis; MCF, median corpuscular fragility; MCHC, mean cell haemoglobin concentration.
Flow cytometric (dye-binding) test
Principle
The osmotic fragility test lacks specificity and sensitivity and fails to detect atypical or mild HS. Moreover, it can be affected by factors unrelated to red cell cytoskeletal defects; for example, positive results may be obtained for red cells from patients who are pregnant or who have immune or other haemolytic anaemias or renal failure. The flow cytometric (dye-binding) test of King and colleagues10 measures the fluorescent intensity of intact red cells labelled with eosin-5-maleimide (EMA), which reacts covalently with Lys-430 on the first extracellular loop of Band 3 protein. The N-terminal cytoplasmic domain of Band 3 interacts with ankyrin and protein 4.2, which in turn crosslink with the spectrin-based cytoskeleton and stabilizes the membrane lipid bilayer.11 Deficiency or abnormality of Band 3 may result in decreased fluorescence. This is seen in HS red cells but has also been observed in cases of South-east Asian ovalocytosis, congenital dyserythropoietic anaemia Type II and the stomatocytic variant, cryohydrocytosis. Blood samples in ethylenediaminetetra-acetic acid (EDTA) may be analysed for up to 48 h after collection provided they have been stored in the refrigerator.
Glycerol lysis-time tests
The osmotic fragility test is somewhat cumbersome and requires 2 ml or more of whole blood. It is thus not suitable for use in newborn babies or as a population screening test. In 1974, Gottfried and Robertson12 introduced a glycerol lysis-time (GLT) test, a one-tube test, to measure the time taken for 50% haemolysis of a blood sample in a buffered hypotonic saline–glycerol mixture. The original method had greater sensitivity in the osmotic-resistant range, but it also could identify most patients with HS by a shorter GLT50. Better identification of HS blood from normal was obtained by 24-h incubation of samples and by modifying the glycerol reagent.13 Zanella et al modified the original test further by decreasing the pH.14 There is some loss of specificity for HS with the acidified glycerol lysis-time test (AGLT) compared with the original method, but in practice this loss is unimportant.
Acidified Glycerol Lysis-Time Test
Results
Normal blood takes more than 30 min (1800 s) to reach the AGLT50. The time taken is similar for blood from normal adults, newborn infants and cord samples. In patients with HS, the range of the AGLT50 is 25–150 s. A short AGLT50 may also be found in chronic renal failure, chronic leukaemias and autoimmune haemolytic anaemia; it also may be found in some pregnant women.14
Cryohaemolysis Test
Principle
Whereas osmotic fragility may be abnormal in any condition where spherocytes occur, it has been suggested that cryohaemolysis is specific for HS.15 This appears to result from the fact that the latter is dependent on factors that are related to molecular defects of the red cell membrane rather than to changes in the surface area-to-volume ratio. The test can be carried out on EDTA blood up to 1 day old.
Method15
Interpretation
Streichman et al.15 report the range of cryohaemolysis in normal subjects to be 3–15%, whereas in hereditary spherocytosis there is >20% lysis. However, it is recommended that individual laboratories establish their own reference values for the method. We have found that most normal samples give <3% lysis. Increased lysis is not exclusive to hereditary spherocytosis and may be observed in hereditary stomatocytosis.
Autohaemolysis: spontaneous haemolysis developing in blood incubated at 37°c for 48 hours
The autohaemolysis test is useful as an initial screen in suspected cases of haemolytic anaemia. It provides information about the metabolic competence of the red cells and helps to distinguish membrane and enzyme defects if the results of the tests are taken together with other observations such as morphology, inheritance and the presence or absence of associated clinical disorders.16
Defibrinating Blood
Defibrinate blood, as described on p. 5.
Estimate the spontaneous lysis by means of a colorimeter or a spectrometer at 540 nm.
As a rule, it is convenient to make a 1 in 10 dilution of the incubated serum in cyanide-ferricyanide (Drabkin’s) solution (p. 25), unless there is marked haemolysis, when a 1 in 25 or 1 in 50 dilution is more suitable. A corresponding dilution of the preincubation serum is used as a blank and a 1 in 100 or 1 in 200 dilution of the whole blood in Drabkin’s solution indicates the total amount of Hb present and serves as a standard.
where R0 = reading of diluted whole blood; Rt = reading of diluted serum at 48 h; B = reading of blank; PCVt = packed cell volume at time t; D0 = dilution of whole blood (e.g. 1 in 200 = 0.005); and Dt = dilution of serum (e.g. 1 in 10 = 0.1).
Normal Range of Autohaemolysis
Lysis at 48 h: without added glucose, 0.2–2.0%; with added glucose, 0–0.9%.
The results obtained are sensitive to slight differences in technique and each laboratory should use a carefully standardized procedure and establish its own normal range. If the amount of liberated Hb is small, it is more accurate (although more time consuming) to measure lysis by a chemical method rather than by a direct spectrometric method (p. 231). It can also be measured directly by a simple and rapid procedure with a HemoCue Plasma/Low Hb system.17
Significance of Increased Autohaemolysis
Little or no lysis takes place when normal blood is incubated for 24 h under sterile conditions and the amount present after 48 h is small.16 If glucose is added so that it is present throughout the incubation, the development of lysis is markedly slowed. The amount of autohaemolysis that occurs after 48 h with and without glucose is determined by the properties of the membrane and the metabolic competence of the red cell. In membrane disorders such as HS, the rate of glucose consumption is increased to compensate for an increased cation leak through the membrane.8 During the 48-h incubation, glucose is therefore used up relatively rapidly so that energy production fails more quickly than normal unless glucose is added. This is one factor that contributes to the increased rate of autohaemolysis in HS. Usually, but not always, the addition of glucose to the blood decreases the rate of autohaemolysis in HS. This was referred to as Type 1 autohaemolysis.16 When the utilization of glucose via the glycolytic pathway is impaired, as in PK deficiency, the rate of autohaemolysis at 48 h is usually increased but glucose fails to correct or may even aggravate lysis (Type 2 autohaemolysis).8 Although a similar result may be seen in severe HS (Type B), in the absence of spherocytosis failure of glucose to diminish autohaemolysis is a strong indication of a glycolytic block. Blood from patients with G6PD deficiency or other disorders of the pentose phosphate pathway may undergo a slight increase in autohaemolysis (without additional glucose), which is corrected by the addition of glucose. Commonly, the result is normal, but examination of the incubated blood may show an increase in methaemoglobin (Hi) (discussed later). Not all glycolytic enzyme deficiencies give a Type 2 reaction so that a Type 1 result does not exclude the possibility of such a defect.
The nucleosides adenosine, guanosine and inosine, like glucose, diminish the rate of autohaemolysis when added to blood. Remarkably, adenosine triphosphate (ATP) strikingly retards haemolysis in PK deficiency, although glucose itself is ineffective.18 ATP does not pass the red cell membrane.
The autohaemolysis test lacks specificity. This has drawn much criticism on the test, including the suggestion that it has no place in the screening of blood for inherited defects.19 The best way to detect metabolic defects in red cells is undoubtedly to measure glucose consumption, lactate production and the contribution to metabolism of the pentose phosphate pathway. These measurements are, unfortunately, difficult and are likely to be undertaken only by specialized laboratories. The autohaemolysis test does provide some information about the metabolic competence of the red cells and helps to distinguish membrane defects from enzyme defects.
