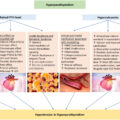
Visit the Endocrine Hypertension: From Basic Science to Clinical Practice , First Edition companion web site at: https://www.elsevier.com/books-and-journals/book-companion/9780323961202 .


Introduction
Among adults with hypertension, nearly 85% have idiopathic (essential) hypertension, the rest have secondary hypertension. Hypertension secondary to endocrine disease accounts for about 5%–10% among the adult population with high blood pressure [ ]. The common causes for endocrine hypertension include excessive production of mineralocorticoids (primary hyperaldosteronism), glucocorticoids (Cushing’s syndrome [CS]), and catecholamines (pheochromocytoma [PCC]) [ , ]. Less frequent causes of endocrine hypertension include primary hyperparathyroidism (PHPT), hypothyroidism, hyperthyroidism, acromegaly, and Adult Growth Hormone Deficiency (AGHD).
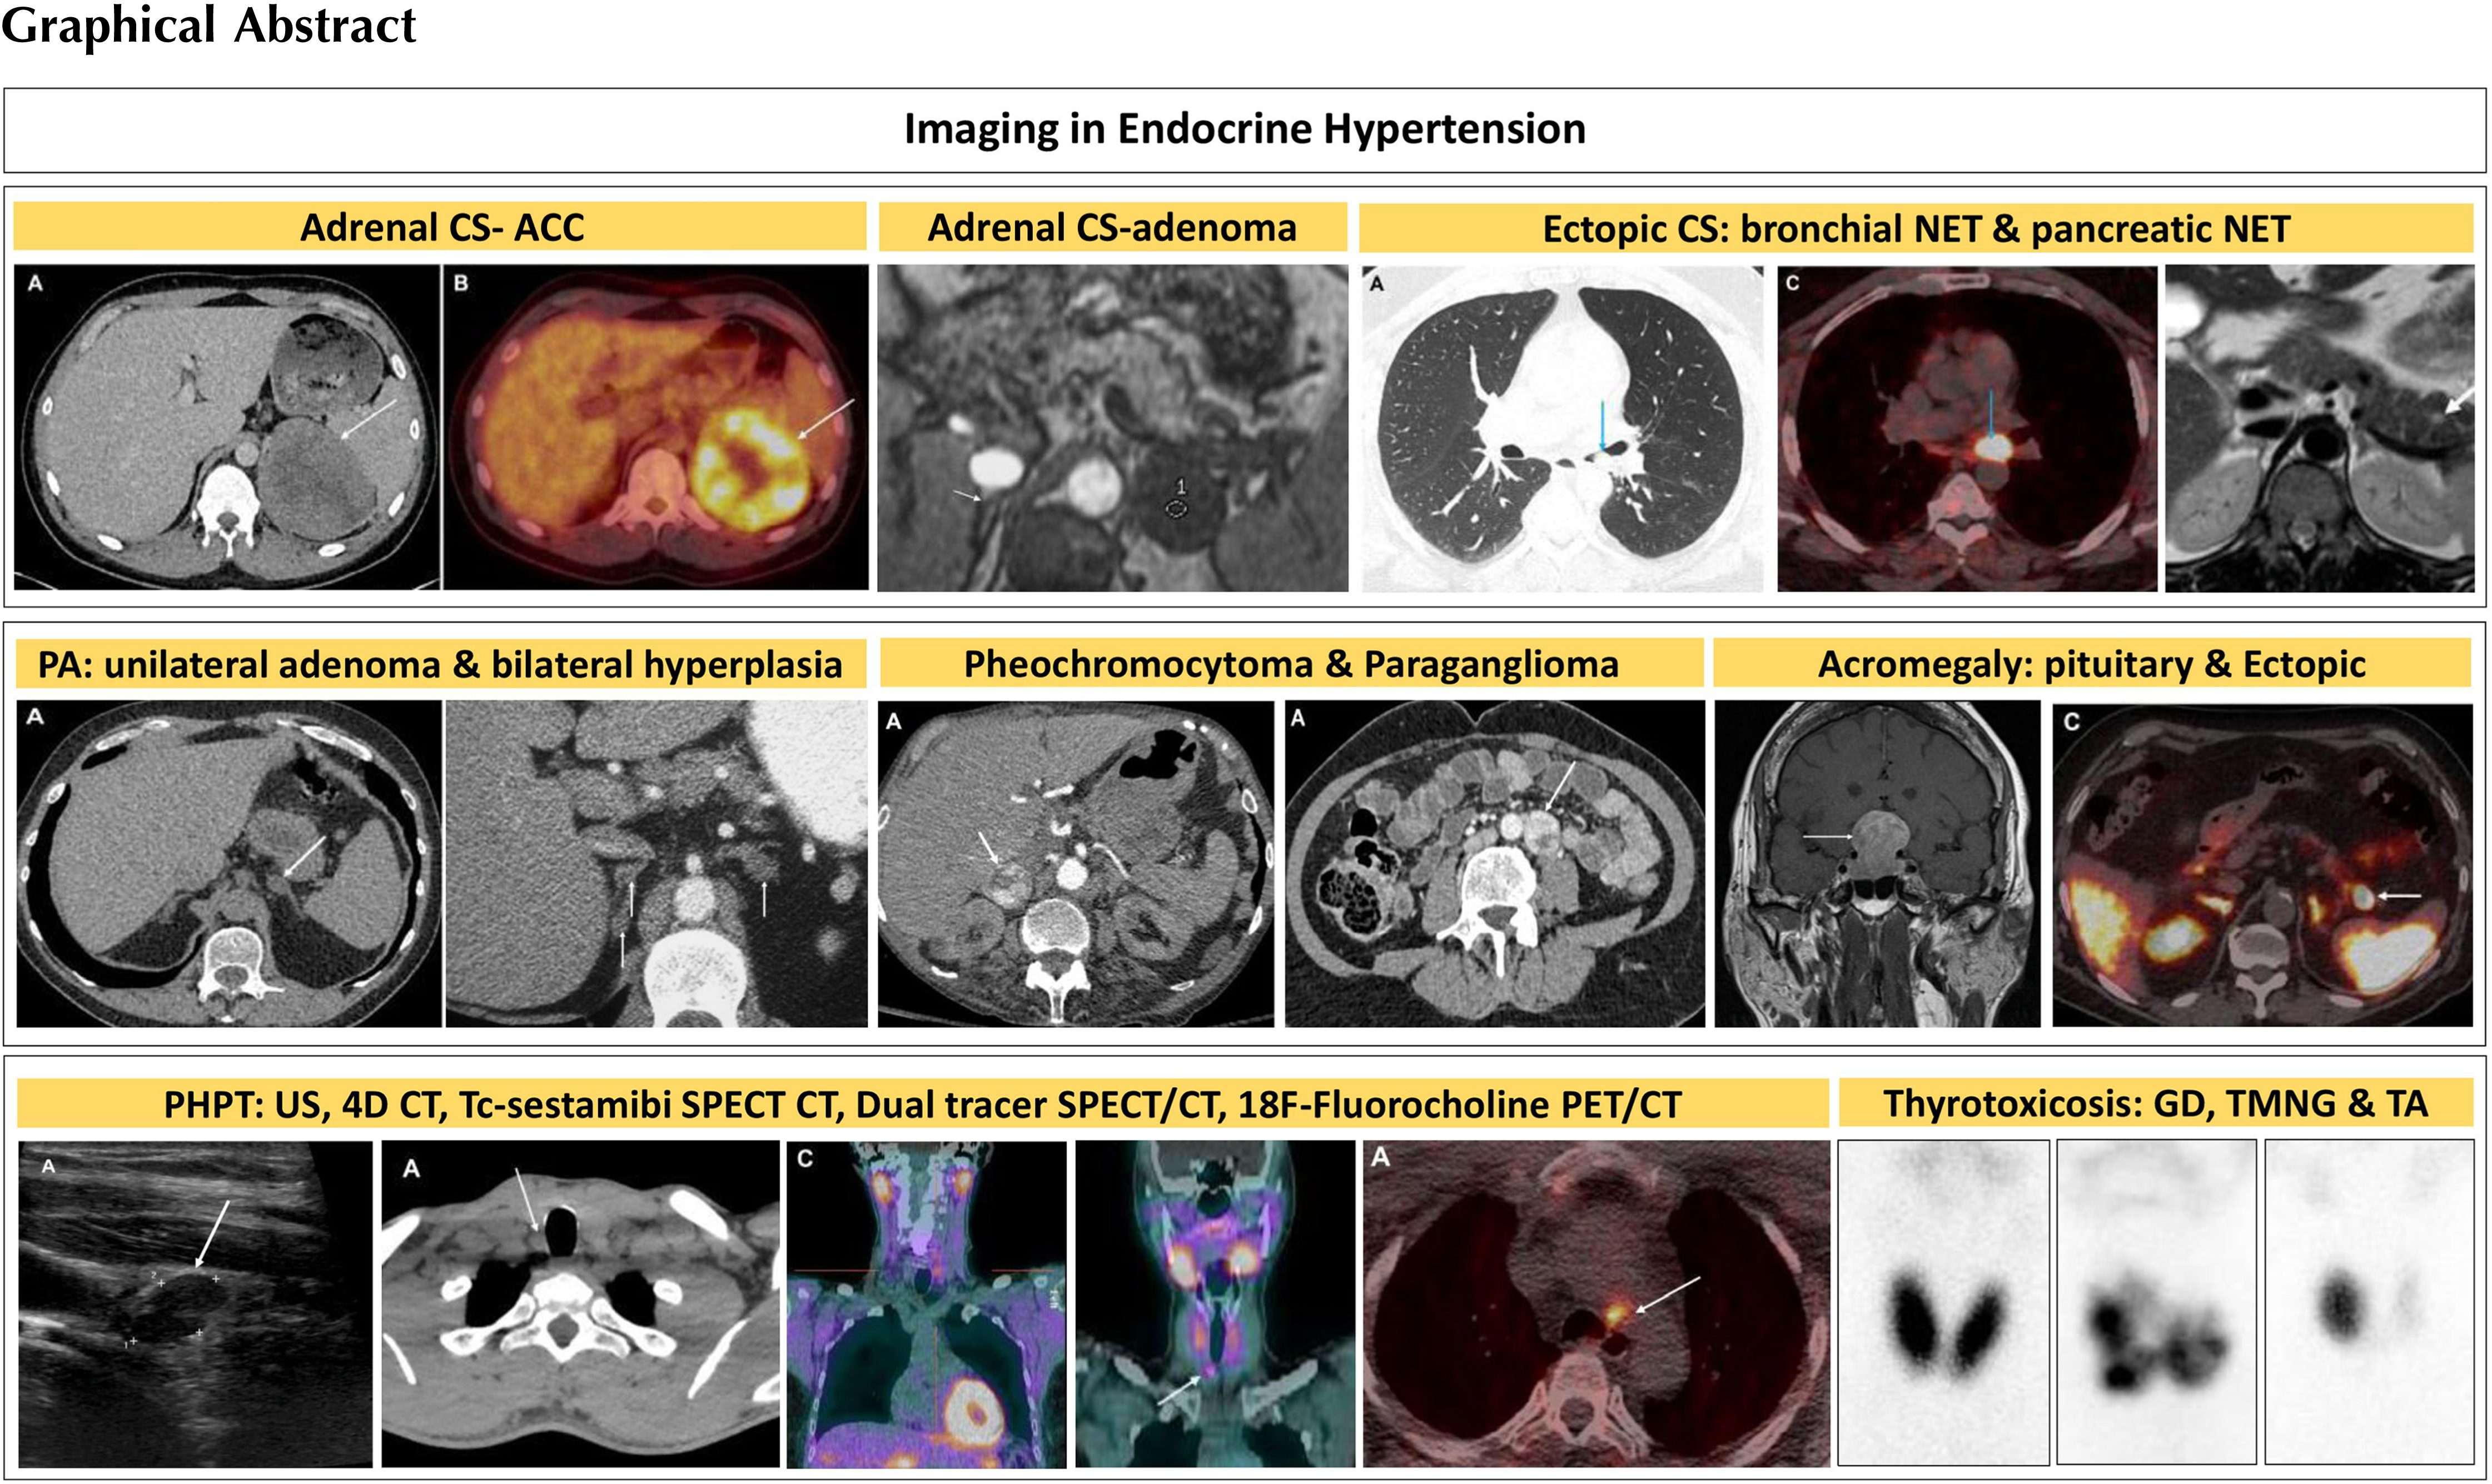
Imaging studies are an important supplement to the diagnosis of diseases associated with endocrine hypertension. The role of anatomical and functional imaging studies includes localization of the lesions, surgical planning, assessment of treatment response, and surveillance following treatment. In patients with endocrine hypertension, the cause when detected is usually clear and can be treated surgically in most cases. Surgical intervention may result in complete cure, obviating lifelong antihypertensive treatment or significantly decrease the number or dosage of medical treatments required to control the hypertension. Computed tomography (CT), magnetic resonance imaging (MRI), ultrasonography (US), and several nuclear medicine imaging techniques are used to evaluate the adrenal, thyroid, and pituitary gland. This chapter discusses the relevant imaging modalities, their advantages, and disadvantages in the diagnostic work up of patients with endocrine hypertension.
Adrenal computed tomography (CT)
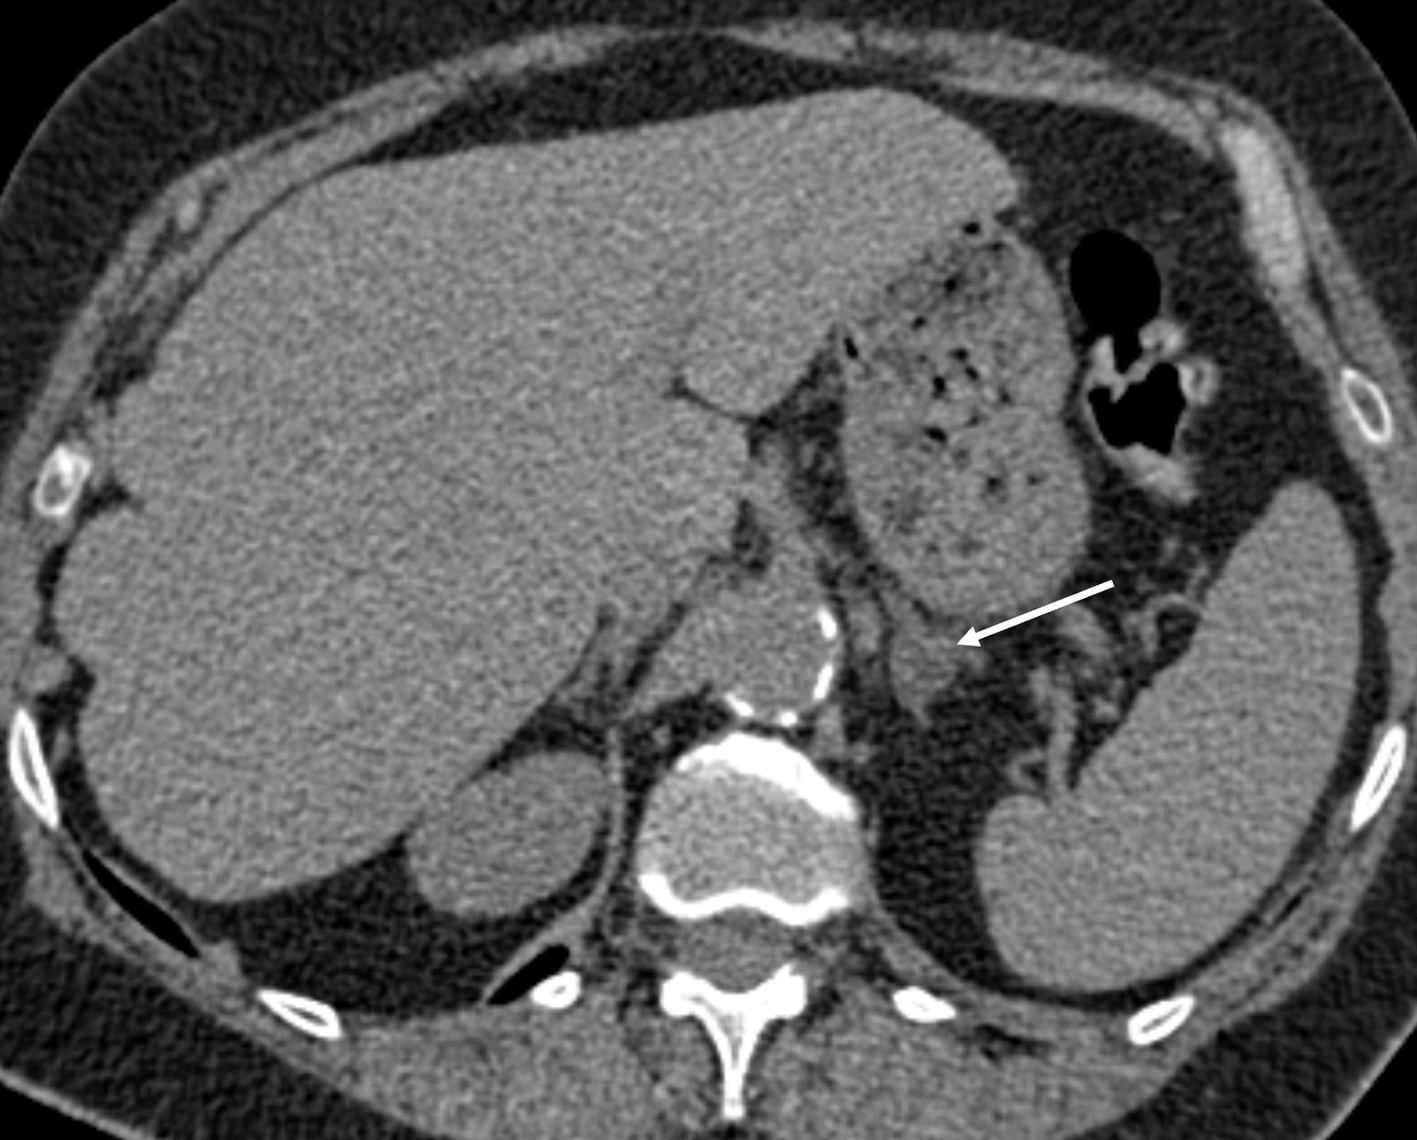
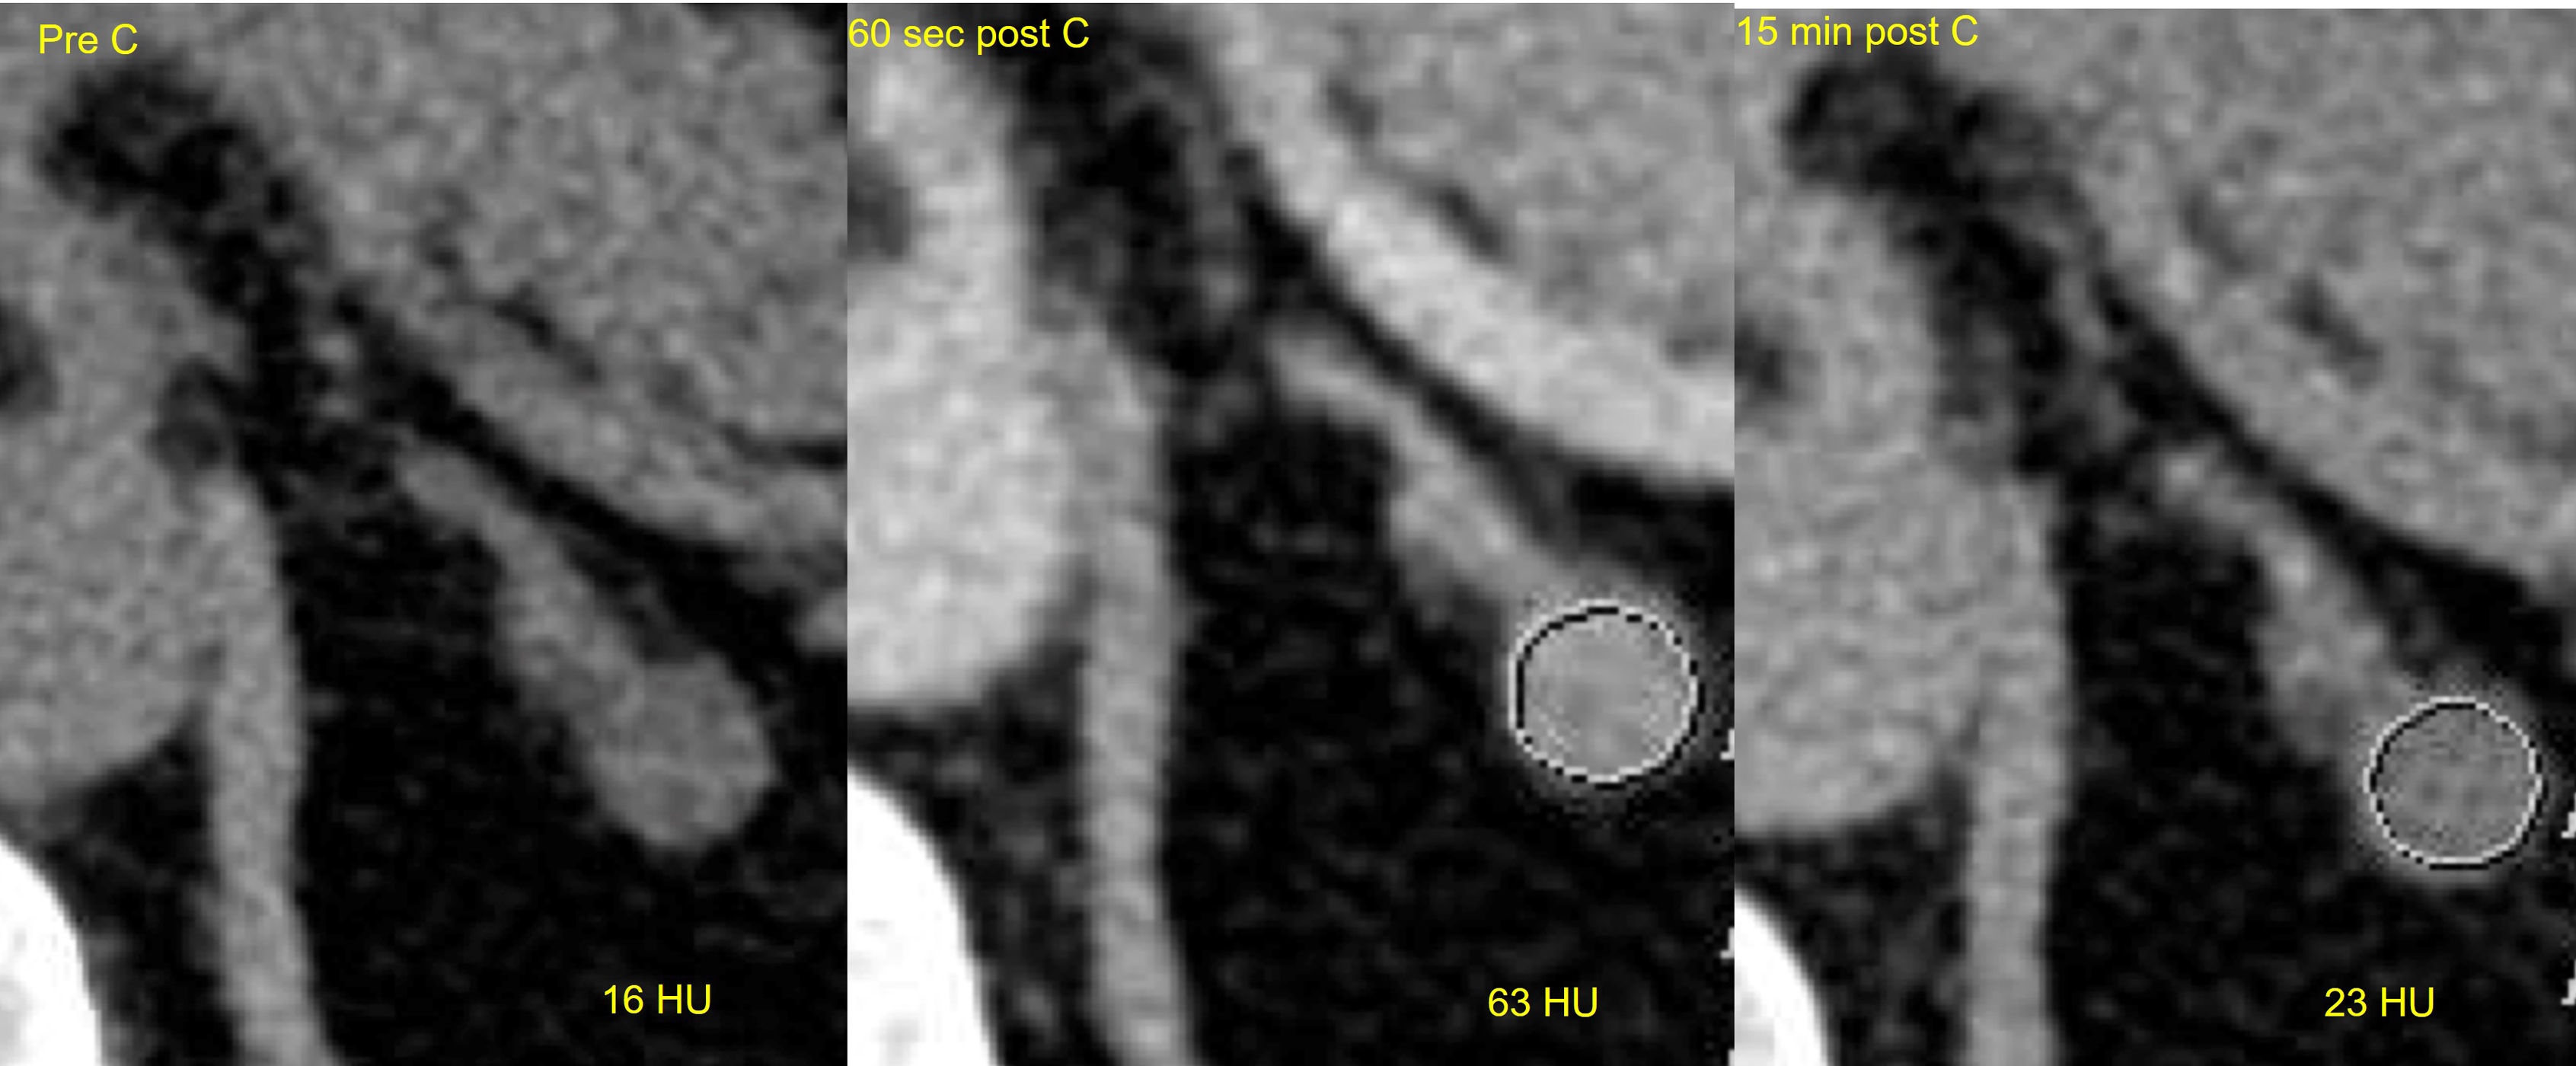
Advantages of CT imaging include its high throughput, comparative low cost, and good spatial resolution crucial for the detection of small lesions. On CT imaging, the normal adrenal gland appears as an inverted “Y”- or “V”-shaped organ surrounded by retroperitoneal fat and lies superior to the upper pole of the kidneys. CT imaging with a 3-phase protocol is used to characterize adrenal lesions based on their density and contrast enhancement properties. However, it cannot differentiate functioning from nonfunctioning adenomas. A standard adrenal CT protocol includes an unenhanced noncontrast phase, portal venous (PV) contrast enhanced phase 60 seconds after intravenous contrast injection, and a delayed phase 15 minutes after intravenous contrast injection. Adrenal adenomas are identified as well-defined homogenous nodules. On non-contrast CT if the density is less than 10 Hounsfield units (HU), an adrenal nodule can be confidently diagnosed as a lipid-rich adenoma with 71% sensitivity and 98% specificity ( Fig. 20.1 ) [ ]. This low density is due to the presence of intracellular fat, and no further imaging for the diagnosis of an adenoma is needed. 70% of adenomas are lipid rich [ ]. If the non-contrast CT density is above 10HU, the lesion is equivocal, and the patient can proceed to contrast enhanced imaging to measure contrast washout properties of the lesion. Approximately one-third of adenomas are lipid-poor and do not contain enough intracellular fat to have a density below 10HU on unenhanced CT. However, they will show rapid washout of contrast on delayed phase imaging, compared to other adrenal lesions such as PCCs, malignant lesions and metastases, where washout is typically slower. The equations below are used to calculate absolute and relative washout. Absolute washout greater than 60% and relative washout greater than 40% is in keeping with an adenoma ( Fig. 20.2 ) [ ]. Lesions that do not meet the washout criteria remain indeterminate on CT and may proceed to further imaging or surveillance.
Adrenal magnetic resonance imaging (MRI)
Lipid-poor and lipid-rich adenomas can also be diagnosed on MRI which is a useful alternative in patients who cannot have contrast enhanced CT, for example those with contrast allergy, or in patients with equivocal CT findings. The most useful MRI sequence is chemical shift imaging (CSI) that takes advantage of the different resonant frequencies of fat and water within the lesion. This is a dual-echo gradient echo sequence where both echoes are performed in a single breath-hold. It relies on the admixture of water and intracellular fat within the adenoma causing a signal dropout on the out of phase imaging compared with in phase images. This signal dropout can be visually observed or measured using a region of interest. The sensitivity and specificity of CSI in diagnosing adenomas are higher than CT at 81%–100% and 94%–100%, respectively ( Fig. 20.3 ) [ ]. To distinguish between intracellular fat seen in adenomas and the macroscopic fat seen in lipomas and myelolipomas, a fat-suppressed sequence is included in the imaging protocol as well as standard anatomical sequences. Contrast enhancement can be assessed using gadolinium-based contrast agents which assist in distinguishing from nonenhancing adrenal cysts.
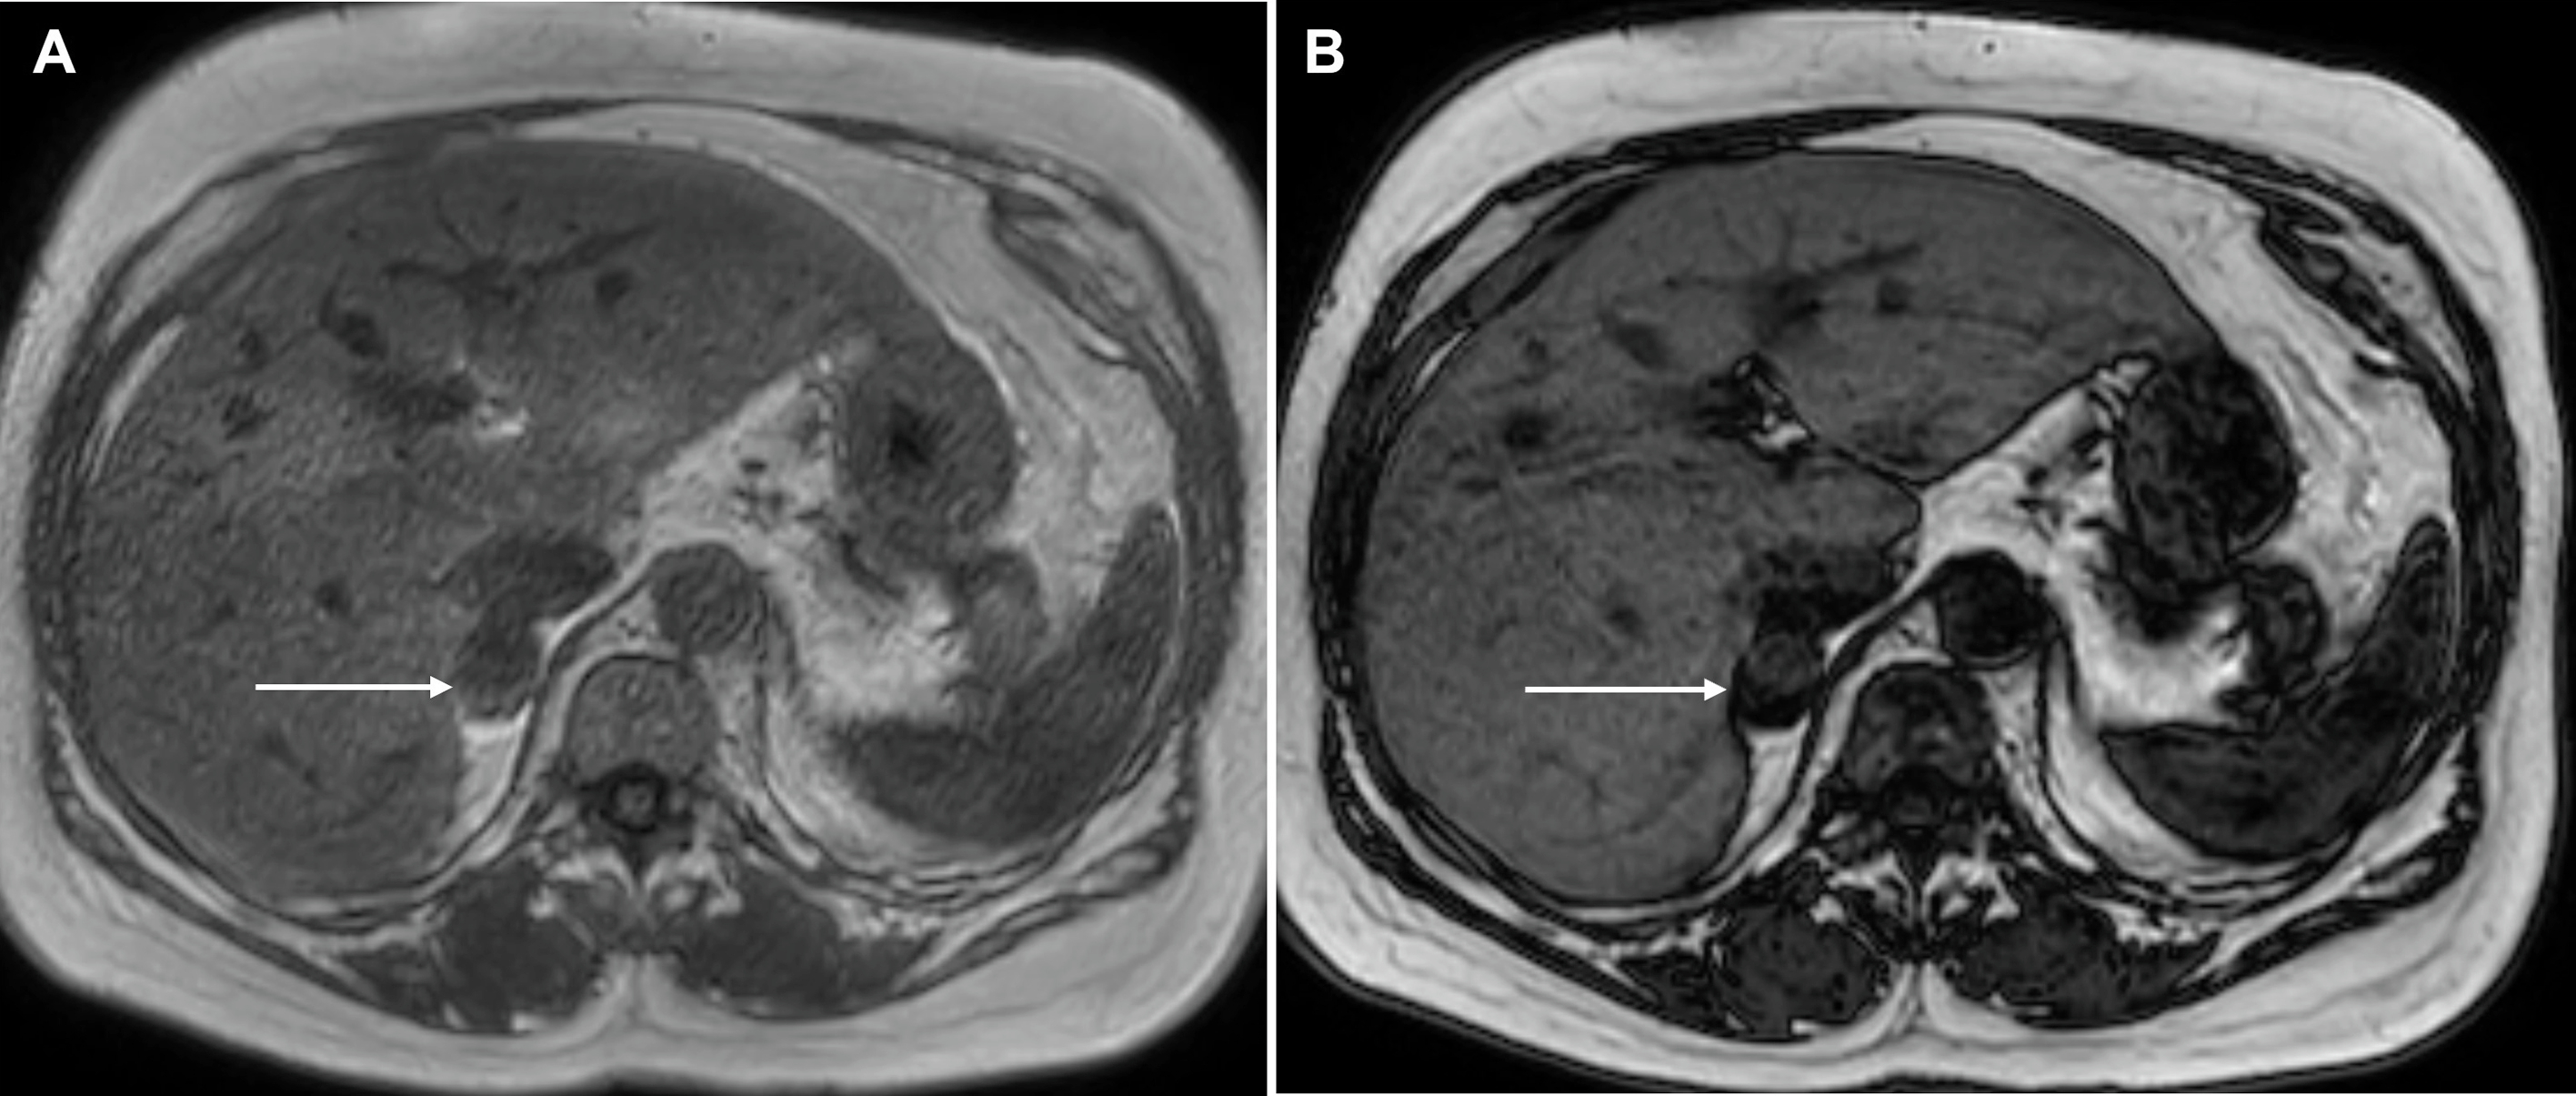
Both CT and MRI techniques and protocols are designed to confirm benignity in an adrenal lesion. Therefore, they are best placed and have a high specificity (>98%) to confirm cysts, myelolipomas, and adenomas [ , ]. Conversely, techniques such as FDG PET/CT have a higher sensitivity for malignant disease although the specificity is poor due to metabolically active benign lesions [ ].
Adrenal venous sampling (AVS)
In cases of mineralocorticoid excess states where there are bilateral adrenal nodules, this could be due to bilateral adrenal hyperplasia (BAH), or unilateral aldosterone secreting adrenocortical adenoma (ACA) with a contralateral incidental non-functioning adenoma. To differentiate unilateral from bilateral aldosterone production, AVS is the gold standard diagnostic technique. It is an invasive angiographic procedure involving cannulation of the adrenal veins and venous blood sampling for measurement of aldosterone and cortisol in the adrenal veins and IVC. Cannulation of the right adrenal vein is technically challenging with a high failure rate (because of its small size and anatomical variations) [ ]. However, in specialist centers, the success rate of the procedure is up to 96% [ , ], with diagnostic laterlization in 45.5% [ ]. This procedure is offered only in a limited number of tertiary referral centers, is expensive, and may lead to complications such as bleeding, infection, and catheter-induced adrenal vein thrombosis, with success rates as low as 8%–10% in low-volume centers [ ].
Imaging for mineralocorticoid excess states
Mineralocorticoids are secreted by the zona glomerulosa of the adrenal cortex and regulate body fluid volume and electrolyte balance. The principal mineralocorticoid, aldosterone, plays a crucial role in potassium and blood pressure hemostasis, and excess production of this hormone can lead to hypokalemia, sodium and water retention, and hypertension. Primary aldosteronism is a common cause of secondary hypertension accounting for around 10% cases attending the hypertension clinics, and in a significant number of these patients there is an aldosterone secreting ACA, which can be resected to achieve surgical cure. The remaining is caused by BAH, which is often treated medically.
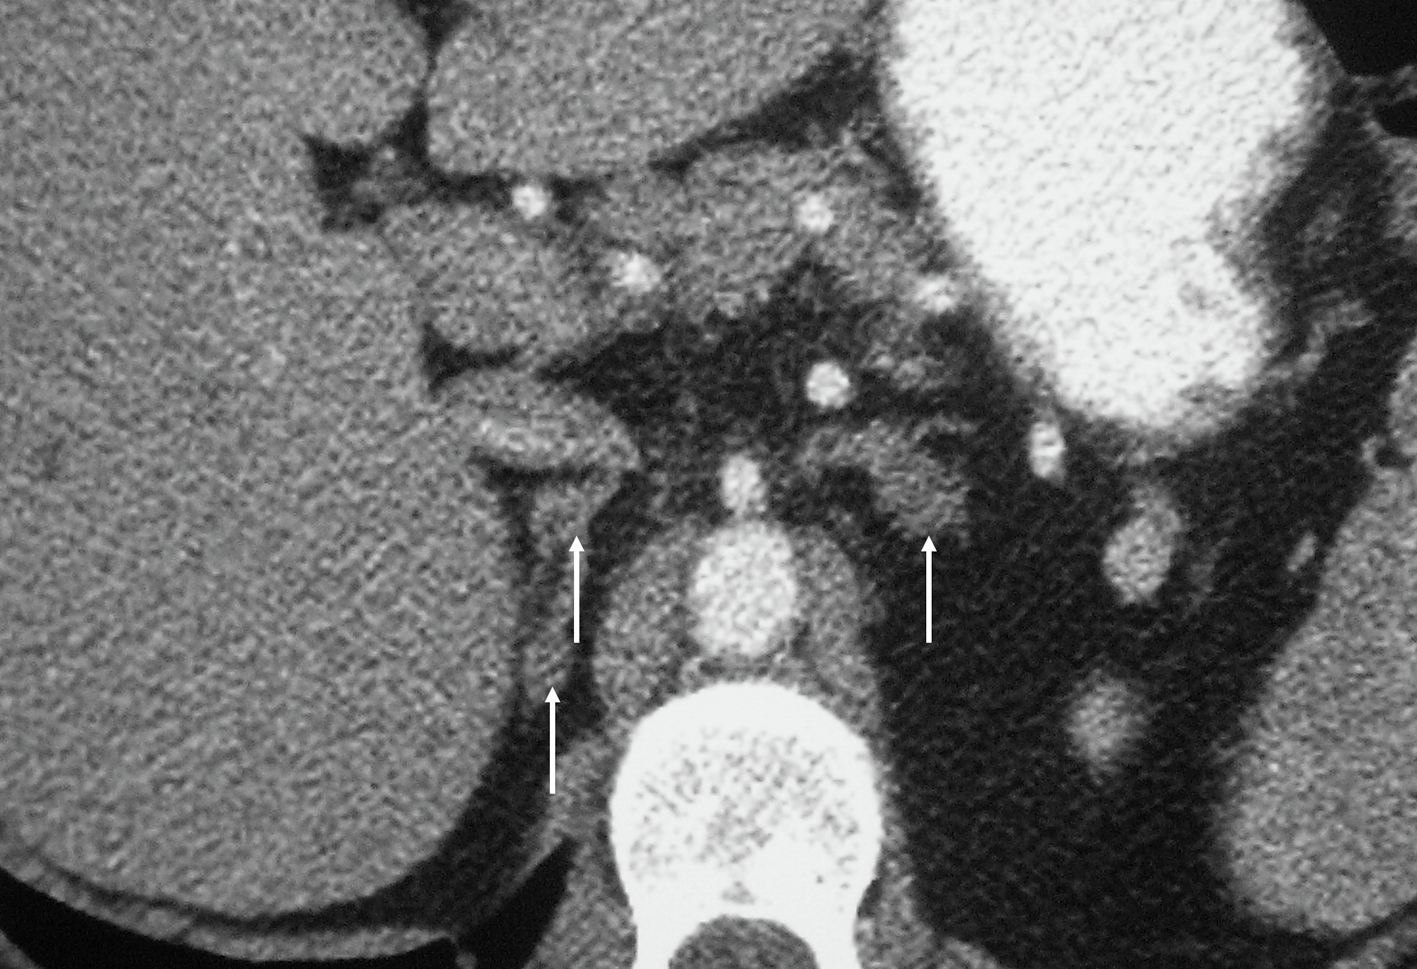
The role of imaging is to differentiate between ACA ( Fig. 20.4 ) and BAH ( Fig. 20.5 ) to allow appropriate treatment between medical therapy and surgery, respectively. Aldosterone secreting adenomas are usually small with a mean size of 1.6–2.2 cm but can be as small as 5mm, and hence, can be difficult to locate [ ]. The sensitivity of detection with CT is 87%–93% with a specificity of 82%–85% [ ]. Adrenal hyperplasia appears on CT imaging as enlarged medial and lateral limbs of one or both adrenal glands, which can be smooth or nodular in appearance and measure greater than 10 mm in diameter. The clinical picture can be complicated by the presence of multiple incidental nonfunctioning nodules, and bilateral nodules that have increased incidence with age and hypertension. These nonfunctioning bilateral nodules can mask an ACA and falsely provide a picture of BAH. Equally, a dominant nodule in one adrenal and undetected micronodular disease in the contralateral gland provides a false impression of an ACA with resultant failure of hypertension control following surgery. The use of CT or MRI findings and AVS has been proposed as part of a clinical prediction score (CPS) to correctly identify patients with unilateral disease suitable for adrenalectomy. Applying the CPS to this group of patients produced a sensitivity of 38·8% and a specificity of 88·5% of correctly identifying unilateral aldosterone production [ ]. In the presence of a unilateral adenoma on CT with a normal contralateral adrenal, unilateral adrenalectomy has a 96% efficiency of achieving cure (46.2%) or improvement (50%) of hypertension [ ].

Imaging for glucocorticoid excess states
Glucocorticoids are secreted by the zona fasciculata of the adrenal cortex, and the principal glucocorticoid is cortisol. Excess cortisol has been linked to hypertension with a linear dose relationship and is a feature of endogenous CS as well as iatrogenic CS caused by synthetic glucocorticoids. Most of the cases of endogenous CS are adrenocorticotrophin (ACTH) dependent (80%–85%). Among patients with ACTH dependent CS, majority (82%–91%) are caused by an ACTH secreting pituitary adenoma [ ]. Less commonly, an ectopic source of ACTH production may be the cause (9%–18% of all ACTH dependent CS) [ ]. In patients with ACTH secreting pituitary adenoma, an MRI pituitary should be performed (see acromegaly section).
CS with suppressed ACTH levels indicates an adrenal source of cortisol overproduction. In an adult with adrenal CS (ACTH independent CS), which represents 15%–20% of all endogenous CS, nearly 95% are secondary to an adrenal adenoma or carcinoma ( Figs. 20.6 and 20.7 ). On CT and MRI, adrenal adenomas causing CS are usually greater than 2.0 cm and have the properties of lipid rich adenomas [ ].

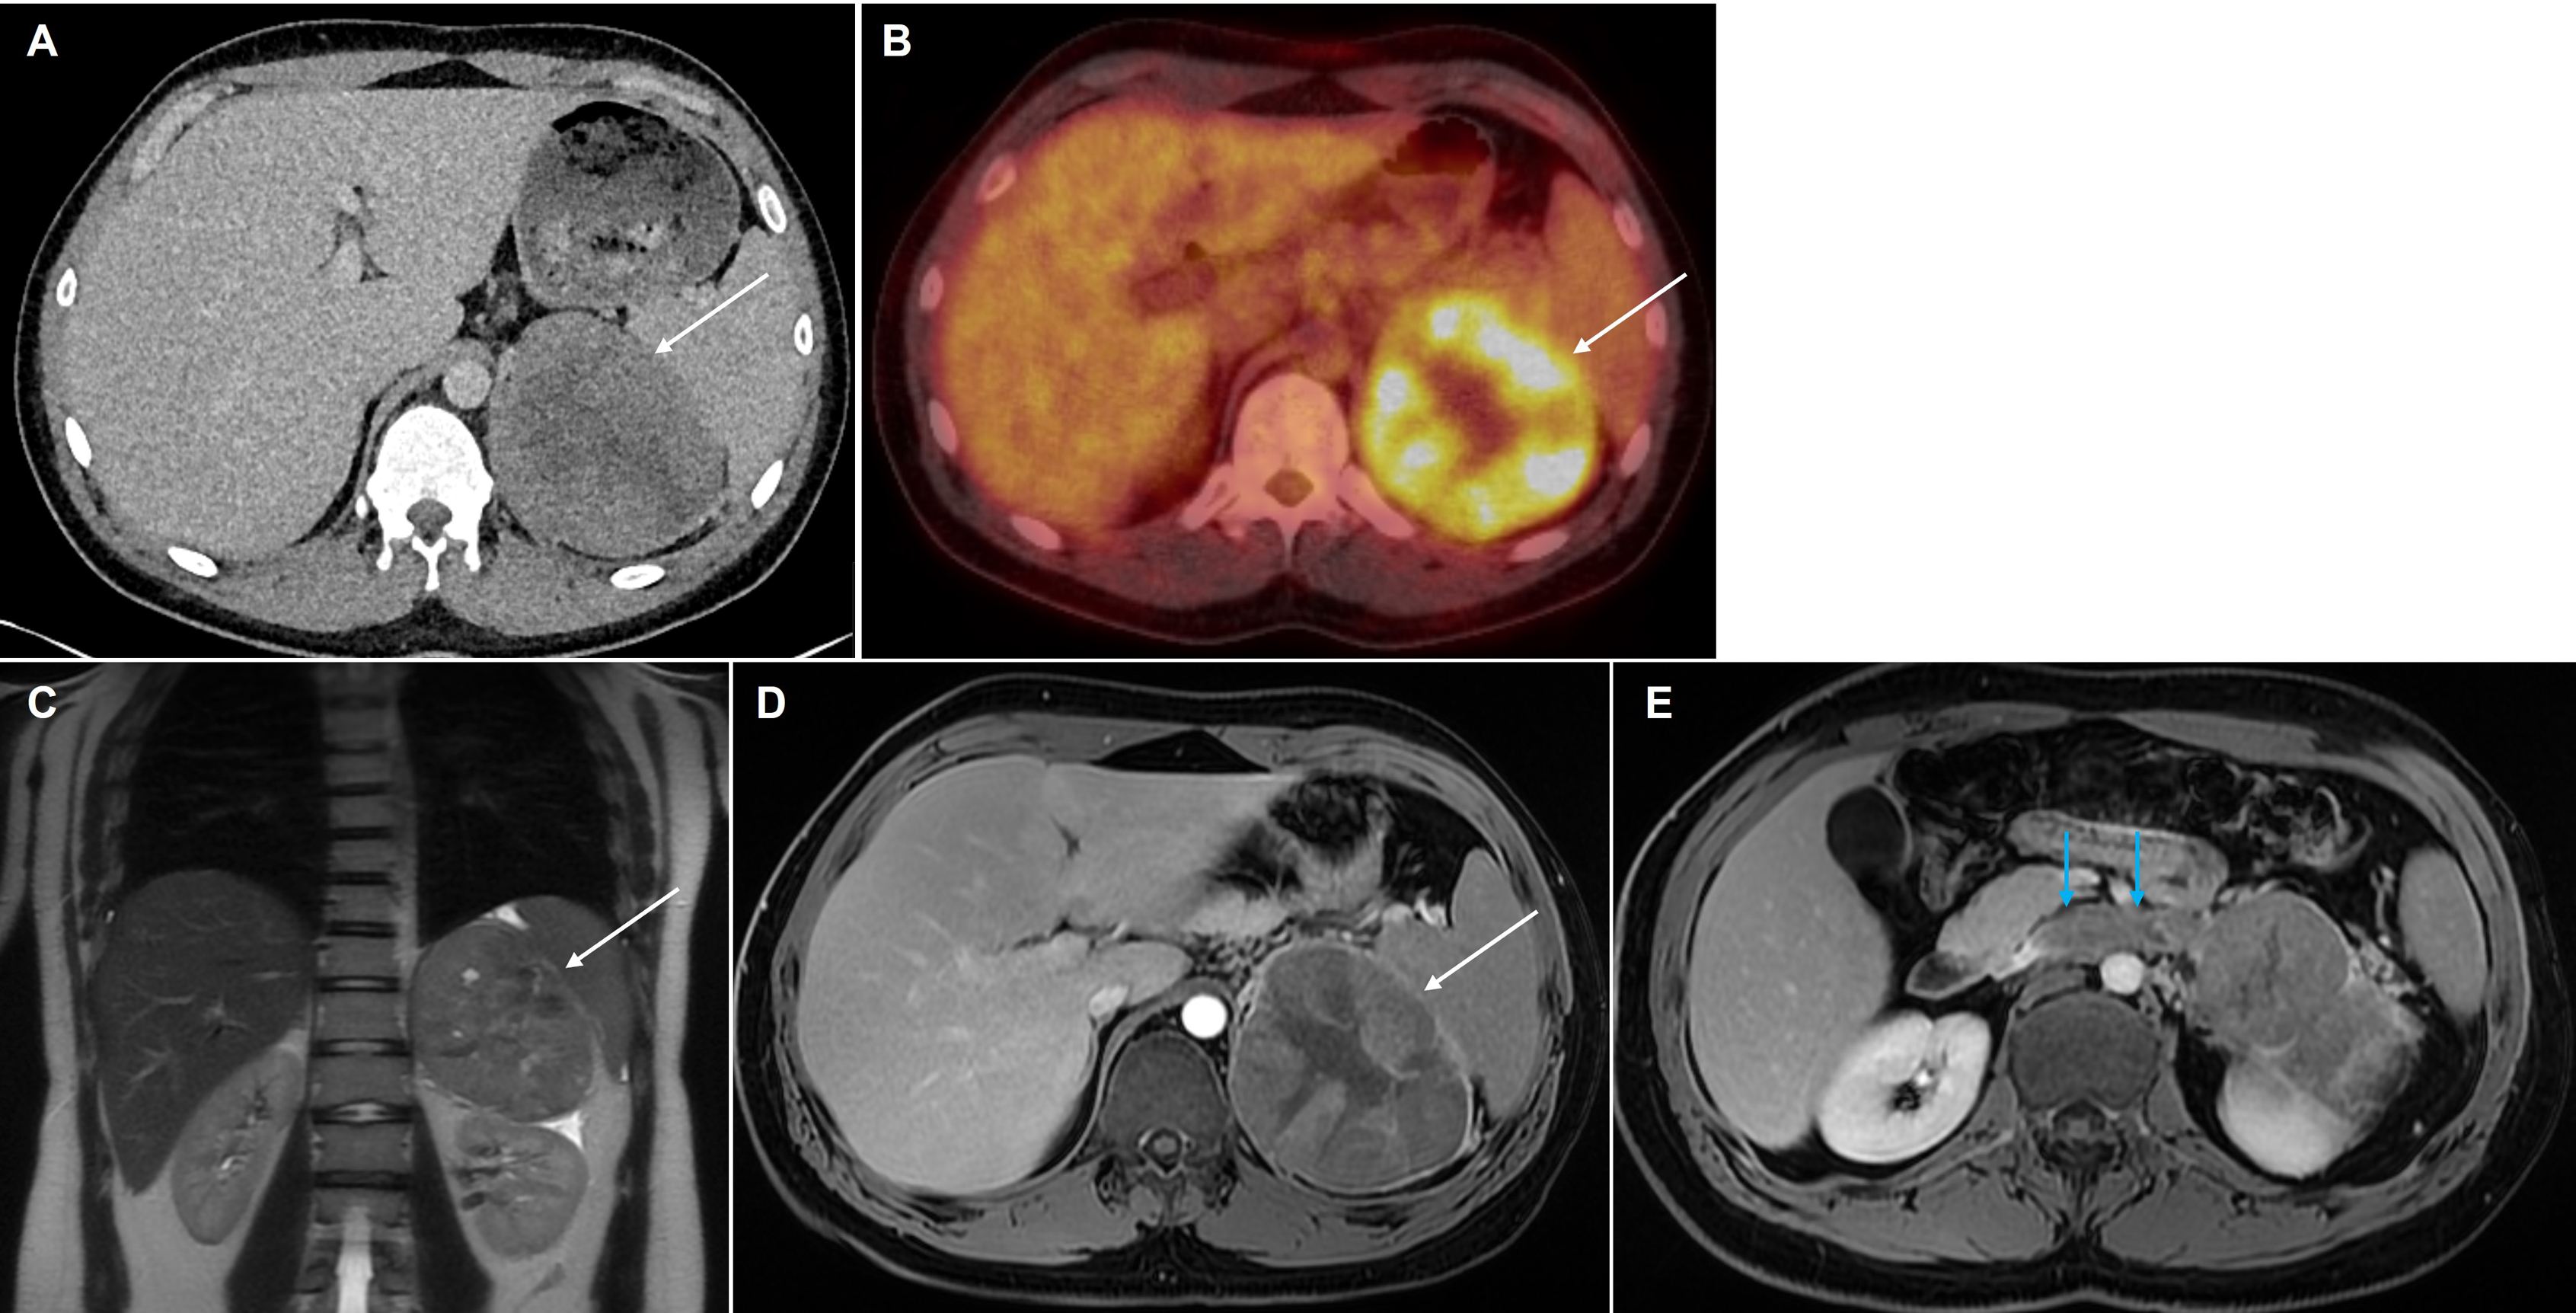
Adrenal carcinomas are rare with a reported incidence of 0.7–2.0 cases per 1,000,000 per year, and approximately 60% are functional, with CS being the most common hormone excess [ ]. Adrenal carcinomas are also associated with Carney complex (CNC), Li Fraumeni syndrome (LFS), Beckwith-Wiedemann syndrome (BWS), Lynch syndrome, Familial Adenomatous Polyposis (FAP), Multiple Endocrine Neoplasia type 1 (MEN 1), Neurofibromatosis type 1 and Werner’s syndrome [ ]. In the rare instance of a functioning adrenocortical carcinoma, it can usually be distinguished from an adenoma by virtue of its size (usually more than 6 cm), heterogeneity and the presence of local invasion, and tumor extension into the inferior vena cava. These tumours tend to appear necrotic with regions of hemorrhage and show peripheral enhancement with little washout in the delayed phase imaging. Smaller ACCs can be distinguished from adenoma as they have imaging properties of lipid poor lesions with absolute and relative contrast washout of less than 60% and 40% respectively.
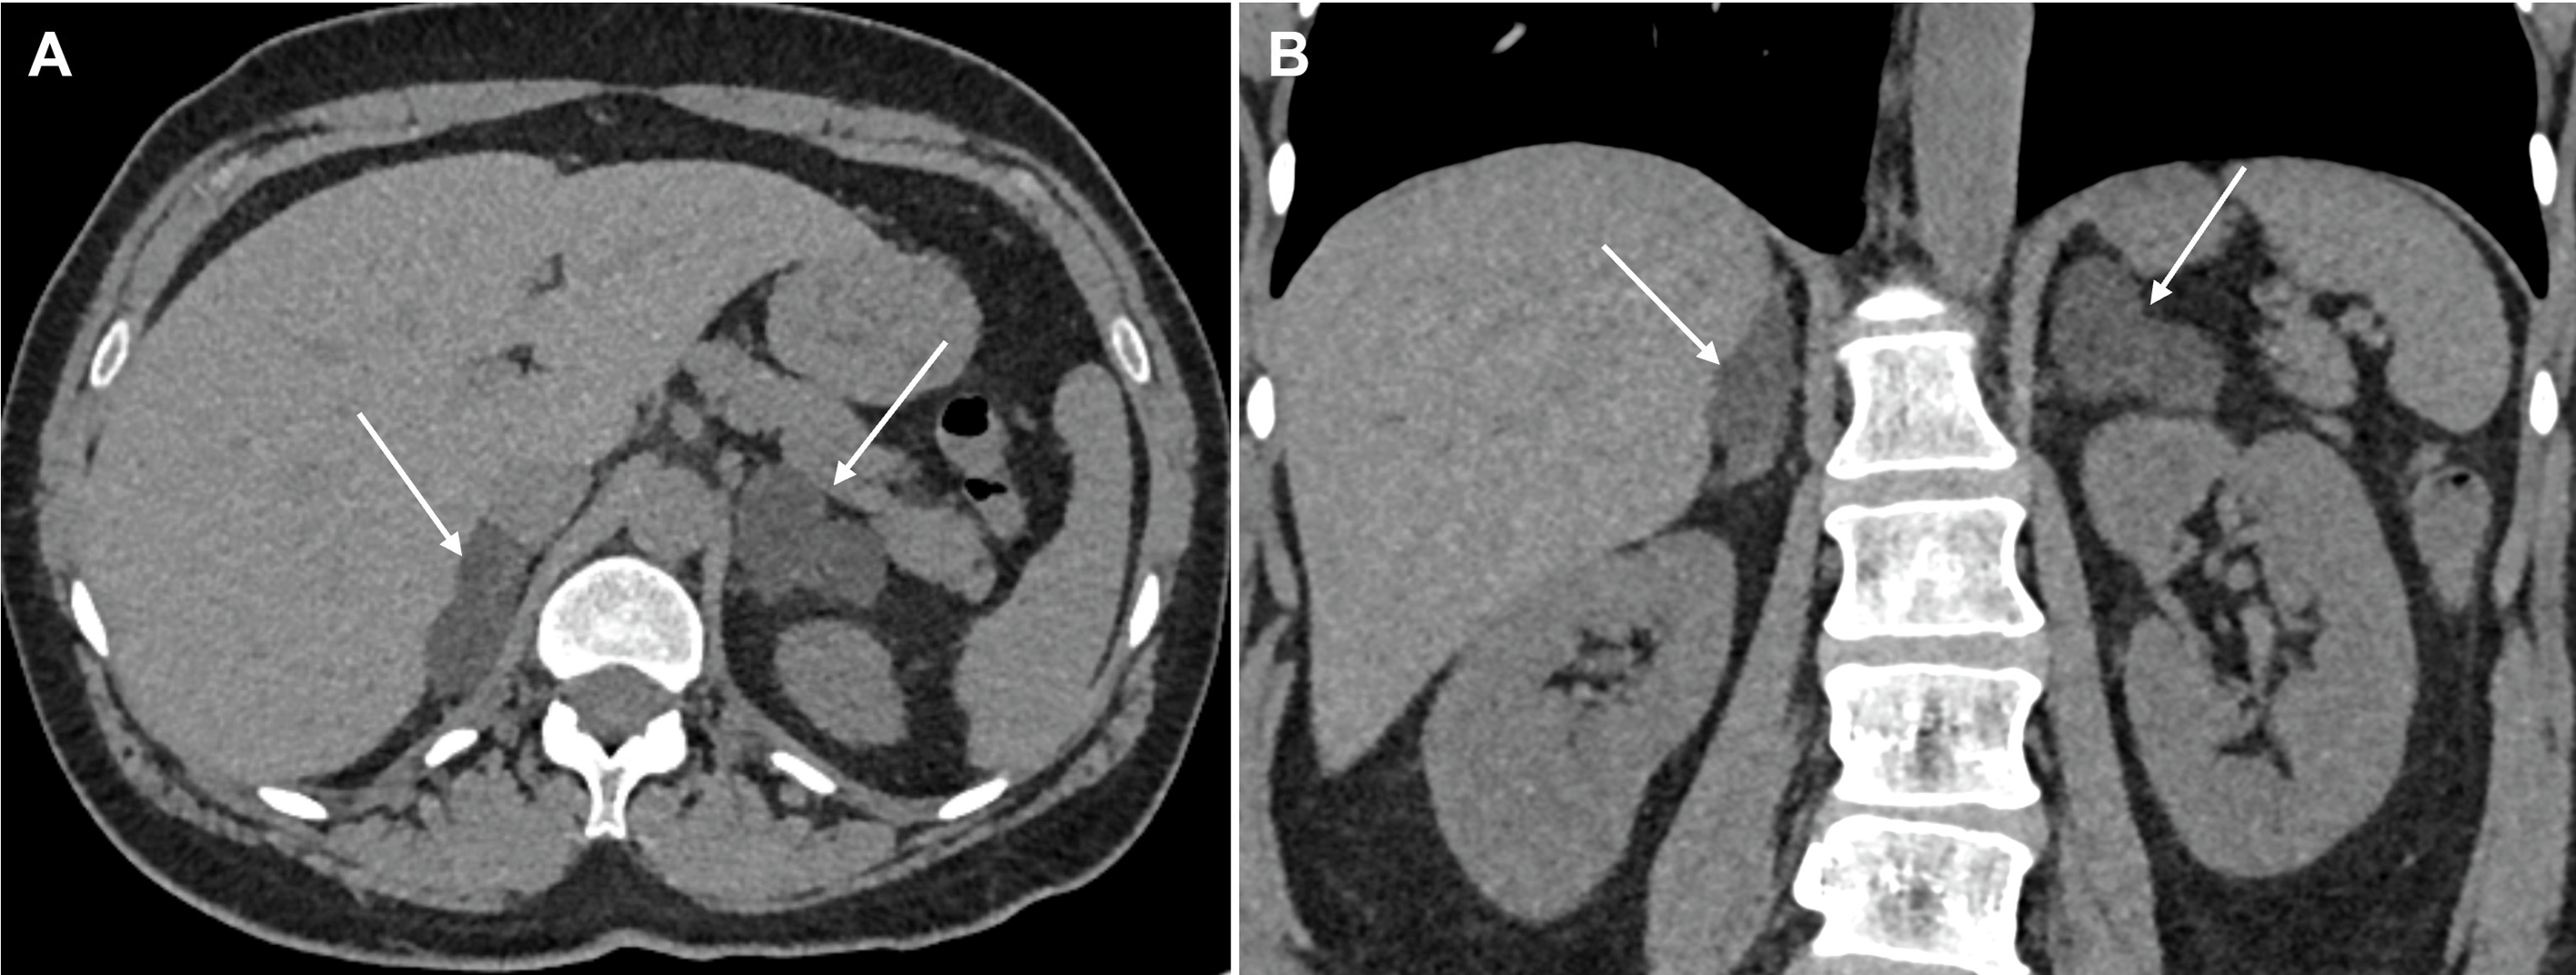
Macronodular BHA (seen in older adults) in association with Massive Macronodular Adrenocortical Disease (MMAD), and Primary Bilateral Macronodular Adrenocortical Hyperplasia (PBMAH) ( Fig. 20.8 ), and micronodular BHA (seen in children and younger adults) in association with Primary Pigmented Nodular Adrenal Hyperplasia (PPNAD), and isolated Micronodular Adrenocortical Disease (iMAD), are rarer causes of adrenal CS [ ].
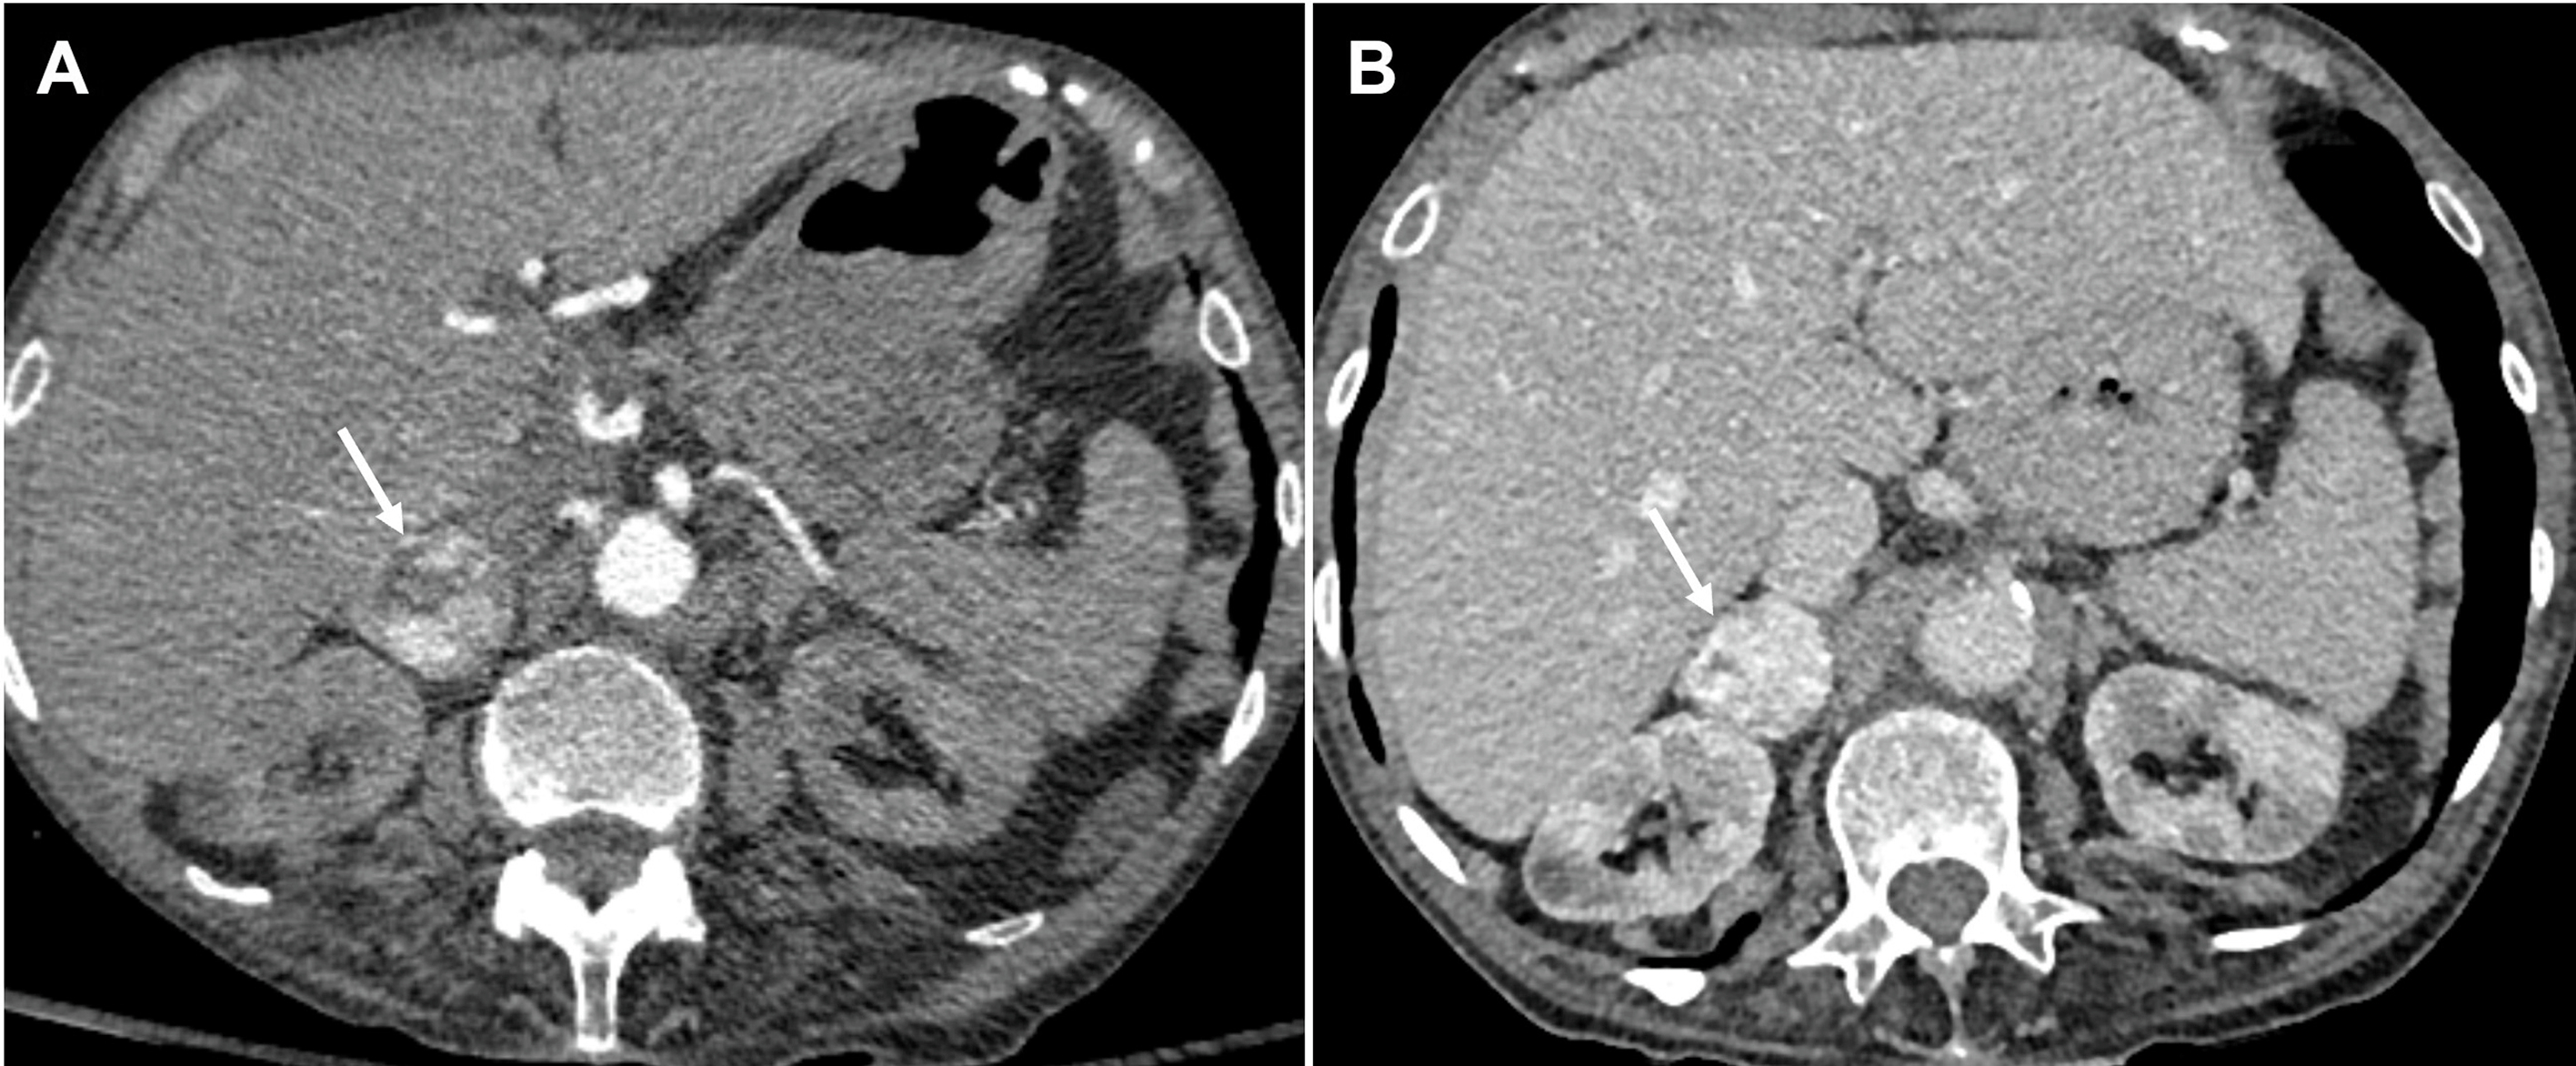
Ectopic production of ACTH, for example, from bronchial and thymic carcinoids, pancreatic neuroendocrine tumours (pNETs), small cell lung cancer (SCLC), medullary thyroid cancer, or a PPGL (PCC/paraganglioma) counts for 9%–18% of ACTH dependent CS [ ]. If an ectopic source of ACTH is suspected, CT imaging of the thorax, abdomen and pelvis with contrast is recommended. The tumour is most likely to be within the lungs (48%), with bronchial carcinoids being the most likely tumor (30%), followed by SCLC (18%) ( Figs. 20.9 and 20.10 ) [ , ]. However, these tumors can be small and difficult to localize, and the sensitivity of lesion detection with CT is only 66% in patients with ectopic ACTH secretion [ ], though the number of unidentified ACTH secreting lesions has improved to 10%–30% in recent years with the improvement of CT technology, the use of thin-slice CT with arterial phase contrast enhancement, and with an increasing awareness among radiologists [ ].


Positron-emission tomography (PET)/CT to localize an ectopic source of ACTH secretion
68 Gallium DOTATATE is a radiolabelled somatostatin receptor 2 (SSTR2) analogue used for the radiological localization of ectopic ACTH secretion, as these receptors are overexpressed by neuroendocrine tumors. It has been shown to be significantly more sensitive than previous techniques such as metaiodobenzylguanidine (MIBG) scintigraphy and 111 Indium octreotide scan and is now the functional imaging method of choice for the diagnosis and staging of neuroendocrine tumours. With a benchtop 68 Germanium/ 68 Gallium eluting generator, this radiotracer can be made on site or at a local facility and has a short half-life of 68 minutes resulting in a lower effective dose to the patient. It is chelated with 1,4,7,10-tetraazacyclododecane-1,4,7,10-tetraacetic acid (DOTA) to the peptide Octreotate, that specifically binds to SSTR2. For detecting and staging neuroendocrine tumors 68 Ga DOTATATE PET/CT is now the imaging method of choice, with a sensitivity of 93% and a specificity of 95% [ ].
Imaging for catecholamine excess states
The adrenal medulla consists of chromaffin cells, derived from embryonic neural crest cells, and secretes the catecholamines—epinephrine and norepinephrine—in response to stimulation by sympathetic preganglionic neurons. Chromaffin-cell tumors of the adrenal medulla are known as PCCs, those originating from the extra-adrenal autonomic ganglia as paragangliomas (PGLs), and collectively they are termed as PPGLs. PCCs account for 80%–85% of all PPGLs, whereas PGLs account for the remaining 15%–20% [ ]. PCCs and sympathetic PGLs (of the thorax, abdomen, and pelvis) are functional tumors that secrete hormones, whereas nearly 2/3 rd of the parasympathetic PGLs (of the head and neck) are nonfunctional tumors [ ]. Nearly 50% of the PCCs has an adrenergic phenotype, and predominantly secrete epinephrine, but with varying amounts of norepinephrine [ ]. The remainder of the PCCs and all the sympathetic PGLs predominantly or exclusively secrete norepinephrine (noradrenergic phenotype), but some secrete significant amounts of dopamine (dopaminergic phenotype). A functioning PPGL can also secrete other hormones such as parathyroid hormone, calcitonin, gastrin, serotonin, and ACTH [ ].
Up to 70% of PPGLs are genetically determined by either germline a mutation (30%–35%), thereby hereditary, or by somatic mutation (35%–40%) in one of the known susceptibility genes [ ]. Increasing frequency of PPGLs is seen in various neuroectodermal syndromes such as neurofibromatosis type 1 (NF1), von Hippel-Lindau (VHL) disease, tuberous sclerosis, and multiple neuroendocrine neoplasia types 2A and 2B (MEN2A/2B). In general, 15%–17% of all PPGLs are metastatic, where metastasis (defined as the presence of chromaffin tissue in nonchromaffin organs including lymph nodes, liver, lungs, and bone) is reported in 2%–25% of PCCs and 2.4%–60% of PGLs [ ]. The metastatic potential varies depending on presence or absence mutations. The highest rate of metastatic potential is noted for PPGL associated with SDHB mutation (30%–70%), whereas that for NF1 is 10%, and that for MEN2/2B, VHL , and SDHD is <5% [ ]. Similarly, the rate of bilaterality is highest for MEN2A/2B (50%–60%), followed by VHL (40%–50%), and NF1 (20%). PPGLs with SDH mutations have a very low rate of bilaterality.
PCC and PGL are rare causes for hypertension, accounting for 0.2%–0.6% of cases [ ]. Hypertension is present in nearly 95% of PPGL patients, with sustained hypertension in 55% and episodic hypertension in 45% [ ]. Hypertension in these patients is often refractory to medical therapy. Clinical symptoms also include headache, sweats, blurred vision, palpitations, and tachycardia. About 10%–49% of the PPGLs are found as adrenal incidentalomas and about 4%–8% of the adrenal incidentalomas are PCCs.
The common sites for PGLs are the para-aortic region at the level of the renal hila, the organ of Zuckerkandl at the aortic bifurcation or origin of the inferior mesenteric artery, thoracic paraspinal region, urinary bladder, and head and neck [ ]. Carotid body tumors and glomus jugulare tumors account for nearly 80% of the head and neck PGL, whereas glomus vagale tumors are less common (2.5%–4.5%) [ ].
The diagnosis of PPGL is made by detecting increased catecholamines or their metabolites in blood or urine samples. Imaging studies are vital to locate the tumour and plan surgical resection. PCCs detected in association with neuroectodermal syndromes, where patients are periodically screened, are often small, whilst sporadic PCCs are usually larger and more easily detected by imaging studies.
A contrast enhanced CT is used as the initial modality for tumor localization and has a sensitivity of 97% and a specificity of 67% for differentiating PCC from ACA [ ]. PCCs have a varied appearance on imaging. A typical lesion will demonstrate a density >10HU on unenhanced images, with a sensitivity of 99% [ ]. Speckled calcification and central necrosis are seen in around 12%, and the majority will enhance avidly [ ]. Imaging the neck, thorax, abdomen, and pelvis with CT scan allows detection of over 95% of adrenal and extra adrenal PPGLs along with associated tumors in the neuroectodermal syndromes ( Fig. 20.11 ).
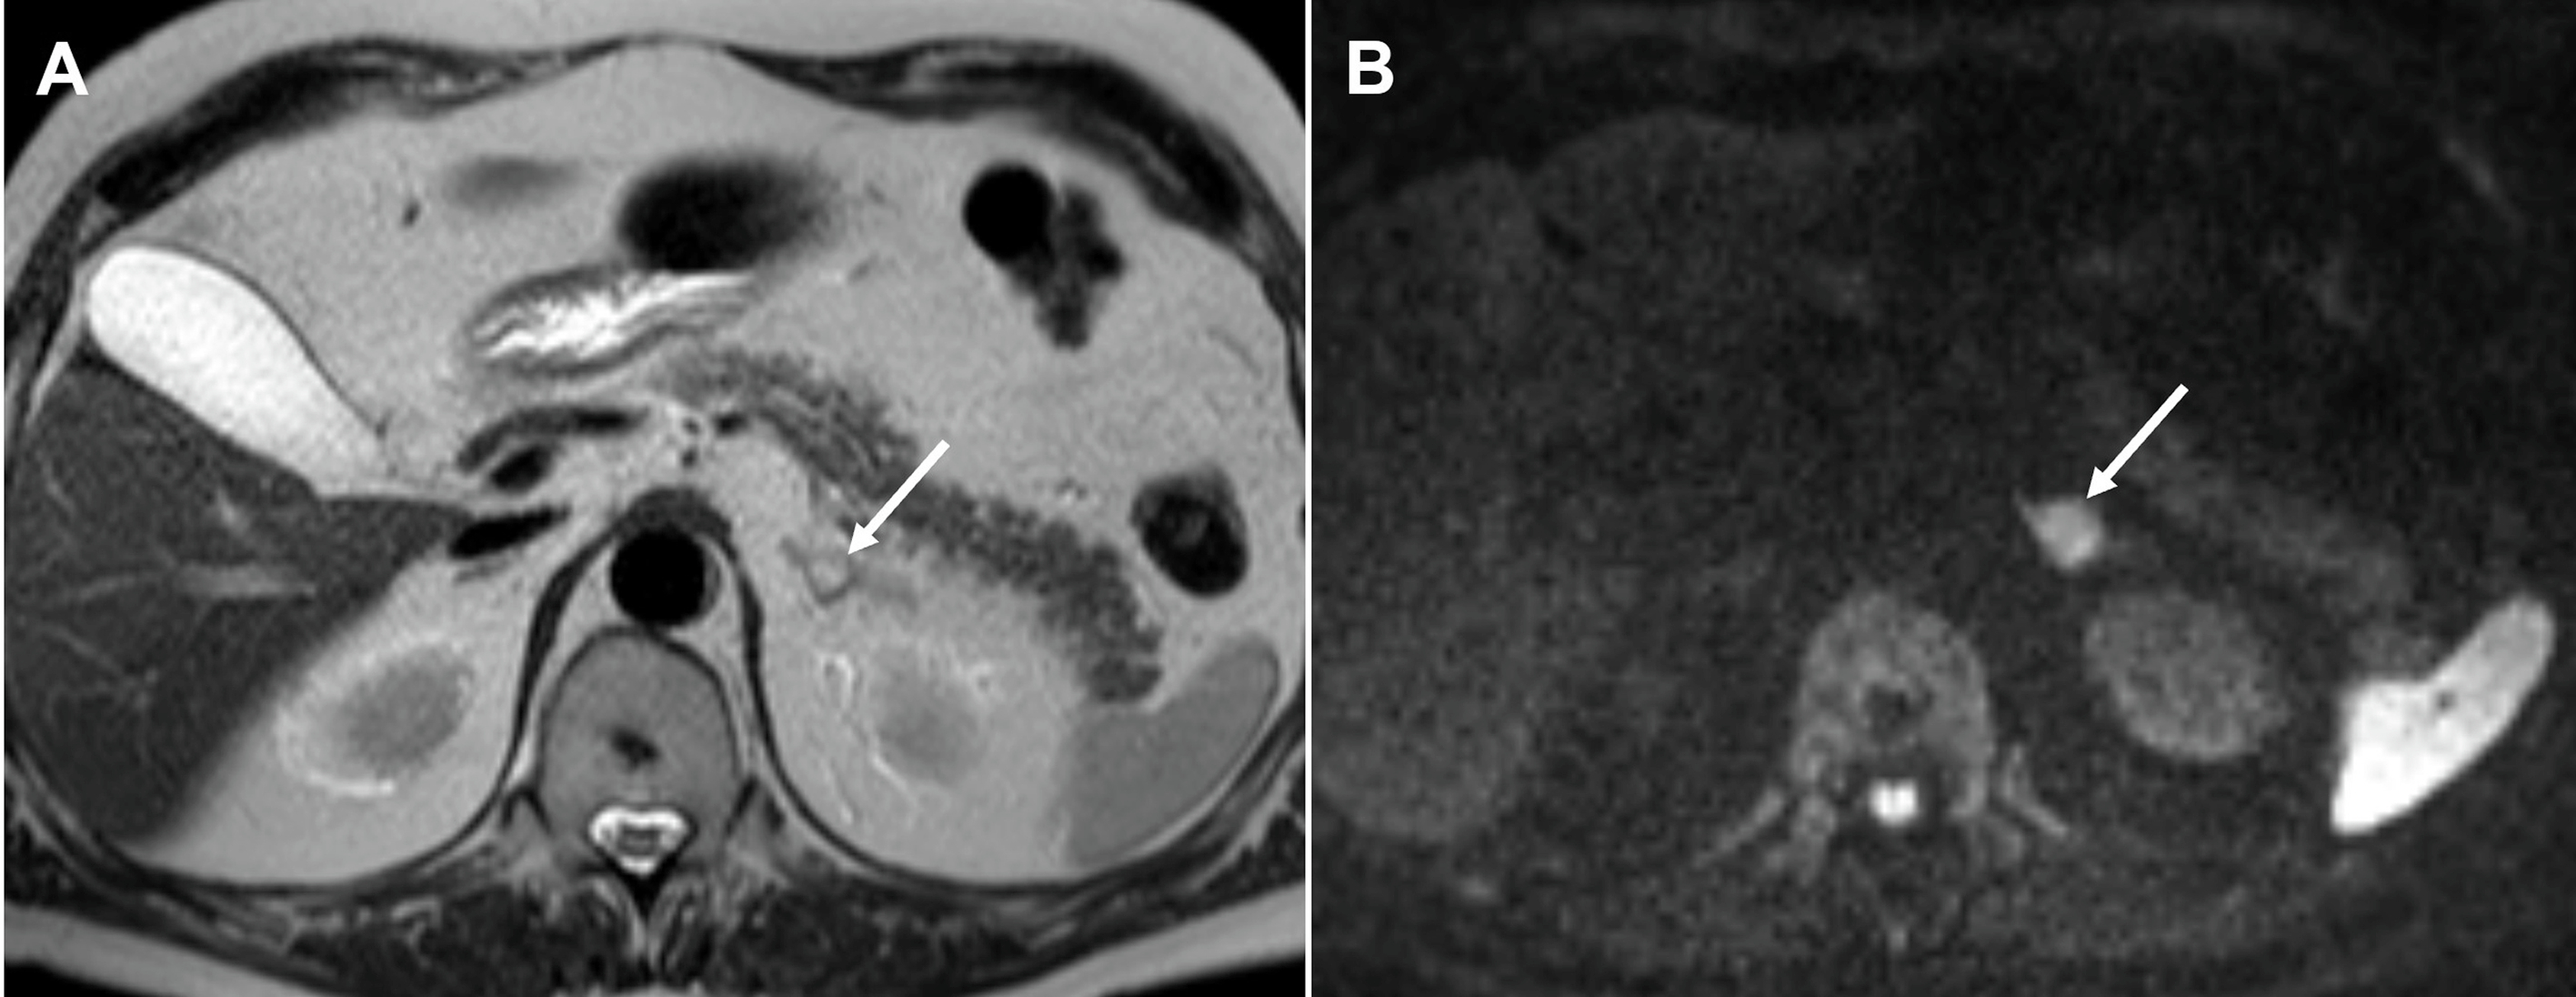
On MR imaging, PCCs are classically hyperintense on T2-weighted images, giving a “light bulb” appearance and are iso- or hypointense to the liver on T1 weighted images, with high T1 signal of hemorrhage in up to 20%. Diffusion weighted imaging increases the lesion conspicuity and aids the detection of small lesions in patients being screened for PCCs ( Fig. 20.12 ). Larger tumors are usually more heterogeneous with areas of necrosis, hemorrhage and/or calcification ( Fig. 20.13 ). There is typically no signal drop out on out-of-phase CSI to suggest intracellular fat content. Without the presence of vascular and adjacent organ invasion or metastatic disease, imaging is unable to distinguish between benign and malignant PCCs. 68 Ga DOTATATE PET/CT is useful in detecting and characterizing occult extra-adrenal tumors, multifocal lesions, or metastatic disease ( Fig. 20.14 ).

