Hormone-Fuel Interrelationships: Fed State, Starvation, and Diabetes Mellitus
Neil B. Ruderman
Martin G. Myers Jr.
Stuart R. Chipkin
Keith Tornheim
BASIC PRINCIPLES
Fuel Reservoirs
Humans have a constant requirement for energy but eat only intermittently. To cope with this problem, we usually ingest food in excess of the immediate caloric needs of our vital organs and store the extra calories in the form of hepatic and muscle glycogen, adipose tissue triglyceride, and to a certain extent, tissue protein. In turn, during starvation and in response to various stresses, we break down these fuel reservoirs to provide energy for organ metabolism and function (Fig. 8.1).
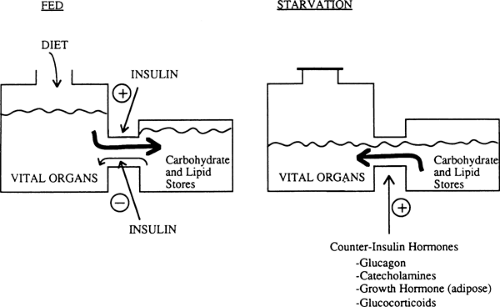 Figure 8.1. Fuel homeostasis in humans. In the fed state, fuels in excess of the needs of vital organs are stored in carbohydrate and lipid reservoirs (i.e., as glycogen and triglycerides and to some extent as protein). During starvation, these stores are broken down to provide fuel for other organs. Changes in circulating levels of insulin and counterinsulin hormones modulate these transitions. |
The two principal circulating fuels in humans, glucose and free fatty acids (FFAs), are stored intracellularly as glycogen and triglycerides, respectively. The largest reservoir of glycogen (300 to 500 g) is skeletal muscle (1). However, the principal reservoir of glycogen from which free glucose can be released into the circulation is the liver (Table 8.1) (1). The major site of triglyceride storage is adipose tissue. Adipose tissue triglyceride is the most efficient form of energy storage in humans. Triglyceride contains 9.5 kcal per g and the average caloric content of an adipocyte, including its cytosol, is approximately 8 kcal per g (2). In contrast, glycogen contains 4 kcal per g. Furthermore, because 3 mL of water is needed to maintain the intracellular osmolality of each gram of glycogen in vivo (3), in reality glycogen provides only 1 kcal per g. Thus, if the 15 kg of adipose tissue triglyceride in a normal 70-kg man were replaced with an equicaloric quantity of glycogen, the individual would weigh an additional 120 kg!
TABLE 8.1. Fuel Reservoirs in Humans | ||||||||||||||||||||||||
|---|---|---|---|---|---|---|---|---|---|---|---|---|---|---|---|---|---|---|---|---|---|---|---|---|
| ||||||||||||||||||||||||
Body protein, although of considerable mass (Table 8.1), is not, strictly speaking, a fuel reservoir. Protein molecules serve specific roles in maintaining organ structure and function and are less expendable than glycogen or triglycerides. On the other hand, a portion of body protein (e.g., some of the contractile protein of muscle as well as other proteins in liver and muscle) is degraded during starvation and other periods of stress and provides amino acid substrate for gluconeogenesis.
The Brain and Other Vital Organs
The brain has a continuous need for fuel but stores almost no energy as glycogen or fat. Instead, it uses glucose derived from the liver either directly from glycogen or indirectly from other fuel reservoirs through gluconeogenesis. The brain does not use FFAs directly. During prolonged starvation, however, it is able to use energy derived from FFAs after their conversion to ketone bodies. Other vital organs, such as liver, heart, and skeletal muscle, also have a continuous requirement for fuels (Table 8.2), but unlike the brain, these organs can utilize fatty acids directly to meet their energy needs (1,3).
TABLE 8.2. Typical Daily Fuel Requirements of Liver, Muscle, and Brain of a Physically Active, Normally Fed Human | ||||||||||||
|---|---|---|---|---|---|---|---|---|---|---|---|---|
|
Hormonal Regulators of Fuel Homeostasis
Energy reservoirs in humans are built up and broken down in response to hormonal messages. The principal hormonal messenger is insulin. In the fed state, insulin levels increase, promoting glycogen synthesis in liver and muscle, lipid formation in adipocytes, and amino acid uptake and protein synthesis in most cells. In the postabsorptive state, during starvation and in response to many stresses, decreased insulin levels contribute to glycogen breakdown, lipolysis, hepatic ketogenesis, and decreased synthesis and increased degradation of protein. In the latter situations, a major role of insulin is to act as a restraint on these catabolic events (Fig. 8.1).
Multiple hormones counter the effects of insulin. Glucagon stimulates glycogenolysis, gluconeogenesis, and ketogenesis in the liver (4,5,6,7). Glucagon also can stimulate lipolysis in adipose tissue, although the physiologic relevance of this latter effect is unclear. Catecholamines have effects similar to those of glucagon on the liver and are key regulators of lipolysis in adipose tissue and glycogenolysis in muscle and other tissues. In general, the counterinsulin hormones (also called counterregulatory hormones) liberate energy from fuel reservoirs by actions opposite to those of insulin (Fig. 8.1). However, not all of the actions of these counterinsulin hormones are catabolic. For instance, growth hormone, although catabolic in the sense that it stimulates lipolysis in adipose tissue, also has significant anabolic effects and enhances cell growth (8). Similarly, glucagon has the anabolic property of stimulating amino acid uptake by the liver (6). The potential roles of leptin and other hormones released by the adipocyte in regulating fuel homeostasis will be discussed in the section on adipose tissue.
Nonhormonal Regulation of Fuel Homeostasis
Although fuel homeostasis has been classically envisaged in the context of its regulation by hormones, changes in the concentrations of the fuels themselves may also play a direct role. Thus, increases in circulating glucose levels have been shown to diminish hepatic gluconeogenesis and glycogenolysis and enhance glycogen synthesis independent of their effects on hormone secretion (9,10). In addition, FFAs have been shown to stimulate hepatic gluconeogenesis; indeed recent studies suggest that much of the antigluconeogenic action of insulin in humans and other mammals may be secondary to its antilipolytic action on the fat cell (11).
Glucose Homeostasis
A principal objective of the interplay between insulin and the counterinsulin hormones in humans is the maintenance of normoglycemia. The concentration of glucose in the circulation is more closely controlled than that of any other fuel. Thus, plasma glucose levels are maintained between 4 and 7 mM in normal humans despite varying rates of glucose utilization (Table 8.3), whereas levels of FFAs and ketone bodies may range 10-fold to more than a 100-fold, respectively (12,13). Prevention of hypoglycemia is important because central nervous system (CNS) function is impaired at low plasma glucose concentrations. Likewise, significant hyperglycemia resulting in glycosuria causes a loss of fuel and may contribute to the complications
of diabetes mellitus. Whether plasma glucose levels modestly above or below the “normal” range are undesirable remains to be determined.
of diabetes mellitus. Whether plasma glucose levels modestly above or below the “normal” range are undesirable remains to be determined.
TABLE 8.3. Rates of Glucose Utilization in the Fed and Fasted State | ||||||||||||||||
|---|---|---|---|---|---|---|---|---|---|---|---|---|---|---|---|---|
| ||||||||||||||||
Insulin lowers plasma glucose levels both by stimulating glucose uptake into muscle and adipose tissue and by inhibiting hepatic glycogen breakdown and gluconeogenesis. The different counterinsulin hormones balance these effects of insulin in order to maintain normoglycemia. Thus, glucagon, epinephrine, and norepinephrine are released into the circulation in response to hypoglycemia (7) and during stresses such as exercise, when glucose utilization is altered by other factors (14,15). In addition to stimulating hepatic glycogenolysis and gluconeogenesis, the catecholamines inhibit insulin-stimulated glucose utilization in muscle and promote lipolysis in adipose tissue (16), thereby providing tissues with an alternative fuel to glucose. Glucocorticoids also are released into the circulation in increased quantities in response to hypoglycemia and other stresses (14,15). Glucocorticoids appear to be necessary for the mobilization of energy stores by catecholamines and glucagon; however, their role may be permissive rather than regulatory (17).
FIVE PHASES OF FUEL HOMEOSTASIS
Immediately after a carbohydrate or mixed meal has been ingested, the concentrations of insulin, glucose, and glucagon in plasma favor fuel storage. Once absorption of the ingested food is complete, the concentrations of these and other hormones and substrates change, causing a shift from energy storage in fuel reservoirs to energy mobilization. Further alterations in fuel homeostasis occur with more prolonged food deprivation. These changes can be broken down into five phases on the basis of the source and quantity of glucose entering the circulation. Figure 8.2 illustrates these changes in a hypothetical human who ingests 100 g of glucose and then begins a prolonged fast (13).
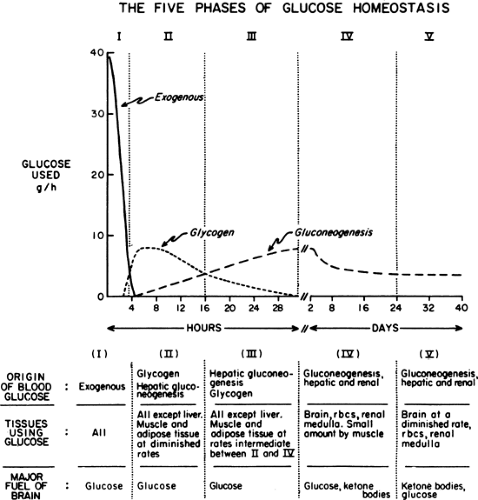 Figure 8.2. The five phases of glucose homeostasis. The figure depicts rates of glucose utilization and the source of glucose entering the circulation in a 70-kg man who ingests 100 g of glucose and then fasts for 40 days. |
Fed State
During the first few hours after a carbohydrate meal, glucose absorbed from the gastrointestinal tract provides for the metabolic needs of the brain and other organs (Fig. 8.2, phase I). The absorbed glucose in excess of these needs is used to rebuild fuel reservoirs in liver, muscle, fat, and presumably in other tissues (Fig. 8.3). In this setting, plasma insulin levels are high, plasma glucagon levels are low, and glycogen synthesis is stimulated in liver and muscle. Approximately 75 g of carbohydrate is stored as glycogen in liver, and 300 to 500 g is stored in muscle in a human who has fasted overnight (1) (Table 8.1).
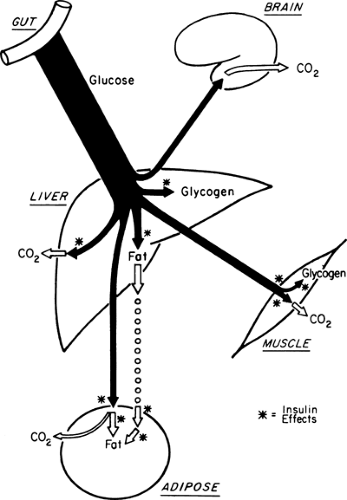 Figure 8.3. Fuel metabolism during a carbohydrate meal. Soon after the ingestion of carbohydrate, insulin levels rise and stimulate the uptake of glucose. Glucose is the major oxidative fuel of all major tissues at this time. Glucose that is present in excess of the oxidative needs of tissues is stored as glycogen or lipid. Asterisks indicate steps enhanced by insulin. |
As noted earlier, the major form of lipid storage in humans is triglyceride and the major site for triglyceride storage is adipose tissue (2). Smaller amounts of triglyceride are stored in muscle, liver, and other tissues. Triglycerides also are present in
the circulation as constituents of lipoproteins. However, the major circulating lipid fuels are the FFAs. After a carbohydrate meal, high concentrations of insulin favor the use of both glucose and lipoprotein triglycerides for triglyceride synthesis in adipose tissue.
the circulation as constituents of lipoproteins. However, the major circulating lipid fuels are the FFAs. After a carbohydrate meal, high concentrations of insulin favor the use of both glucose and lipoprotein triglycerides for triglyceride synthesis in adipose tissue.
In addition to promoting the synthesis of glycogen and triglycerides in the fed state, insulin inhibits the breakdown of these fuel reservoirs (18) (i.e., it is anticatabolic). The concentrations of insulin that inhibit lipolysis appear to be lower than those that stimulate glucose transport in muscle. Presumably, it is for this reason that patients with mild type 2 diabetes and glucose intolerance are hyperglycemic in the absence of significant elevations of plasma FFAs or ketone bodies.
Early Starvation
With the decrease in plasma insulin and the increase in plasma glucagon that accompany an overnight fast, fuel homeostasis shifts from energy storage to energy production (Fig. 8.4). At this stage, glucose no longer enters the circulation from the gastrointestinal tract but is derived principally from the breakdown of liver glycogen and, via gluconeogenesis, from lactate, amino acids, and glycerol, a process that takes place predominantly in the liver (1) but that also occurs in the kidney (19) and intestines (20). In addition, circulating FFAs, derived from the hydrolysis of adipocyte triglycerides, become a major source of fuel (21). As will be discussed later, by using FFAs, muscle and liver decrease their oxidation of glucose as a fuel, thereby conserving it for the brain.
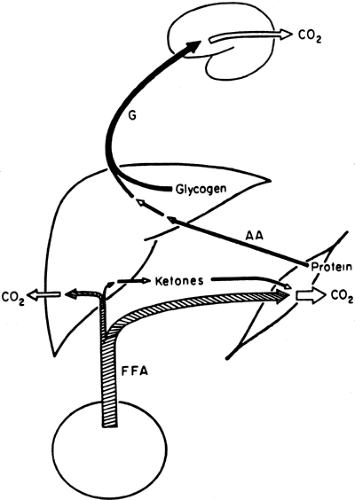 Figure 8.4. Fuel metabolism after an overnight fast (postabsorptive). After approximately 12 hours of starvation, insulin concentrations have returned to basal levels and glucose (G) entering the circulation is derived from both hepatic glycogen and gluconeogenesis. Free fatty acids (FFA) produced from adipocyte lipolysis have become a principal fuel for skeletal muscle. AA, amino acids. |
MOBILIZATION OF CARBOHYDRATE AND LIPID STORES
In the earliest phase of starvation (i.e., the postabsorptive state), hepatic glycogen is a major source of the glucose entering the circulation and remains so for 12 to 24 hours (22,23). Glucagon seems to be necessary for hepatic glycogenolysis during this period, although an increase in the level of plasma glucagon does not appear to be the primary stimulus (24,25,26). After an overnight fast, the average rate of glucose utilization by a healthy human is approximately 7 g per hour (Table 8.3) (1). By extrapolation, the 70 to 80 g of glycogen present in the liver can provide glucose to the brain and peripheral tissues for 12 to 16 hours. Two events allow the maintenance of blood glucose levels beyond this time: (a) Muscle and other tissues begin to oxidize lipid-derived fuels in place of glucose, and (b) hepatic gluconeogenesis, which is also stimulated by fatty acids, replaces glycogenolysis as the principal source of glucose entering the circulation (Fig. 8.4). As will be discussed later, glycogen breakdown in muscle does not yield significant quantities of free glucose, and after an overnight fast, gluconeogenesis by the kidney is of minor importance.
Two factors stimulate the breakdown of adipocyte triglyceride during starvation. First, the concentration of circulating insulin diminishes and, consequently, triglyceride synthesis is decreased and lipolysis is enhanced (2,27). Second, norepinephrine is released from sympathetic nerve endings and directly stimulates lipolysis by raising levels of cyclic adenosine monophosphate (cAMP) in adipocytes (2,27). Epinephrine, which is secreted from the adrenal medulla, appears to play a lesser role. The mechanisms by which FFAs are released into the circulation are discussed in the section “Adipose Tissue.” The principal users of FFAs during the early phases of starvation are skeletal muscle and liver.
GLUCONEOGENESIS
Because the brain is unable to use FFAs as a fuel, it must continue to use glucose during the early phases of starvation. Gluconeogenesis is an important source of the glucose that enters the circulation even after an overnight fast (28) and becomes the major source as hepatic glycogen stores become depleted (Fig. 8.2, phase III) (23). Gluconeogenesis is responsible for approximately 35% to 60% of the hepatic glucose output after an overnight fast (12 to 15 hours postabsorptive) and for more than 97% of the output by 60 hours of starvation (23,29,30). At 60 hours, glucose production is limited not by the enzymatic capacity of the liver but by the concentration of gluconeogenic substrate in the circulation (31). During the early phases of starvation, the two principal gluconeogenic precursors are lactate and alanine (Table 8.4) (17,32,33,34).
TABLE 8.4. Gluconeogenic Substrates in Humans Starved for 24 Hours | ||||||||||||||
|---|---|---|---|---|---|---|---|---|---|---|---|---|---|---|
|
Lactate comprises 50% of the gluconeogenic substrate of liver in a human who has fasted overnight and is the major gluconeogenic substrate throughout starvation (Table 8.4) (32). When glucose cannot be metabolized beyond pyruvate in peripheral tissues, much of the pyruvate is reduced to lactate, which is then released into the circulation (Fig. 8.5). In red blood cells and renal medulla, this reduction occurs because there are no mitochondria in which pyruvate can be oxidized. In muscle and other tissues, lactate and pyruvate are released during starvation because the activity of pyruvate dehydrogenase, the enzyme that decarboxylates pyruvate to form acetyl coenzyme A (CoA), is decreased (35). For the most part, lactate generated from glucose in this way is taken up by the liver and reconverted to glucose by the gluconeogenic pathway (33). This recycling of glucose between liver and peripheral tissues via lactate is referred to as the Cori cycle.
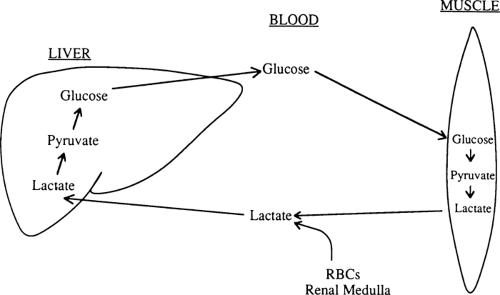 Figure 8.5. The Cori cycle. Lactate derived from glycolysis in skeletal muscle, red blood cells (RBCs), renal medulla, and other tissues is taken up by the liver, which uses it to synthesize glucose. The glucose can then be reused by these same tissues. |
A second major group of gluconeogenic substrates is the amino acids. Skeletal muscle is the principal reservoir of amino acids in humans (34). During early starvation, however, the gut and liver also appear to be important sources of the amino acids entering the circulation (36). A major stimulus to protein catabolism (both decreased synthesis and increased degradation) during starvation is the decrease in plasma insulin concentrations (37,38,39). Glucagon stimulates protein degradation in liver, and glucocorticoids inhibit protein synthesis in muscle and other tissues (34). Although increases in the plasma levels of these counterinsulin hormones almost certainly play a role in modulating protein catabolism in stressful states (e.g., diabetic ketoacidosis and trauma), their concentrations are not dramatically altered during starvation, and their role here is thought to be limited.
The principal amino acids released into the circulation from muscle are alanine and glutamine (Fig. 8.6). Most of the alanine
is taken up directly by the liver, whereas glutamine is metabolized in the gastrointestinal tract, which can use it for gluconeogenesis and to generate alanine (20), and by the kidney, where it is the principal gluconeogenic substrate (19) as well as a major source of the NH3 used for neutralizing acid in urine. Glutamine and alanine, despite comprising only 15% to 20% of muscle protein (34,39,40,41), account for 50% of the amino acids released by muscle because these amino acids can be generated from other constituents in muscle as well as from the degradation of protein. Alanine is formed by the transamination of pyruvate by alanine aminotransferase and glutamine by the amidation of glutamate by free ammonia, a reaction catalyzed by glutamine synthetase (41).
is taken up directly by the liver, whereas glutamine is metabolized in the gastrointestinal tract, which can use it for gluconeogenesis and to generate alanine (20), and by the kidney, where it is the principal gluconeogenic substrate (19) as well as a major source of the NH3 used for neutralizing acid in urine. Glutamine and alanine, despite comprising only 15% to 20% of muscle protein (34,39,40,41), account for 50% of the amino acids released by muscle because these amino acids can be generated from other constituents in muscle as well as from the degradation of protein. Alanine is formed by the transamination of pyruvate by alanine aminotransferase and glutamine by the amidation of glutamate by free ammonia, a reaction catalyzed by glutamine synthetase (41).
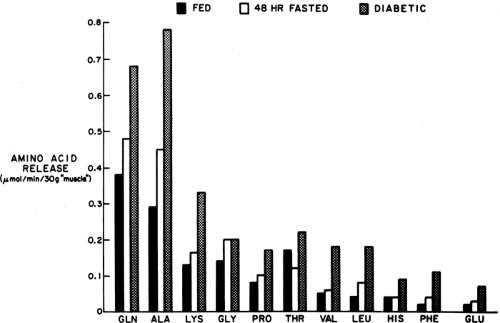 Figure 8.6. Release of amino acids from hind limb muscle of fed, fasted, and streptozotocin-diabetic rats perfused with an amino acid-free medium. The amino acids released in greatest amount are glutamine and alanine. In humans, the pattern of amino acid release is similar except that glutamine is taken up from the circulation. |
The rate of release of alanine increases markedly during starvation and other states of insulin deficiency (34,42). Despite this, the concentration of alanine in plasma is usually diminished in these situations because its uptake by the liver is stimulated to an even greater extent. Since the interorgan relationships of alanine are very much like those of lactate, a “glucose-alanine cycle” similar to the Cori cycle has been proposed (22). Impaired release of alanine from muscle has been postulated as a contributor to impaired gluconeogenesis and hypoglycemia in patients with uremia, maple syrup urine disease, and ketotic hypoglycemia of infancy and in starved women during pregnancy (43).
The other major gluconeogenic substrate is glycerol, which is derived principally from the hydrolysis of adipose tissue triglyceride. In nondiabetic subjects, the rate with which glycerol appears in the circulation correlates with adipose mass (44) and increases during starvation. Glycerol comprises about 10% of total gluconeogenic substrate during early starvation and a much higher percentage during prolonged starvation, when gluconeogenesis from amino acids is markedly diminished (see below).
Prolonged Starvation
KETONE BODIES AND THE BRAIN
With the prolongation of starvation, several events occur that limit the need for gluconeogenesis and thereby conserve body protein (Fig. 8.7). The first of these, as already noted, is an increase in the reliance of muscle and other peripheral tissues on lipid-derived fuels: initially FFAs and later both FFAs and the ketone bodies, acetoacetate and β-hydroxybutyrate. The second is a change in the fuels used by the brain. During early starvation, the CNS continues to use glucose as its exclusive fuel. However, as starvation is prolonged, plasma levels of the ketone bodies increase to values even greater than the level of glucose (Fig. 8.8). Under these circumstances, the brain, or at least parts of it, increases its use of these lipid-derived fuels (1,45,46). A third factor could be a decrease in plasma leptin, which by diminishing sympathetic nervous system activity, would diminish the basal metabolic rate.
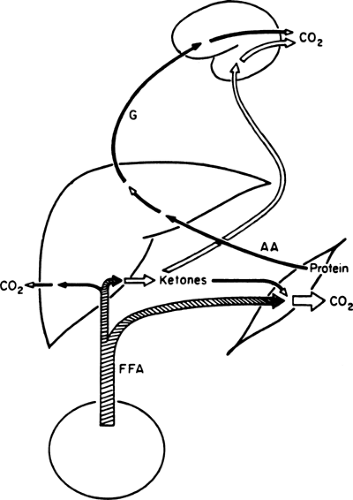 Figure 8.7. Fuel metabolism during prolonged starvation. As fasting continues, insulin levels remain suppressed and the principal source of hepatic glucose (G) production is gluconeogenesis. Skeletal muscle continues to use free fatty acids (FFA) for fuel but also uses ketone bodies produced in the liver. Ketone bodies may also be used by the brain. AA, amino acids. |
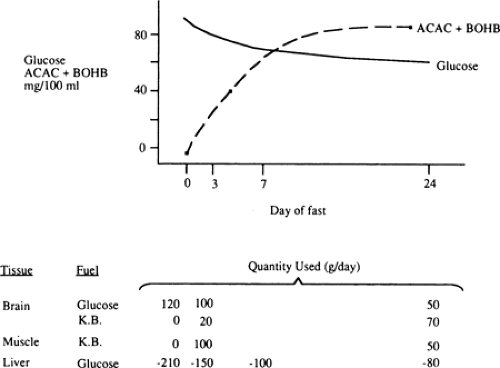 Figure 8.8. Changes in plasma concentrations of fuels during starvation. Blood glucose concentrations decrease during the first 7 days of a fast but then remain relatively stable. As glucose utilization decreases, the concentration and use of ketone bodies increases. After a week of starvation, the concentration of ketone bodies in blood is equal to or greater than the glucose level. K.B., ketone bodies; ACAC, acetoacetate; BOHB, β-hydroxybutyrate. |
Ketone bodies are produced from acetyl-CoA via the β-oxidation of fatty acids in the liver (Fig. 8.9). This process, termed ketogenesis, is enhanced by glucagon and inhibited by insulin. In contrast to long-chain FFAs, the ketone bodies are water-soluble and cross the blood-brain barrier via specific carrier proteins (47,48,49). Furthermore, the activity of these carriers is increased in physiologic states associated with sustained hyperketonemia such as diabetic ketoacidosis and starvation (50,51). These physiologic adaptations enhance the use of ketone bodies in place of glucose by the brain and diminish the need to degrade proteins for gluconeogenesis. It is because of
these adaptations that humans of normal weight are able to survive fasts of up to 60 to 70 days.
these adaptations that humans of normal weight are able to survive fasts of up to 60 to 70 days.
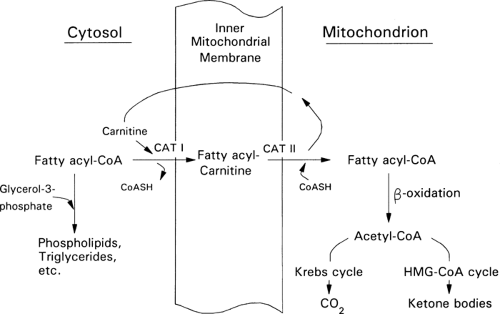 Figure 8.9. Mitochondrial fatty acid transport. Fatty acyl-coenzyme A (CoA) is transported from the cytosol into mitochondria by a series of steps that involves carnitine acyltransferase (CAT) I and II and a carnitine acyltranslocase (not shown). When rates of fatty acid transport into liver mitochondria are high, the hepatocyte obtains most of its fuel needs from the β-oxidation of the fatty acyl-CoA and the Krebs (tricarboxylic acid) cycle is inhibited. By generating malonyl-CoA, an inhibitor of CAT I, insulin inhibits fatty acid transport into mitochondria and, secondarily, ketogenesis. Glucagon has the opposite effect. HMG-CoA, 3-hydroxy-3-methyl glutaryl coenzyme A. |
GLUCONEOGENESIS AND PROTEIN CATABOLISM
The decreased use of glucose by the brain during prolonged starvation is accompanied by a diminished rate of gluconeogenesis in the liver (Fig. 8.2 and Table 8.3). The latter appears to be due to decreases in protein catabolism and secondarily to the release of gluconeogenic amino acids (mostly alanine) from muscle (21,34). Some studies suggest that these adaptations in protein metabolism are related to the increased use of lipid fuels during prolonged starvation (33,52,53). Whatever the mechanism, as one proceeds from early to prolonged starvation, urinary excretion of nitrogen decreases from 12 g per day to 3 to 4 g per day, indicating a decrease in protein catabolism from 75 g per day to 12 to 20 g per day (1).
The relative contribution of the kidney to gluconeogenesis increases from 5% to 10% after an overnight fast to 50% after 3 to 4 weeks of starvation (1,53). However, in absolute amounts, renal production of glucose is still much lower than hepatic production of glucose after 1 to 2 days of fasting. The increase in renal gluconeogenesis during prolonged starvation is linked to an increase in NH3 generation from glutamine.
Unlike amino acids, the relative importance of glycerol as a gluconeogenic precursor increases during prolonged starvation. This reflects the fact that the release of glycerol from fat is approximately 14 g per day and remains nearly constant during early and late starvation (53). After several weeks of starvation, gluconeogenesis from glycerol hypothetically provides upwards of half of the glucose oxidized by the brain.
Hormonal Controls
The gradual decrease in plasma insulin modulates the orderly breakdown of fuel reservoirs during the early phases of starvation. However, during prolonged starvation, the decreases in protein degradation and in the use of glucose and ketone bodies in muscle (see section titled “Muscle”) occur in the absence of further changes in plasma insulin level. Some studies suggest that a decrease in thyroid hormone activity contributes to these adaptations (54). Presumably, the low levels of insulin during prolonged starvation are needed for these adaptations to occur. Thus, patients without any insulin (e.g., during diabetic ketoacidosis) have an impaired ability both to limit the breakdown of their fuel reservoirs and to use glucose and ketone bodies in peripheral tissues. The precise connection between the presence of insulin and these adaptations remains to be determined.
Recent studies suggest that another factor that plays a role in the adaptation of fuel homeostasis during starvation is leptin. As will be discussed in more detail in the next section, during periods of calorie deprivation when plasma insulin levels and adipocyte lipid stores are low, the release of leptin from adipose tissue diminishes, leading to an altered release of neuropeptide Y (NPY) and other CNS peptides and secondarily to a decrease in activity in the sympathetic nervous system. Although the precise interrelation of this chronic regulation of fuel metabolism to that modulated by insulin and counterinsulin hormones is only partially understood, it is highly likely that leptin plays a significant role in the adaptation of mammals to prolonged starvation (55,56).
HORMONE–FUEL INTERRELATIONS AT AN ORGAN LEVEL
Adipose Tissue
THE ADIPOCYTE IN METABOLIC REGULATION
While the adipocyte has classically been viewed as a storage depot for metabolic fuel in the form of lipid, it is now clear that the fat cell plays a central role in the endocrine regulation of energy homeostasis (57). Adipocytes not only respond to numerous hormones to regulate the storage and release of lipids but also secrete hormones (such as leptin, summarized above) that act to control energy balance and endocrine function throughout the rest of the body (57,58,59). The adipocyte also secretes a number of other protein factors, including resistin (also known as Fizz3) (60); tumor necrosis factor-α (TNF-α), an inflammatory cytokine (61); and Acrp30 (or adiponectin and adipoQ) (62), that may regulate insulin sensitivity elsewhere in the body. Although it was initially suggested that resistin increases with increasing adiposity and plays a role in insulin resistance associated with obesity, a number of subsequent studies failed to support this notion (60,63,64), and more research is necessary to determine the physiologic function of resistin. TNF-α mediates elements of insulin resistance and type 2 diabetes syndromes in some mouse models of obesity and diabetes, although the relevance of TNF-α to obesity and insulin resistance in humans remains unclear (61). In contrast to resistin and TNF-α, Acrp30 appears to mediate insulin sensitization (62). Acrp30 is an adipocyte-derived complement-related protein that is secreted as a high-order multimeric complex. Its production by adipocytes is decreased in obesity and other states of insulin resistance, and exogenously increased levels of this protein enhance numerous insulin actions. Although a great deal remains to be learned about Acrp30 (e.g., the identity of the functional proteolytic product, receptor identity) (62,65), this molecule currently commands a great deal of attention as an insulin sensitizer.
Related posts:

Stay updated, free articles. Join our Telegram channel

Full access? Get Clinical Tree


