HEIGHT AND WEIGHT
Height and weight standards derived from one ethnic group cannot always be applied to other ethnic groups. Furthermore, use of current standards is important, because growth data obtained from a previous generation may not apply to the present generation. The National Health Survey collected growth and anthropometric data on American children from 1963 to 1974 (Table 7-1).1,2,3,4,5,6,7,8 and 9 These data provide standards that can be correlated with sex, race, and socioeconomic status. The growth charts distributed by pharmaceutical companies are derived from these National Health Survey data. Because the growth standards of American white and black children do not differ significantly, a single growth standard can be used. Significant differences do exist, however, in the growth standards of American children of Asian descent.7
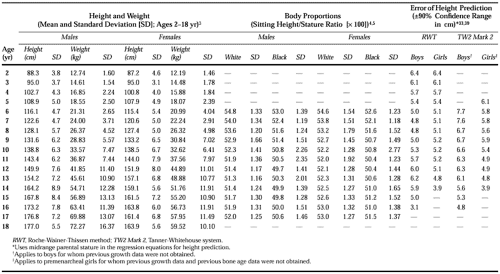 |
Figure 7-1, Figure 7-2, Figure 7-3 and Figure 7-4 show the current growth data from the National Health Survey. In Table 7-1, the mean heights, mean weights, and standard deviations (SDs) for children 2 to 18 years of age are detailed. The standard deviation is useful in evaluating extreme deviations in growth (e.g., heights and weights below the standard curves).10 Children whose heights or weights are below the standard curves constitute a significant proportion of the population, because the commonly used growth charts provide data from only the 5th through the 95th percentiles.
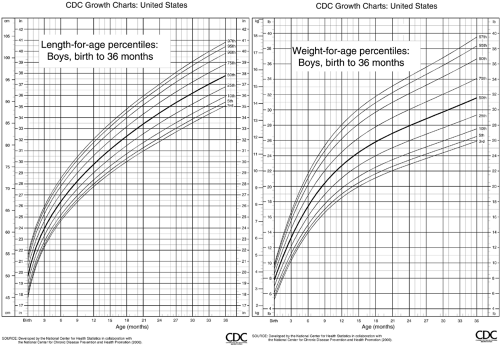 FIGURE 7-1. Length and weight of boys. Birth to 36 months of age. Centers for Disease Control and Prevention, National Center for Health Statistics. CDC growth charts: United States. Full size charts are available on the internet at http://www.cdc.gov/nchs/about/major/nhanes/growthcharts/charts.htm May 30, 2000. |
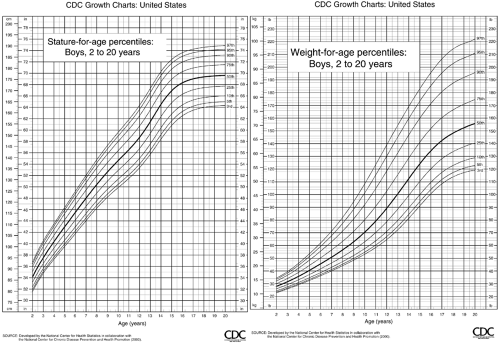 FIGURE 7-2. Height and weight of boys. 2 to 20 years of age. Centers for Disease Control and Prevention, National Center for Health Statistics. CDC growth charts: United States. Full size charts are available on the internet at http://www.cdc.gov/nchs/about/major/nhanes/growthcharts/charts.htm May 30, 2000. |
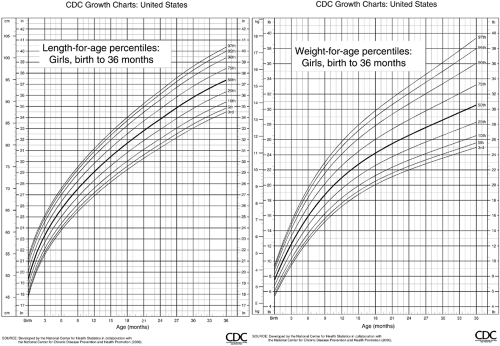 FIGURE 7-3. Length and weight of girls. Birth to 36 months of age. Centers for Disease Control and Prevention, National Center for Health Statistics. CDC growth charts: United States. Full size charts are available on the internet at http://www.cdc.gov/nchs/about/major/nhanes/growthcharts/charts.htm May30, 2000. |
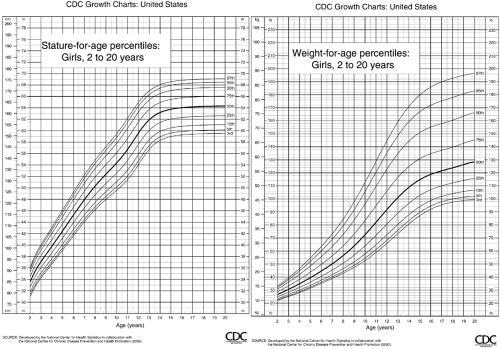 FIGURE 7-4. Height and weight of girls. 2 to 20 years of age. Centers for Disease Control and Prevention, National Center for Health Statistics. CDC growth charts: United States. Full size charts are available on the internet at http://www.cdc.gov/nchs/about/major/nhanes/growthcharts/charts.htm May 30, 2000. |
For children aged 2 to 18 years, growth curves for as low as 2 SD below the mean are available. These curves are more in keeping with the usual definition of “normal” as comprising 95% of the population. Only 2.5% of children would be considered as “short” by these standards (Fig. 7-1, Fig. 7-2, Fig. 7-3 and Fig. 7-4).
The National Center for Health Statistics has revised the current growth charts to reflect a more contemporaneous standard. The new charts contain data from the 3rd to 97th percentiles. The new growth charts are available on the internet at http://www.cdc.gov/growthcharts.
Socioeconomic status was found to play a small but significant adverse role in the growth of children with very low family incomes.6
Beyond age 2 to 3 years, children grow throughout childhood until puberty along a particular height percentile channel that is determined by genetic factors. The normal pubertal growth spurt is reflected by an upward shift in height percentile. As growth decelerates later in puberty with impending epiphyseal closure, a shift downward in height percentile occurs, so that adult height more closely approximates the prepubertal percentile ranking. The reason for these shifts lies in the cross-sectional character of the standard growth charts. Cross-sectional data mask normal longitudinal growth patterns. The growth charts derived from studies in Britain have superim-posed longitudinal growth lines that represent temporal variations in the onset of puberty.11 Similar data are available for North American children.12
A shift in height percentile can also occur during infancy when growth velocities are adjusted in children whose birth lengths are either “too long” or “too short” in comparison with their parents’ heights. The shift upward in percentile generally takes place within the first 6 months of life and is usually completed by 12 months of age. The shift downward in percentile begins later, generally after 3 months of age, and is completed by 18 months of age.13
The influence of midparental stature on the interpretation of a child’s growth status is considered to be of such importance by some workers that conversion graphs and adjustment formulas have been developed. Tanner and coworkers14 developed such curves for British children, and adjustment tables are now available for American children.15 Parental heights can also be used to predict target adult height.16 This can be valuable when the effects of a treatment are analyzed.
The standard growth charts derived from the National Health Survey data are not as applicable for tracking the growth of premature infants or children small for gestational age. However, growth standards are available for such children through 4 years of age.17,18 These growth charts must be adjusted for the degree of low birth weight.19 Further, infants small for gestational age may not truly “catch up” when their heights are compared with those of their siblings.20,21
Related posts:

Stay updated, free articles. Join our Telegram channel

Full access? Get Clinical Tree


