How Many Older People are There?
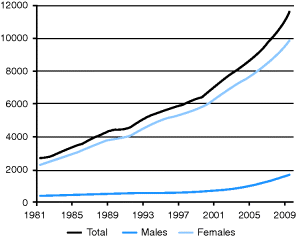
The UK population topped 60 million for the first time in 2005. As well as increasing, the population is ageing, with the biggest percentage changes at extreme old age. The 2001 census was the first where the number of pensioners was greater than the number of children. The proportion of people aged 65 and over is projected to increase from 16% in 2009 to 23% by 2034. Different sources give figures for different age bands and areas, i.e. UK/Great Britain/England and Wales, and since the last census in 2001 figures are estimates, you will find different numbers quoted. However, all agree that the proportion of the population aged 75+ and 85+ is increasing markedly and, in line with this, the most dramatic change is seen in centenarians (11,600 in 2009 increasing over seven-fold to an estimated 87,900 in 2034). This can be explored in detail on the dynamic map on the ONS website (ONS 2010).
Figure 2.1 Percentage composition of the population aged 65+ in England and estimated changes to 2030, with the total number of those aged 65+. Source: Office for National Statistics licensed under the Open Government Licence v.1.0.
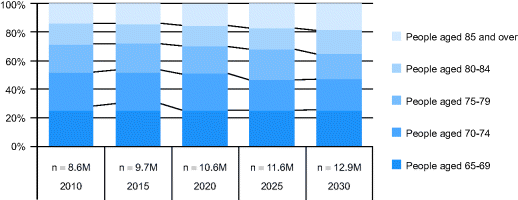
Figure 2.2 Population (number of people) aged 100 years and over in the UK, 1981–2009.
Is Life Expectancy Still Increasing?
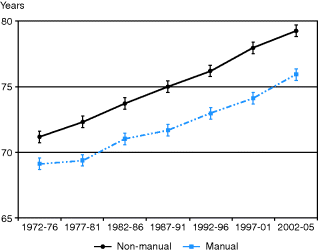
Life expectancy at birth has continued to increase steadily from the 1970s (Figure 2.3). However, despite all the government’s attempts, the difference between social class groups (here grouped into manual and non-manual) has persisted and even widened slightly. This is the main explanation for the regional differences in life expectancy; people living in the north of England live around 2 years less than those in the south.
What is Your Life Expectancy When you are Old?
Life expectancy at extreme old age has always been longer than people think; if a woman born in 1850 lived to 80 years her life expectancy at 80 was another 4 years. For a women born in 1950 this is estimated to be 8.5 years. This is important for clinical management – an 80-year-old newly diagnosed diabetic will have time to develop complications! Currently, in the UK, a man of 65 can expect another 17.6 years of life and a woman another 20.2 years. Unfortunately the gain in healthy life expectancy is not keeping pace with the overall gain in life expectancy, so women in particular spend more time in late life in poor health.
Does Living Longer Mean More Suffering in Old Age?
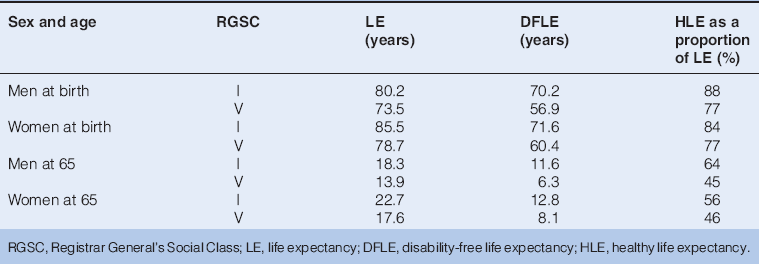
The answer to this question is ‘it depends’. In England in the 21st century, social class – as defined by the Registrar General’s Socio-economic Class (RGSC) – still has a marked effect on life expectancy and disability-free life expectancy. Table 2.1 shows that in each class women live longer than men, but the advantage especially for disability-free life expectancy, of being a member of RGSC I as opposed to V whether calculated at birth or 65 for both men and women is staggering. In social class I, men spend a greater proportion of their lives than women without limiting illness.
Table 2.1 Life expectancy and disability-free life expectancy by Registrar General Socio-economic Class in England, 2001–2003 (ONS 2010)
What are the Characteristics of the Older Population?
Gender
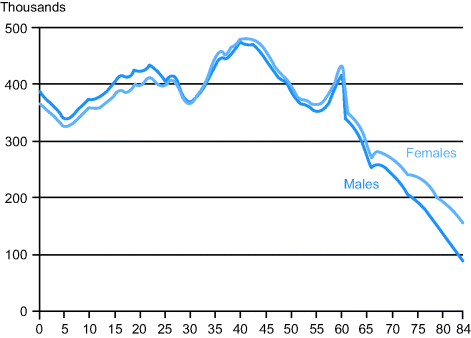
In the population aged 65+, women outnumber men because of their longer life expectancy and the death of young men in World War II, but this ratio is falling. In 1984 there were 156 women aged 65 and over for every 100 men of the same age, compared with the current sex ratio of 129 women for every 100 men, as the war generation dies. By 2034 it is projected that the 65 and over sex ratio will have fallen still further to 118 women for every 100 men. In 2003, there were 40 men per 100 women aged 85+; for 2031 the estimate is 65 per 100 (Figure 2.4).
Figure 2.4 Population (in thousands) by age in the UK, 2007. Source: Office for National Statistics licensed under the Open Government Licence v.1.0.
Ethnicity
There is less ethnic mix in old age than in the general population, where 7.9% were described as non-white in 2001. Whereas 12% of people under 16 are from an ethnic minority group, this is 2.5% at 65+ and only 1% at 85+. However, 10% of Black Caribbean and 7% of Indian people were over 65 years in 2001 (reflecting the earlier migration of these groups to the UK). The London borough of Brent, for example, has a very significant number of older people from ethnic minorities, so local planning is essential.
Geographic Variation
Older people migrate from towns to the country and seaside so the distribution of people above state pension age (currently women of 60+ and men of 65+) is uneven. London is a young city. In 2010, 30% of the population was 65+ in Christchurch, Dorset. By 2033, it is projected that over 40% of the population will be aged 65+ in areas such as West Somerset, Berwick-upon-Tweed, South Shropshire, West Dorset and North Norfolk, compared with the UK average of 22.9%.
Health Status
In the General Lifestyle Survey (GB) 2010 (ONS 2009), 1/3 adults aged 65–74 and 1/2 adults aged 75 and over report a limiting longstanding sickness or disability. Both proportions are similar to a decade ago. Some conditions have a very high prevalence: 16% of women and 10% of men aged 65–74 have diabetes.
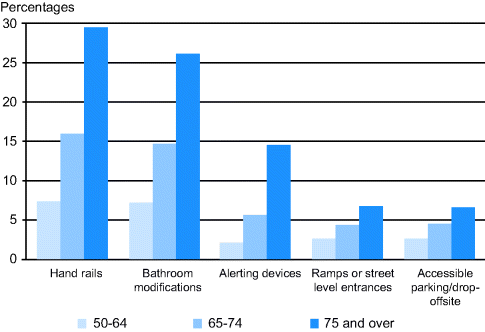
For those aged 65–74, the proportion with a disability increases as income decreases. The effect of income is less marked for those aged 75 and over. Figure 2.5 shows the relationship between increasing age and common adaptations for disability.
Sensory Impairment
In 2008, 64% of the 153,000 on the register of blind people and 66% of the 156,300 people on the register of those with partial sight were aged 75 or over. Twelve percent of the over 75s have visual impairment. Seventy percent of the over 70-year-olds in the UK have some hearing loss, mild in 27%, moderate in 36% and severe in 7%.
Living Companions
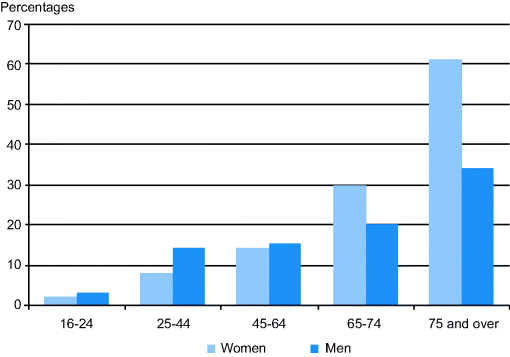
In 2007, in Great Britain, 30% of women and 20% of men aged 65–74 lived alone. Aged 75+ this rose to 61% and 33%. White people are more likely to live alone than those from ethnic minority groups. Overall, one-third of pensioners live alone (Figure 2.6); half of them live with their spouses and only one-fifth live with children, siblings or friends. The extended family is rare in the UK and probably always has been.
Income
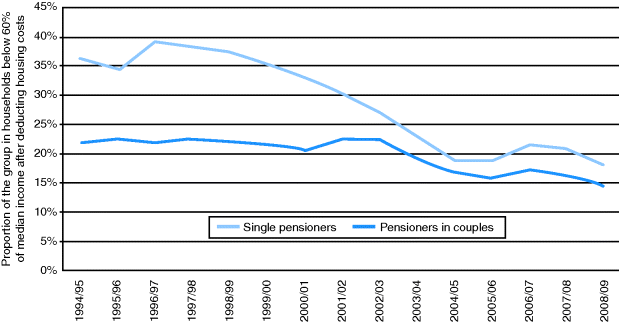
In 2008/09, 1.8 million pensioners lived in poverty (defined as below 60% of contemporary median income), fewer than in 2007/08 when there were 2 million pensioners in poverty (Figure 2.7).
Figure 2.7 The proportion of single pensioners in low-income households, 1994–2009. This has halved over the last decade, with smaller falls for pensioner couples. Source: Households Below Average Income. DWP UK. Updated September 2010.
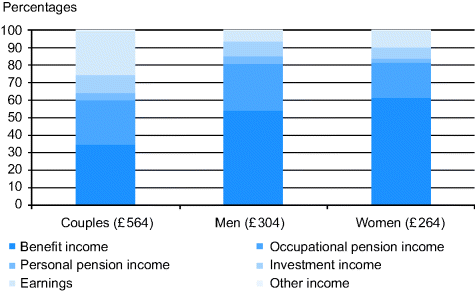
The largest source of income for pensioners is state ‘benefit income’, which includes state pension income and benefits (Figure 2.8). Older pensioners tend to be poorer and spend a higher percentage of their total expenditure on essentials, e.g. heating, food and housing. In the UK, the safety net provided by the social security system is complex and this acts as a deterrent to taking up benefits. Occupational pensions and investment income are increasing in importance.
Where do Elderly People Live?
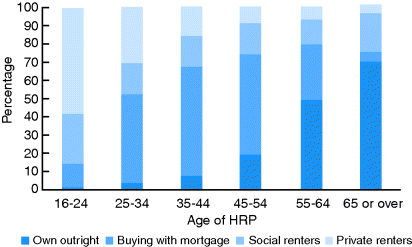
Ninety-five percent of people over 65 in the UK live in their own home (including sheltered flats). This is termed living in ‘the community’, in contrast to institutional care, although care homes should be part of the local community too! Owner-occupiers account for about 70%. A higher percentage of elderly people than middle-aged live in rented accommodation (Figure 2.9). Results from the English House Condition Survey 2004 (Department for Communities and Local Government 2004) showed that housing is steadily improving, although 33% of people aged 75+ still lived in a ‘non-decent’ home (versus 28% of all households) and are more likely to be in an energy-inefficient home (12% versus 8%), or a home in serious disrepair (11% versus 10%). Eight percent of over 65-year-olds live in sheltered housing.
Figure 2.9 Age of household reference person by housing tenure, 2008. Source: English Housing Survey (2010). Full household sample. Crown copyright.
Sheltered Housing
This usually comprises the following:
- A group of small flats (typically one bedroom, living room, kitchenette, bathroom and toilet) often around communal facilities for meals or social activity.
- Provided by the local authority, housing associations, voluntary sector and increasingly the private sector.
- Scheme manager or ‘warden’ who may work office hours only.
- Buzzer system allows residents to summon help.
- Residents are usually able to wash, dress, transfer and mobilize independently (including wheelchair users) and prepare their own food.
- They may have the usual help from social services.
- Benefits those with physical disability.
- Newer schemes are being set up with staff on site 24 h to provide ‘extra care’ (for washing, dressing, meals, etc.), enabling much frailer residents to live there. There were around 20,000 places in 2005.
- Purpose-built developments may include components of ‘assistive technology’.
Institutional Care
In 2010 it was estimated that only 3.7% of people over 65 lived in institutions, but this rate rose rapidly with increasing age to 12% aged over 75 years and 20% over 85 years. The rate in the UK was higher than in many continental European countries, but is now similar (number of people 65+ in care: 319,937; total of 65+: 8,585,000 = 3.7%).
Institutionalization occurs when the person can no longer be supported at home within the resources available because of:
- severe physical disabilities;
- immobility;
- severe mental disability requiring constant supervision;
- unpredictable and frequent care needs.
This point is reached sooner if the person has a passive personality and there is no family support or even hostility to the person remaining at home.
Complications of institutionalization include:
- depersonalization;
- marked restriction of choices;
- accelerated dependence.
NB: All of these can be minimized by persistent effort by staff, visitors and sometimes the residents.
What Types of Institutions are There?
Long-Stay Hospitals
These have almost disappeared but have left a difficult legacy regarding who pays for care of this frailest group. Successive governments struggle with the NHS being ‘free at the point of delivery’, whereas care provided by social services is means-tested in England (free in Scotland). Thirty years ago, many elderly people spent their last months in a geriatric long-stay hospital. This care had its limitations, but was free to the patient. Long-stay hospitals were shut to save money; patients were placed in nursing homes, transferring some of the costs to the individuals. Geographical variation in the availability of long-stay NHS beds resulted in inequity.
NHS continuing care (NHS CC)
This was introduced to try to restore equity; individuals are assessed against criteria to determine whether they are entitled to free care for the remainder of their days. To qualify, an individual must have a ‘primary health need’, and the nature, complexity and unpredictability of their conditions are considered. A patient granted NHS CC is usually bed-bound with multiple problems needing regular skilled nursing, e.g. for pressure sores or tube feeding, unpredictable medical needs and a very short prognosis.
The assessment is in two stages: if the initial checklist is positive, a full assessment is done assessing 12 domains (behaviour, cognition, psychological needs, communication, mobility, nutrition, continence, skin integrity, breathing, medication and symptom control, altered consciousness and special factors). Geographical variation persists. The right of appeal is used quite often, as if you have to pay for a nursing home, you may have to sell your house rather than leaving it to your family. If the patient is granted NHS CC, the care can be provided at home, a nursing home or, occasionally, a hospital. A patient who is dying and wishes to die at home may be ‘fast tracked’ home with NHS CC. Scotland takes a fairer view, where the ‘personal care’ element is not separated from nursing care and is not means-tested.
Care Homes Providing Nursing Care
These are often still referred to as nursing homes. Most new residents are over 80, suffer from multiple disabilities (both physical, usually being chair/bed-bound, and mental) and need ‘hotel services’, help with personal hygiene and nursing care. Medical cover is provided by the resident’s general practitioner (GP). They may keep their GP if the home is local, but the move often results in a change of GP at a very vulnerable time. A registered nurse must be on duty 24 h a day. The weekly fee for a private nursing home bed is around £650.
Care Homes Providing Personal Care
These are often still referred to as residential homes. Residents need hotel services and help with personal hygiene and also have their own GP. Most of the staff are care assistants. On admission, a new client would usually be able to move from bed to chair and walk (with help as needed) to the communal dining and sitting areas. Nursing care, if needed for a short period, is usually provided by a district nurse. The average weekly fee for a private residential care home bed is around £500 (more for people with dementia, in London, etc.).
Residential homes and nursing homes are now all regulated by one authority, but the beds are registered for a specific client group. If a residential home resident becomes ill and is admitted to hospital, the home can refuse to take the resident back ‘as it can no longer meet their needs’, forcing the unfortunate individual to move again to a care home with nursing. This causes frustration as the resident may have been deteriorating for some time prior to admission; the wait for nursing home care increases length of hospital stay and the individual may deteriorate further or even die from nosocomial infection. This situation is better if the home has both nursing and personal care beds (‘dual registered’). There is a lot of variation in the flexibility of both homes and local authorities.
Specialist Homes for People with Dementia
It is relatively easy to maintain a physically disabled but cognitively intact person at home – if problems arise between care visits they can summon help. Whilst extra-care sheltered flats with assistive technology (see above) can provide a good care setting, the commonest reason for people to need 24-h care is dementia on top of physical problems. Therefore, most care homes will cope with a degree of dementia but have to be registered for this. If dementia is the main problem, in the form of wandering or disruptive behaviour, a specialist Dementia (elderly) or DE unit will be needed.
Who Provides Institutional Care?
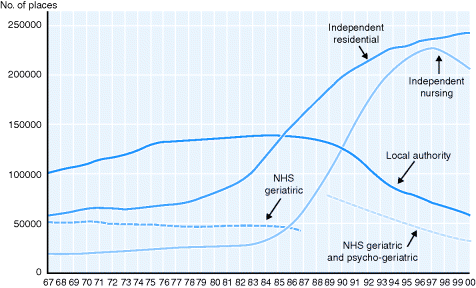
Care homes with nursing are mainly in the private sector. Care homes providing personal care were traditionally run by local authorities, but over 90% of beds are now provided by the private sector. There is some voluntary sector provision. The care home market is a difficult one. An initial rapid expansion in private beds has been followed by contraction. In England, since 2003 there has been a steady decline in the number of council-supported residents. In 2009, councils purchased just under half of all the registered places in care homes in England for older people (171,207 places), 43% of the beds with nursing for older people and 52% of the beds for older people needing personal care.
As more people are supported at home, patients entering institutional care are frailer and the costs outstrip the available funding. The major trends in bed provision are shown in Figure 2.10.
Figure 2.10 Long-term trends from 1967–2000 in the long-term care sector. (Adapted from Laing and Buisson.)
How is Institutional Care Paid for?
In England and Wales, if an older person has enough savings, they can enter a private or voluntary sector home of their choice if they meet its admission criteria. If a person needs state financial support, an assessment is carried out to see if they meet the criteria for care home admission and whether personal care or nursing care is appropriate. Then their financial situation is assessed. The individual has to contribute to the cost, ranging from forfeiting their allowances to paying the full amount for residential care if they have > £23,250 capital (2012–13). Residents must be left with a weekly personal allowance of £22.30. Owner-occupiers often have to sell to finance care unless a dependent relative continues to live in the house or insurance arrangements have been made; there is a ‘12 week disregard’ which gives a brief window when the council must ignore the value of a house to allow the property to be sold. In a nursing home, the ‘board and lodging’ and ‘personal care’ components are means-tested but the state contributes to the cost of nursing care regardless of means – the rate in 2012–13 is £108.70. An assessment for this must be done by an NHS employed registered nurse prior to placement.
In a locality, the commissioners (social services/Primary Care Trusts) have a benchmark price for a nursing bed and a residential bed and a list of ‘approved homes’. They may block purchase beds in a home. Approval is designed to improve standards but reduces choice, as does block-booking. Homes may be able to charge more in the private market so a social services client may only get a bed in the home of their choice if they or their family ‘top-up’ to pay the gap between the benchmark cost and the price the home wishes to charge. A NOP survey (Partnership 2010) showed that most people are aware that they are likely to live into their 80s and that many people will go into care (roughly 40%) but are over-optimistic in their expectation of how long for (5 years). The overall average is 2 years, but it is 4 years plus for self-funders and 1 in 10 will live 8 years in care. However, the majority have no realistic idea of how much it will cost.
In 2009, the annual average cost of residential care in the UK was estimated at nearly £25,000, with the cost for a nursing home at around £35,000. Care at home is also expensive; at an average of £17.30 per hour, 3 h of daily home care would amount to more than £18,000 per year (Laing and Buisson 2009).
In Scotland, people aged 65 or over who live in care homes and are assessed as self-funders receive a weekly payment of £149 (2008) for personal care and a further payment of £67 if they require nursing care; self-funders still pay for ‘hotel costs’.
Stay updated, free articles. Join our Telegram channel

Full access? Get Clinical Tree


