Screening tool, URL
Risk factors
Outputs
SCORE (Simple Calculated Risk Estimation Score) [19]
• Age, weight, previous fracture, estrogen use, rheumatoid arthritis, race
• Risk score for femoral neck T-scores ≤ −2.0
OST (Osteoporosis Self-Assessment Tool) [18]
• Age, weight
• Risk score for femoral neck T-scores ≤ −2.5
ORAI (Osteoporosis Risk Assessment Instrument) [17]
• Age, weight, current estrogen use
• Risk score for femoral neck T-scores ≤ −2.0
Prediction tool, URL
Risk factors
Outputs
FRAX (Fracture Risk Assessment Tool) [27], www.shef.ac.uk/FRAX
• Age, sex, BMI
• 10 year major osteoporotic fracture (clinical vertebrae, hip, forearm, proximal humerus)
• Prior fragility fracture, glucocorticoid use ≥3 months, secondary osteoporosis, rheumatoid arthritis, parental hip fracture, current cigarette smoking, alcohol intake of ≥3 units/day (yes/no)
• 10 year hip fracture
• Femoral neck BMD or T-score (optional)
• Age, sex
• 5 or 10 year any osteoporotic fracture (hip, clinical vertebrae, wrist, metacarpal, humerus, scapula, clavicle, distal femur, proximal tibia, patella, pelvis, and sternum)
• Number of fractures after age 50 (none, 0, 1, 2, ≥3)
• 5- or 10-year hip fracture
• Number of falls in the previous 12 months (none, 0, 1, 2, ≥3)
• Femoral neck BMD (or T-score) or weight (if BMD not entered)
• Age, sex, 10 ethnic origins
• 1–10 year osteoporotic fracture (clinical spine, hip, distal forearm, humerus fracture)
• Height, weight
• 1–10-year hip fracture
• Smoking (4 levels), alcohol intake (5 levels), diabetes (type 1, type 2), previous fracture, parental osteoporosis or hip fracture, living in a nursing or care home, history of falls, dementia, cancer, asthma/COPD, cardiovascular disease, chronic liver disease, chronic kidney disease, Parkinson’s disease, rheumatoid arthritis/SLE, malabsorption, endocrine problems, epilepsy or anticonvulsant use, antidepressant use, steroid use, HRT use
Simple Screening Tools
Tools developed to identify individuals with low BMD (e.g., SCORE, OST, ORAI [17–19]) do not provide a direct estimate of fracture probability, though some of these have also been shown to stratify fracture risk [20–23]. SCORE, ORAI, and OST have been validated as screening tools for BMD testing, and outperform a simple body weight criterion [24, 25]. In the review of Rubin et al. [10], none of the tools performed consistently better than others when tested in external validation studies, and simple tools with fewer risk factors (i.e., OST, ORAI) did as well as more complex tools with more risk factors (i.e., SCORE).
FRAX (www.shef.ac.uk/FRAX)
FRAX was developed by the WHO Collaborating Centre for Metabolic Bone Diseases to estimate an individual’s 10-year probability of major osteoporotic fracture (MOF, composite of clinical spine, hip, forearm, proximal humerus) and hip fracture [26]. The input variables were selected following a series of meta-analyses using data from nine prospective international population-based cohorts [27]. In addition to age, sex, and body mass index (BMI), additional clinical risk factors (CRFs) for fractures include prior fragility fracture, a parental history of hip fracture, prolonged use of glucocorticoids, rheumatoid arthritis, current cigarette smoking, alcohol intake of three or more units/day, and secondary osteoporosis (Fig. 3.1). Femoral neck BMD is an optional input that can refine the risk estimate, though even in its absence FRAX performs very well [28, 29]. Interactions among CRFs are also incorporated into the FRAX algorithm. More recently, specific adjustments were developed that can be applied to FRAX-derived risk scores to accommodate discordantly lower or higher lumbar spine BMD (more than 1 SD difference from femoral neck BMD) or glucocorticoid doses that are above or below average (average use defined as daily 2.5–7.5 mg prednisone-equivalent) [30, 31].
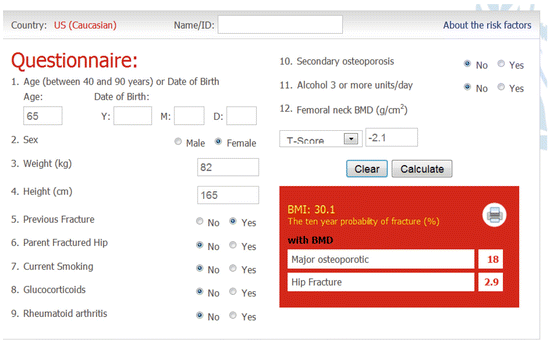

Fig. 3.1
Sample screenshot for FRAX® (US Caucasian tool). Ten-year probability for major osteoporotic fracture is 18 % and for hip fracture is 2.9 % in a woman age 65 years, weight 82 kg, height 165 cm, previous fracture, and femoral neck T-score −2.1. (Note that more than one fracture, type 2 diabetes or fall in the prior year does not affect the calculation)
In survival analysis, the time at which a subject experiences an event of interest may be altered by another event, known as competing risk events [32]. For fracture, competing death is particularly important to consider in order to produce unbiased estimates of fracture risk since, following death, fracture is no longer possible. FRAX adjusts for competing mortality, and this is unique among the risk prediction models. Individuals may have equivalent hazards for fracture but if they differ in terms of hazard for death then this will affect the 10-year fracture probability. For example, smoking is a risk factor for fracture but also increases the risk for death. Thus, the increased mortality associated with smoking reduces the importance of smoking as a risk factor for fracture. Ten-year major fracture probability tends to increase with age to peak around 80–85 years and then declines as the death hazard rises faster than the fracture hazard (Table 3.2). Failure to account for competing mortality has been shown to overestimate major fracture probability by 15–56 % and hip fracture probability by 17–36 % in those with high mortality [33].
Table 3.2
Relative change in fracture probability versus no other risk factors from type 1 diabetes, type 2 diabetes, and inflammatory arthropathy (rheumatoid arthritis or SLE) with QFracture®-2013 or from rheumatoid arthritis with FRAX
Age | 40 | 50 | 60 | 70 | 80 | 90 | Mean |
|---|---|---|---|---|---|---|---|
Women—major osteoporotic fractures | |||||||
QFracture—type 1 diabetes | 1.88 | 1.88 | 1.91 | 1.86 | 2.25 | 2.74 | 2.08 |
QFracture—type 2 diabetes | 1.25 | 1.25 | 1.28 | 1.25 | 1.25 | 1.24 | 1.25 |
QFracture—rheumatoid arthritis or SLE | 1.25 | 1.31 | 1.34 | 1.32 | 1.31 | 1.30 | 1.30 |
FRAX—rheumatoid arthritis (no BMD) | 1.35 | 1.35 | 1.37 | 1.36 | 1.41 | 1.45 | 1.38 |
FRAX—rheumatoid arthritis (T-score −2.5) | 1.33 | 1.32 | 1.35 | 1.29 | 1.29 | 1.29 | 1.31 |
Men—major osteoporotic fractures | |||||||
QFracture—type 1 diabetes | 2.20 | 2.33 | 2.30 | 2.61 | 3.38 | 3.34 | 2.69 |
QFracture—type 2 diabetes | 1.20 | 1.33 | 1.20 | 1.28 | 1.23 | 1.24 | 1.25 |
QFracture—rheumatoid arthritis or SLE | 1.40 | 1.50 | 1.50 | 1.56 | 1.54 | 1.52 | 1.50 |
FRAX—rheumatoid arthritis (no BMD) | 1.32 | 1.33 | 1.39 | 1.41 | 1.53 | 1.58 | 1.43 |
FRAX—rheumatoid arthritis (T-score −2.5) | 1.32 | 1.34 | 1.29 | 1.30 | 1.29 | 1.33 | 1.31 |
Women—hip fracture | |||||||
QFracture—type 1 diabetes | 4.83 | 4.36 | 4.13 | 3.73 | 4.27 | ||
QFracture—type 2 diabetes | 1.67 | 1.55 | 1.53 | 1.51 | 1.56 | ||
QFracture—rheumatoid arthritis or SLE | 1.83 | 1.64 | 1.65 | 1.61 | 1.68 | ||
FRAX—rheumatoid arthritis (no BMD) | 1.71 | 1.74 | 1.74 | 1.67 | 1.71 | ||
FRAX—rheumatoid arthritis (T-score −2.5) | 1.42 | 1.39 | 1.41 | 1.39 | 1.40 | ||
Men—hip fracture | |||||||
QFracture—type 1 diabetes | 5.33 | 4.70 | 4.55 | 4.24 | 4.71 | ||
QFracture—type 2 diabetes | 1.33 | 1.30 | 1.31 | 1.33 | 1.32 | ||
QFracture—rheumatoid arthritis or SLE | 2.00 | 1.90 | 1.86 | 1.86 | 1.90 | ||
FRAX—rheumatoid arthritis (no BMD) | 2.00 | 1.69 | 1.76 | 1.77 | 1.81 | ||
FRAX—rheumatoid arthritis (T-score −2.5) | 1.41 | 1.42 | 1.40 | 1.41 | 1.41 | ||
In recognition of the large international variability in fracture and mortality rates [34], population-specific FRAX tools are customized to the fracture and mortality epidemiology in a specific region, with the most recent version containing over 50 countries [26]. Minimum data requirements for constructing a new FRAX tool are sex and age-specific mortality and hip fracture rates (5 year subgroups). In many countries, such data are relatively easy to obtain. In contrast, non-hip fracture data considered by FRAX (clinical spine, distal forearm, proximal humerus) are difficult to accurately collect at the population level. Where high-quality data are not available, country-specific FRAX tools can be calibrated under the assumption that the ratio of these non-hip to hip fracture rates is similar to that observed in the Swedish population [35, 36]. Whether these ratios are applicable in all populations has been questioned, but currently they provide a valuable reference standard [37].
Fracture discrimination with FRAX was initially assessed in 9 primary derivation cohorts (46,340 subjects with 189,852 person years follow-up) and then in 11 additional validation cohorts (230,486 persons with 1,208,528 person years of follow-up) [38]. Risk stratification with FRAX including BMD was superior to FRAX without BMD or to BMD alone. In the primary derivation cohorts, the gradient of risk for hip fracture increased from 1.84 to 2.91 (area under the curve [AUC] from 0.67 to 0.78) with the inclusion of BMD, and for MOF increased from 1.55 to 1.61 (AUC from 0.62 to 0.63) with the inclusion of BMD. In the validation cohorts, the averaged hip fracture gradient of risk (1.83 without BMD and 2.52 with BMD) and AUC (0.66 without BMD and 0.74 with BMD) was similar to that of the derivation cohorts but the gradient of risk for other osteoporotic fractures (1.53 without BMD, 1.57 with BMD) and AUC (0.60 without BMD and 0.62 with BMD) was slightly lower.
A large number of studies have performed independent assessments of FRAX to predict subsequent fracture [16], but studies differ widely in their sample size, methodology (particularly incorporation of competing mortality risk) and techniques used to assess the performance of the fracture prediction tool (discrimination versus calibration), which can affect the validity of these validation studies [39]. As a general rule, these studies confirm the validity of FRAX for fracture risk assessment but highlight the importance of using high-quality fracture data to ensure accurate calibration of the FRAX tool.
Garvan Fracture Risk Calculator (www.garvan.org.au/bone-fracture-risk)
The Dubbo Osteoporosis Epidemiology Study (DOES) was initiated in 1989 and involves follow-up of over 3500 participants. Using information on 426 clinical fractures in women (96 hip) and 149 clinical fractures in men (31 hip) excluding digits, 5- and 10-year fracture probability nomograms were constructed [40, 41]. Inputs include age, sex, femoral neck BMD (optional), history of prior fractures after age 50 years (none, 0, 1, 2, 3, or more) and history of falls in the previous 12 months (none, 0, 1, 2, 3, or more) (Fig. 3.2). If femoral neck BMD is not available, then weight is used as a proxy. Risk factors that are relatively uncommon in the general population (e.g., glucocorticoid use and specific medical conditions) are not included. The model has only been calibrated for the Australian population and does not include an explicit competing mortality risk adjustment. However, the algorithm has been independently validated in one North American population of women and men [42].
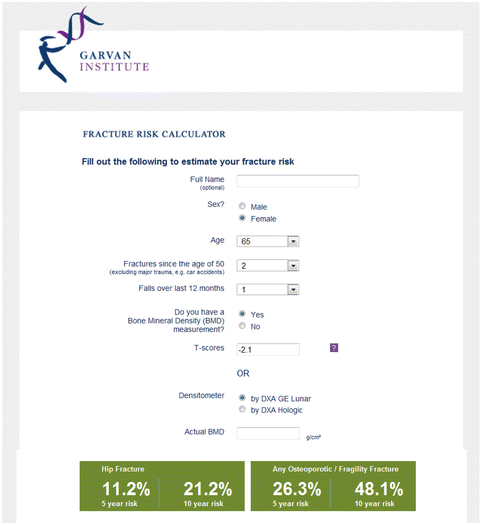

Fig. 3.2
Sample screenshot for Garvan fracture risk calculator. Ten-year probability for major osteoporotic fracture is 53.7 % and for hip fracture is 28.4 % in a woman age 65 years, two previous fractures, one previous fall, and femoral neck T-score −2.1. (Note that weight 82 kg, height 165 cm, and type 2 diabetes does not affect the calculation)
QFracture (www.qfracture.org)
The largest prospective database for osteoporotic fracture prediction is from England and Wales using patients from 357 general practices for derivation and patients from 178 practices for validation in the initial analysis (QResearch Database) [43]. This provided more than one million women and more than one million men age 30–85 years in the derivation cohort with 24,350 incident osteoporotic fractures in women (9302 hip fractures) and 7934 osteoporotic fractures in men (5424 hip fractures). The risk calculator includes numerous CRFs, but not BMD (Fig. 3.3). It provides outputs of any osteoporotic fracture (hip, wrist, or spine) and hip fracture over a user selected follow-up period from 1 year to 10 years. The QFracture algorithm was updated in 2012, with inclusion of a number of new CRFs, removal of several others, and the addition of humerus fractures as one of the osteoporotic fractures [44]. In addition to age, sex, and ethnicity (10 different ethnic origins) the algorithm includes smoking status (4 levels), alcohol consumption (5 levels), diabetes (2 levels, T1DM or T2DM), previous fracture, parental osteoporosis or hip fracture, living in a nursing or care home, history of falls, dementia, cancer, asthma/COPD, cardiovascular disease, chronic liver disease, chronic kidney disease, Parkinson’s disease, rheumatoid arthritis/SLE, malabsorption, endocrine problems, epilepsy or anticonvulsant use, antidepressant use, steroid use, HRT use, height, and weight.
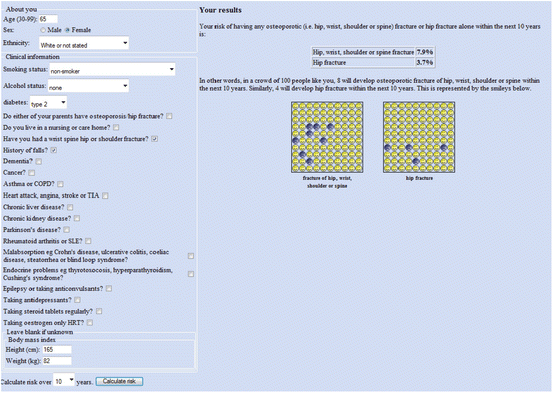

Fig. 3.3
Sample screenshot for QFracture®-2013 risk calculator. Ten-year probability for major osteoporotic fracture is 7.9 % and for hip fracture is 3.7 % in a White woman age 65 years, weight 82 kg, height 165 cm, type 2 diabetes, previous fracture, history of falls. (Note that more than one fracture, and femoral neck T-score does not affect the calculation)
The 2012 version reported very good performance for osteoporotic fracture prediction (AUC 0.79 in women and 0.71 in men) and excellent performance for hip fracture prediction (AUC 0.89 in women and 0.88 in men). An independent validation study was performed using patients from 364 general practices in the UK Health Improvement Network (THIN) database (2.2 million adults aged 30–85 years with 25,208 osteoporotic and 12,188 hip fractures) [45]. The validation cohort gave AUC discrimination for osteoporotic fracture of 0.82 in women and 0.74 in men, and for hip fracture of 0.89 in women and 0.86 in men. Calibration plots adhered closely to the line of identity. QFracture explained 63 % of the variation in hip fracture risk in women and 60 % of the variation in men (49 and 38 % for osteoporotic fracture risk).
A small retrospective comparison of FRAX and QFracture was conducted in 246 postmenopausal women aged 50–85 years with recent low trauma fracture and 338 nonfracture control women from six centers in Ireland and the UK [46]. AUC for fracture discrimination were similar in QFracture and FRAX (0.668 versus 0.665) and also for hip fractures (0.637 versus 0.710). The striking difference with AUC measures from the THIN database validation study is unexplained. The broad age range used in the initial validation work may have inflated the performance measures since osteoporotic fractures are unlikely before age 50, and additional assessments of QFracture in older women and men are needed.
Risk Factors for Fracture in Diabetes
General Risk Factors
Individual risk factors for fracture in individuals with diabetes can be divided into those that are applicable to the general population and those that are specific to diabetes. Most of the risk factors for osteoporotic fractures that apply to the general population, particularly those that are included in the most common risk assessment tools (Table 3.1), have been shown to predict fracture in individuals with diabetes [47]. For example, older age, lower BMI and previous osteoporotic fracture help to identify patients with diabetes who are at greater fracture risk [47]. BMD measurement from DXA provides a robust estimate of fracture risk, increasing 1.4–2.6 fold for every SD decrease in BMD in the general population [48, 49] and in those with diabetes [47]. Two reports from the population-based clinical BMD repository for Manitoba, Canada, have examined whether individual risk factors behave the same in those with and without diabetes, or whether there is effect moderation (interaction) [47, 50]. For MOF, no significant effect moderation was observed for FRAX clinical risk factors. Prior fracture was examined in relation to fracture site, and also behaved similarly in those with and without diabetes. Prior vertebral fracture was associated with the highest risk for subsequent MOF, while prior ankle fracture (which is common in individuals with diabetes) was not associated with an increased risk for subsequent fracture. Age was a significant effect modifier for hip fracture risk, however. Specifically, younger individuals with diabetes were at much higher risk for hip fracture than were those of similar age without diabetes and this difference narrowed with age (adjusted hazard ratio age <60 years: 4.67 [95 % CI 2.76–7.89], age 60–69 years: 2.68 [1.77–4.04], age 70–79 years: 1.57 [1.20–2.04], age ≥80 years: 1.42 [1.10–1.99]; P-interaction <0.001). Unfortunately, this study was unable to distinguish T1DM and T2DM which differ substantially in their pathophysiology as reviewed in previous chapters. Other studies have noted much higher risk for T1DM than T2DM which would be expected to be relatively more prevalent in younger versus older diabetic [1, 2].
Obesity
It is impossible to overlook the parallel between the BMD-fracture paradox in T2DM and in obesity, and implications for fracture risk assessment. Historically, obesity has been considered a protective factor for osteoporosis but recent observations have called this into question based upon reports that obesity can be protective, neutral, or a risk factor for osteoporosis and related fractures [51–54]. Mechanisms whereby obesity might be associated with fractures are poorly defined but potentially include: biomechanical effects (increased skeletal loading), metabolic changes (fat-derived adipocytokines, inflammatory mediators), and statistical (failure to adequately consider variable collinearity, differential effects of lean versus fat mass) [54–57]. For some sites (particularly the upper arm), obesity appears to be a risk factor for some fractures even after adjustment for higher BMD [52, 58]. A recent meta-analysis examined the association between BMI and fracture risk in prospective cohorts from 25 countries (398,610 women average age 63 years, 2.2 million person-years follow-up) with a reported 22 % prevalence of obesity [58]. Risk for MOF and hip fractures decreased monotonically with increasing BMI when the modifying effect of BMD was excluded. When BMD was considered, the effect of BMI was greatly reduced and, at least for MOF, showed a biphasic response such that fracture risk decreased as BMI increased to the normal range and then slightly increased for overweight and obese individuals. Obese women were at lower risk for MOF when BMD was not considered (hazard ratio 0.87 for BMI 35 kg/m2 versus 25 kg/m2) but at higher risk when BMD was considered (HR 1.16). Obesity was still protective against hip fractures, even when adjusted for higher BMD, possibly reflecting energy absorption from soft tissue padding [59].
However, weight associations become more complicated when separated into their lean mass and fat mass components. BMI does not distinguish the very different skeletal effects from lean versus fat tissue where significant nonlinearities have been observed. Most studies find that lean mass is positively associated with higher BMD, whereas fat mass shows neutral or negative effects though there are exceptions to this generalization and a dual (biphasic) effect has even been reported [57, 60]. A meta-analysis found that among premenopausal women lean mass exerted a greater effect on femoral neck BMD than fat mass (r = 0.45 versus r = 0.30), whereas in postmenopausal women the effects of lean mass and fat mass were similar (r = 0.33 versus r = 0.31) [57]. A recent population-based study found that the effect of BMI on fracture risk was largely mediated by its effect on BMD, with little if any direct effect of BMI on fracture risk [61]. This awaits confirmation in additional larger studies where the mediating effects of other body composition variables can be studied.
Biomechanical models have not yet been incorporated into fracture prediction tools. Based upon engineering principles, such as beam theory, these have the potential to incorporate the opposing effects of greater BMD (protective) versus increased skeletal loading from falls (risk factor) that occur during specific fall configurations (boundary conditions). Melton et al. [62] compared estimated bone load to bone strength ratios in 49 T2DM patients to age and sex-matched controls. Hip BMD from DXA was greater in diabetic subjects due to greater trabecular volumetric BMD (vBMD) while cortical vBMD was similar. Derived bone strength measures were generally better in diabetic subjects, but bone loads were higher from their greater weight, such that load to strength ratios (i.e., factor-of-risk) were similar. A subsequent analysis of older men with (n = 190) and without (n = 981) T2DM found that although patients with T2DM had lower bone bending strength at the mostly cortical bone midshaft sites of the radius and tibia after adjusting for body weight (−2 to −5 %, p < 0.05) despite the lack of difference in cortical vBMD at these sites. Indices of femoral neck strength in diabetic versus nondiabetic women (adjusted for age, race/ethnicity, menopausal stage, body mass index, smoking, physical activity, calcium and vitamin D supplementation, and study site) showed lower composite strength indices for compression, bending, or impact despite higher femoral neck BMD [63]. Furthermore, there was an inverse relationship between insulin resistance (homeostasis model) and all three strength indices. These studies suggest that patients with T2DM do not benefit from elevated BMD in terms of improved bone load to strength ratios. However, these predictions may not always align with clinical observations. In a large registry-based cohort (40,050 women and 3600 men), the femoral strength index (FSI) showed a progressive decline with increasing fat mass index but did not improve fracture prediction over conventional FRAX probability measurements [56]. The FSI does not consider soft tissue padding effects, which may significantly attenuate the fracture risk relationship [59]. Additional work is needed to evaluate these indices derived from biomechanical principles in individuals with obesity and diabetes.
Importantly, some measure of body size (weight or body mass index [BMI]) is included in each of the systems summarized in Table 3.1. Given that obesity strongly predisposes to T2DM, one would anticipate that these tools would be insensitive to the effect of T2DM and would underestimate risk. A demonstration of the differing approaches to including BMI (or weight equivalent) on fracture risk assessment is illustrated in Fig. 3.4. When BMD is not included, FRAX predicts a linear decrease in fracture probability with increasing BMI. A similar relationship is seen with the Garvan FRC (which uses weight when BMD is not available) and QFracture risk (which does not have a BMD input). When BMD is included in the FRAX calculation, BMI has a very different relationship such that fracture probability increases with greater BMI up to 25 kg/m2, and subsequently declines. The lower fracture probability for individuals with BMI much less than 25 kg/m2 likely relates to the effect of competing mortality since underweight is associated with a higher likelihood of death from comorbid conditions. The protective effect of BMI in the overweight and obese range that is independent of BMD may reflect soft tissue padding [59].
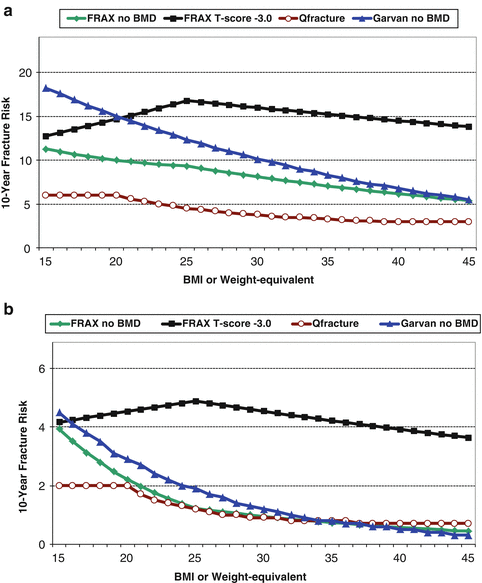

Fig. 3.4
Effect of increasing body mass index (BMI) or weight-equivalent (height 165 cm) on fracture predictions from US White FRAX (with and without BMD), Garvan FRC (without BMD), and QFracture®-2013 (without BMD) for a 65-year-old woman with T-score −3.0 and no other risk factors. (a) Non-hip fractures (MOF for FRAX and QFracture®-2013, any fracture for Garvan FRC). (b) Hip fractures
Together, the foregoing observations challenge conventional concepts of weight as a risk factor for osteoporosis and fractures, and beg the question of why something that is associated with preserved BMD would be a risk factor for fracture. Potential explanations include greater falls risk, adverse changes on skeletal biomechanics, alterations in energy homeostasis, inflammation, insulin resistance, overt T2DM or their associated treatments and comorbidities are potential contributors [52, 64]. Despite these questions, lean and fat tissue mass indices did not have an independent effect on MOF or hip fracture risk when adjusted for FRAX scores [56]. Of potential relevance to T2DM, Premaor et al. [65] examined the question of whether FRAX was applicable to obese older women using 6049 white women from the US Study of Osteoporotic Fractures (SOF) cohort. Fracture discrimination from AUC was similar in obese and nonobese women. Calibration was good in both groups for prediction of MOF using FRAX with BMD, but hip fracture risk was found to be underestimated, most markedly among obese women in the lowest category for FRAX probability with BMD (though based on only four predicted versus nine observed hip fractures).
Stay updated, free articles. Join our Telegram channel

Full access? Get Clinical Tree


