Fig. 11.1
HR-pQCT. (a) Demonstrates the correct patient positioning for a lower extremity scan. The patient’s lower extremity is immobilized through a carbon fiber cast and is anchored in the scanner to minimize motion. For each scan, the effective patient dose amounts to approximately 3 microSv. Average time per scan is 2.8 min. (b) Displays a representative mid-stack HR-pQCT image of the lower extremity cross section in a healthy patient
Using HR-pQCT, three studies investigated bone architecture in patients with and without diabetes [9, 10, 19]. Shu et al. [19] analyzed a cohort of 14 T2DM postmenopausal women and 14 control postmenopausal women. Standard trabecular and cortical bone parameters were calculated from the HR-pQCT images, which included cortical thickness and density but not cortical porosity. None of the investigated parameters showed significant differences. It should be noted that information on fragility fractures in this cohort was not available.
Burghardt et al. [9] applied HR-pQCT to characterize cortical and trabecular microarchitecture and biomechanics in the peripheral skeleton of female patients with T2DM using a cross-sectional study design. Elderly female patients (age, 62.9 ± 7.7 years) with a history of T2DM (n = 19) and age- and height-matched controls (n = 19) were recruited and imaged using HR-pQCT at the distal radius and tibia. The T2DM cohort included patients with and without fragility fractures. Quantitative measures of volumetric (BMD), cross-sectional geometry, trabecular and cortical microarchitecture were calculated. Additionally, compressive mechanical properties were determined by microfinite element analysis. These investigators found that compared to the controls, the T2DM cohort had 10 % higher trabecular volumetric BMD (P < 0.05) adjacent to the cortex and higher trabecular thickness in the tibia (13.8 %; P < 0.05). Cortical porosity differences, however, were consistent with impaired bone strength in T2DM patients and were significant in the radius (> +50 %; P < 0.05), whereas pore volume approached significance in the tibia (+118 %; P = 0.1). They concluded that, in T2DM patients, the impaired resistance to bending loads may be due to inefficient redistribution of bone mass, characterized by loss of intracortical bone offset by an elevation in trabecular bone density. These results may provide a potential explanation for the inability of standard BMD measures to explain the elevated fracture incidence in patients with T2DM.
In a more recent study comparing T2DM postmenopausal women and age-matched control women differences were found in cortical porosity at the distal radius and tibia between T2DM patients with and without fragility fractures [10]. This study provided evidence for the key importance of cortical abnormalities in the increased prevalence of fragility fractures in T2DM patients and the potential role of HR-pQCT as a novel diagnostic imaging test measuring cortical porosity. For this study 80 women (mean age 61.3 ± 5.7 years) were recruited into four groups (n = 20 per group) with and without diabetes and with and without fragility fractures. Participants underwent DXA and HR-pQCT of the ultradistal and distal radius and tibia. In the HR-pQCT images volumetric bone mineral density, cortical and trabecular structure measures, including cortical porosity, were calculated. Bone strength was estimated using microfinite element analysis (microFEA). At the ultradistal and distal tibia, women with diabetic fractures had substantially greater intracortical pore volume (+52.6 %, p = 0.009; +95.4 %, p = 0.020), relative porosity (+58.1 %; p = 0.005; +87.9 %, p = 0.011) and endocortical bone surface (+10.9 %, p = 0.031; +11.5 %, 0.019) compared to diabetic women without fracture. At the distal radius T2DM women with fractures had a 4.7-fold greater relative porosity (p < 0.01) than women without fractures. At the ultradistal radius, intracortical pore volume was significantly higher in T2DM women with fractures compared to those without fractures (+67.8 %, p = 0.018). T2DM women with fractures also displayed larger trabecular heterogeneity (ultradistal radius; +36.8 %, p = 0.035), and lower total and cortical BMD (ultradistal tibia: −12.6 %, p = 0.031; −6.8 %, p = 0.011) than women without fractures. T2DM women with fractures also exhibited significantly higher pore-related deficits in stiffness, failure load and cortical load fraction at the ultradistal and distal tibia, and the distal radius than women with diabetes and no fractures. Figure 11.2 illustrates the findings of increased cortical porosity in a woman with type 2 diabetes and fragility fracture in relation to a diabetic woman without fracture. Interestingly, comparing nondiabetic fracture and control women, only a nonsignificant trend was found with increase in pore volume (+38.9 %, p = 0.060) at the ultradistal radius. Overall, similar to the previous study, the results of this study suggested that severe deficits in cortical bone quality may be responsible for fragility fractures in postmenopausal diabetic women.
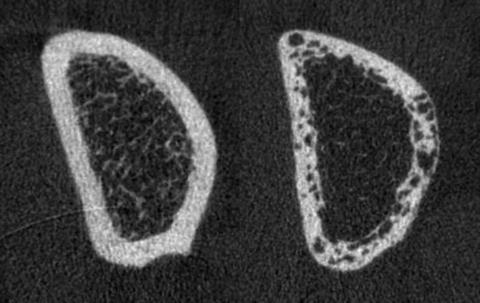
Fig. 11.2
Representative HR-pQCT images of the distal radius in Type 2 diabetic postmenopausal women with and without fragility fracture. Shown are the mid-stack tomograms for a Type 2 diabetic postmenopausal woman without history of fragility fracture (left) and a Type 2 diabetic woman with a positive history of fragility fracture (right). Note significant differences in cortical porosity between the 2 patients
Magnetic Resonance Based Techniques
A small number of recent studies used magnetic resonance based techniques to investigate bone architecture and bone marrow composition in patients with diabetes [11–13]. Magnetic resonance spectroscopy (MRS) provides information on the biochemical composition of tissues and Li et al. introduced a method to quantify vertebral bone marrow adiposity with proton MR spectroscopy ((1)H-MRS) at 3 T [20]. In their study, they showed high reproducibility of the technique with an average coefficient of variation of vertebral marrow fat content quantification of 1.7 %. They showed variation of marrow adiposity at different vertebral levels and feasibility for identifying patients with low bone density. In addition to quantifying overall bone marrow fat at 3 T, they were also able to selectively quantify the unsaturation level of the bone marrow fat [21].
Specifically using this technology in patients with T2DM, it was shown that vertebral bone marrow fat content correlated significantly with HbA1c and visceral adipose tissue in T2DM patients [22] and that decreased unsaturated bone marrow lipids were found to be associated with T2DM and fragility fractures [10]. Baum et al. [22] compared vertebral bone marrow fat content quantified with proton MR spectroscopy ((1)H-MRS) with the volume of abdominal adipose tissue, lumbar spine volumetric bone mineral density (vBMD), and blood biomarkers in postmenopausal women with and without T2DM. Thirteen postmenopausal women with T2DM and 13 age- and body mass index-matched healthy controls were included in this study. All subjects underwent (1)H-MRS of L1–L3 to quantify vertebral bone marrow fat content (FC) and unsaturated lipid fraction. QCT was performed to assess vBMD of L1–L3. The volumes of abdominal subcutaneous (SAT), visceral (VAT) and total adipose tissue (TAT) were determined from the QCT images and adjusted for abdominal body volume (SAT(adj)/VAT(adj)/TAT(adj)). Fasting blood tests were also obtained and included plasma glucose and HbA1c. Mean FC showed an inverse correlation with vBMD (r = −0.452; P < 0.05) in the whole study population. While mean FC was similar in the diabetic women and healthy controls (69.3 ± 7.5 % vs. 67.5 ± 6.1 %; P > 0.05), mean unsaturated lipid fraction was significantly lower in the diabetic group (6.7 ± 1.0 % vs. 7.9 ± 1.6 %; P < 0.05). SAT(adj) and TAT(adj) correlated significantly with mean FC in the whole study population (r = 0.538 and r = 0.466; P < 0.05). In contrast to the control group, significant correlations of mean FC with VAT(adj) and HbA1c were observed in the diabetic group (r = 0.642 and r = 0.825; P < 0.05). This study demonstrated that vertebral bone marrow fat content correlates significantly with SAT(adj), TAT(adj), and lumbar spine vBMD in postmenopausal women with and without T2DM, but with VAT(adj) and HbA1c only in women with T2DM.
Patsch et al. [11] quantified vertebral bone marrow fat content and composition in diabetic and nondiabetic postmenopausal women with fragility fractures and compared these measurements with those of non-fracture controls with and without type 2 diabetes mellitus. Sixty-nine postmenopausal women (mean age 63 ± 5 years) were recruited. Thirty-six patients had spinal and/or peripheral fragility fractures. Seventeen of the fracture patients were diabetic. Thirty-three women were controls without fractures and 16 of these were diabetic. To quantify vertebral bone marrow fat content and composition, patients underwent MR spectroscopy (MRS) of the lumbar spine at 3 T. BMD was determined by DXA of the hip and lumbar spine and QCT of the lumbar spine. To evaluate associations of vertebral marrow fat content and composition with spinal and/or peripheral fragility fractures and diabetes, linear regression models adjusted for age, race, and spine volumetric bone mineral density (vBMD) by QCT were used. At the lumbar spine, nondiabetic and diabetic fracture patients had lower vBMD than controls and diabetics without fractures (p = 0.018; p = 0.005). However, areal bone mineral density (aBMD) by DXA did not differ between fracture and non-fracture patients. After adjustment for age, race, and spinal vBMD, the prevalence of fragility fractures was associated with −1.7 % lower unsaturation levels (confidence interval [CI] −2.8 to −0.5 %, p = 0.005) and +2.9 % higher saturation levels (CI 0.5–5.3 %, p = 0.017). Diabetes was associated with −1.3 % (CI −2.3 to −0.2 %, p = 0.018) lower unsaturation and +3.3 % (CI 1.1–5.4 %, p = 0.004) higher saturation levels. Diabetics with fractures had the lowest marrow unsaturation and highest saturation levels. In summary, these results demonstrate that altered bone marrow fat composition (lower unsaturation level) is linked with fragility fractures and diabetes. The authors suggested that MRS of spinal bone marrow fat may therefore serve as a novel tool for BMD-independent fracture risk assessment.
In addition to using magnetic resonance based spectroscopy for quantifying tissue composition, magnetic resonance imaging (MRI) can also be used to assess trabecular bone quality. A number of previous studies have shown that high-resolution MRI can directly visualize trabecular bone architecture at the distal radius, tibia, and proximal femur [23–26] (Fig. 11.3). Pritchard et al. were the first to use high-resolution MRI of the distal radius to compare trabecular bone microarchitecture of postmenopausal women with and without type 2 DM [13]. They acquired axial images with a 1 T MRI system and a voxel size of 0.195 × 0.195 × 1 mm3. Image post-processing included geometric, topologic, and stereologic measures including number and size of trabecular bone network holes (marrow spaces), endosteal area, trabecular bone volume fraction, nodal and branch density, and apparent trabecular thickness, separation, and number. They also measured lumbar spine and proximal femur BMD with DXA. They found that T2DM women (n = 30, mean ± SD age 71.0 ± 4.8 years) had larger holes (+13.3 %; P = 0.001) within the trabecular bone network than women without T2DM (n = 30, mean ± SD age 70.7 ± 4.9 years). Interestingly after adjustment for body mass index, DXA-based lumbar spine BMD did not differ between the diabetes and nondiabetes groups. They concluded that in women with type 2 DM, the average hole size within the trabecular bone network at the distal radius is greater compared to controls and hypothesized that this may explain the elevated fracture risk in women with T2DM.
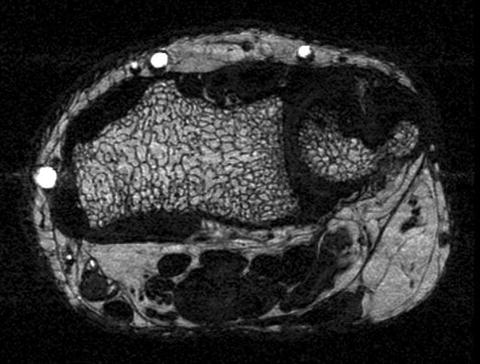
Fig. 11.3
High resolution axial 3 T Magnetic Resonance Image of the distal radius obtained with a 3D steady state free precession sequence with a spatial resolution of 156 μm × 208 μm × 500 μm. The image shows trabecular bone architecture with bone marrow interlay
These investigators also performed follow-up MR studies in a subset of their patients [12]. The aim of this study was to compare 2-year changes in trabecular bone microarchitecture in women with and without T2DM. Using the same technology as in the other study, they analyzed the number and size of trabecular bone holes, bone volume fraction (BV/TV), trabecular thickness (Tb.Th), number (Tb.N) and separation (Tb.Sp), endosteal area, nodal and branch density in 37 women. After adjustment for ethnicity, women with diabetes had a higher percent increase in number of trabecular bone holes compared to controls (10[1] % vs. −7[2] %, p = 0.010), however, results were no longer significant after adjustment for multiple comparisons (p = 0.090). There were also no differences in the change of the other trabecular bone microarchitecture variables between the two groups. This study provides feasibility data but clearly larger longitudinal studies with longer time intervals are required to study the evolution of T2DM-related bone architecture changes.
Related posts:

Stay updated, free articles. Join our Telegram channel

Full access? Get Clinical Tree


