Epidemiology of Renal Cell Carcinoma


Epidemiology of Renal Cell Carcinoma


Wong-Ho Chow

Linda M. Dong

Susan S. Devesa


Malignant tumors of the kidney and renal pelvis account for nearly 4% of cancer cases and over 2% of cancer deaths in the United States, with 58,240 new cases and 13,040 deaths having been estimated for 2010 (1). Of the kidney cancers diagnosed during 2002 to 2006 with microscopic confirmation reported to the US Surveillance, Epidemiology, and End Results (SEER) program (2), 92% were adenocarcinomas arising from the renal parenchyma (renal cell carcinoma [RCC]); renal pelvis cancers, mostly of the transitional cell type, comprised 8% of the microscopically confirmed cancers (3). A vast majority of RCC is of the clear cell subtype, followed by the papillary (11%) and chromophobe (5%) subtypes.

The etiology of renal carcinomas varies by subsite of origin. Cigarette smoking and phenacetin-containing analgesics, now withdrawn from most markets worldwide, are the major determinants of renal pelvis cancer (4,5), whereas risk factors for RCC are more diverse. This chapter focuses on RCC.


DESCRIPTIVE EPIDEMIOLOGY


Incidence Patterns

We used population-based incidence data from the 13 SEER registries to calculate age-adjusted (2000 US standard) incidence rates per 100,000 person-years of RCC during 2002 to 2006 among whites (non-Hispanic), Hispanics (white), blacks (African American), Asians (including Pacific Islander), and Natives (American Indian/Alaskan) (6,7). The rates among men and women were 14.5 and 7.4 among whites and 16.6 and 7.8 among blacks, respectively (Table 38.1). Both Hispanic and non-Hispanic whites had similar rates. Incidence rates were highest among Natives and lowest among Asians, although the numbers of RCC cases in these minority populations were relatively small. Rates among men were about twice the rates among women for whites, blacks, and Asian, but 86% higher for Hispanics. The RCC rate among Native women was notably high, resulting in a male excess of only 47%, much lower than that in other populations.


TABLE 38.1 AGE-ADJUSTED INCIDENCE RATESa OF RCC BY GENDER AND RACE/ETHNICITY, SEER 13b, 2002-2006


Total


Male


Female


Male-to-Female Rate Ratio


Race/Ethnicity


Number


Rate


Number


Rate


Number


Rate


White


16,113


10.7


10,164


14.5


5,949


7.4


1.96


Non-Hispanic


13,732


10.7


8,708


14.5


5,024


7.4


1.96


Hispanic


2,381


10.7


1,456


14.3


925


7.7


1.86


Black


2,079


11.6


1,299


16.6


780


7.8


2.13


Native (Indian/Alaskan)c


208


15.6


114


19.0


94


12.9


1.47


Asian/Pacific Islander


1,271


5.7


799


8.0


472


3.9


2.05


aRates are per 100,000 person-years, age-adjusted to the 2000 US Standard Population (19 age-groups); microscopically confirmed cases only.


bSEER program 13 registries, supported by the National Cancer Institute.

c CHSDA counties only.


Incidence rates of RCC increased consistently with age and peaked around the age of 70 years for both men and women (Fig. 38.1). Among men, the age-specific rates were generally comparable across all racial/ethnic groups except for the consistently low rates among Asians. Among women, rates were higher in Natives and lower in Asians than the other groups across all ages.

Kidney cancer incidence rates vary substantially worldwide, driven predominantly by RCC rates (Fig. 38.2) (8). The highest rates were reported in Central Europe and North America. There were greater variations in incidence rates across countries in Europe than across racial/ethnic subgroups in the United States and Canada. A notable exception was the low rates among Asians in the United States, which is consistent with the low rates among Asians in their countries of origin. In contrast, despite the relatively high incidence of this cancer among Hispanics in the United States, low rates were reported in Central and South America.


Time Trends

Total kidney cancer incidence rates have been reported recently to show signs of leveling or declining since the mid-1990s in many countries worldwide, following notable increases during earlier years (3,9). In the United States, where long-term incidence data are available for subtype of kidney cancer (10), RCC incidence rates have continued to rise for over three decades while rates for renal pelvis cancer have declined (
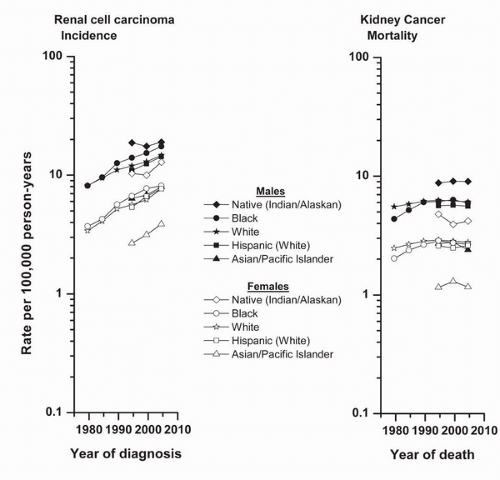
11). Rising incidence rates were apparent among white and black men and women during 1977 to 2006, and among men and women of other minority racial/ethnic groups during 1992 to 2006 when data were available for Hispanics, Asians, and Natives (Fig. 38.3). During 1992 to 2006, the most rapid increases in men occurred among Hispanics (31.1%), and in women, among Asians (44.9%) followed by Hispanics (43.1%). Of note, incidence rates for Native women approach those for white and Hispanic men, whereas rates for Asian men are comparable to those for non-Asian women. Increases in total kidney cancer mortality rates were less rapid than those for RCC incidence, and rates have leveled across all racial/ethnic groups in the United States since the early 1990s (12). These changing mortality trends are consistent with downward trends already reported in some countries in the European Union (9).


FIGURE 38.1. Age-specific RCC incidence rates by racial/ethnic group and gender, SEER 13, 1992-2006.


FIGURE 38.2. International variation in total kidney cancer, RCC, and transitional cell carcinoma: age-adjusted (world standard) incidence by continent, registry, and gender, 1998-2002. (From Curado MP, Edwards B, Shin HR, et al., eds. Cancer incidence in five continents, Vol. IX, IARC Scientific Publications No. 160, Lyon: IARC, 2007, with permission.)


FIGURE 38.3. Age-adjusted (2000 US standard) incidence rates for RCC among blacks and whites in SEER 9 1977-1981 to 2002-2006 and among Hispanic whites, Asian/Pacific Islanders, and American Indian/Alaskan Natives in SEER 13 1992-1996 to 2002-2006 (left panel) and US mortality rates for total kidney cancer for the same racial/ethnic groups and time periods, by gender (right panel).

The rising RCC incidence rates over time in the United States occurred across all adult age-groups among both blacks and whites during 1977 to 2006 (10) (Fig. 38.4). According to stage at diagnosis, increases were seen mainly for localized cancers. There is little evidence of upward trends in rates for more advanced tumors, including those of regional and distant stage, or unstaged. Tumor size at diagnosis has been available in the SEER data since 1983 (2). Contrary to the pattern for stage at diagnosis, rates increased for cancers of all sizes during 1992 to 2006, except for tumors with unknown size. By far, the most rapidly rising rates were for cancers <2.0 cm, suggesting that heightened clinical surveillance or improved diagnostic capabilities might have contributed to the detection of these small tumors. The temporal patterns by age-groups, stage at diagnosis, and tumor size were similar for all other minority groups (data not shown in figure).


Stage at Diagnosis and Survival

Consistent with the temporal incidence trends, the proportion of RCCs that were diagnosed at a localized stage has increased (Table 38.2) (10). Overall, 61% of the RCCs among whites diagnosed in the SEER program from 1992 to 2005 were localized cancers, compared with 48% of those diagnosed during 1977 to 1991. The corresponding percentages of localized cancers among blacks were higher, 67% and 54%, respectively. Within each racial group, the improvement in stage at diagnosis was comparable for men and women (not shown in table).

The overall 5-year relative survival rate, which is the percentage of patients diagnosed with renal cell cancer who survived 5 years after diagnosis, adjusting for the expected survival experience of the comparable population, has improved over time (Table 38.2) (13). Between the periods 1977 to 1991 and 1992 to 2005, the overall 5-year relative survival rates increased from 60% to 72% among whites and from 59% to 68% among blacks. The improvement in survival for patients with localized or regional cancers was more substantial among whites than blacks. Survival for patients with distant tumors increased slightly for whites, but declined slightly for blacks during these periods.

Relative survival rates among renal cell cancer patients continued to fall even up to 10 years after diagnosis (Fig. 38.5) (13). The decline in survival for patients diagnosed with localized cancers tended to be linear over time, whereas for patients with more advanced tumors, rates decreased more rapidly during the earlier months following diagnosis. The long-term survival tended to be poorer among blacks than whites regardless of tumor stage at diagnosis. The racial disparities in survival across tumor stages explain, to some extent, the overall lower relative survival rates among blacks than among whites, despite the higher percentage of blacks with localized cancers.


FIGURE 38.4. Age-adjusted (2000 US standard) incidence rates for RCC among blacks and whites by age and stage at diagnosis (1977-1981 to 2002-2006) and tumor size at diagnosis (1992-1996 to 2002-2006), SEER 9.


TABLE 38.2 RELATIVE 5-YEAR SURVIVAL RATES (%) FOR PATIENTS DIAGNOSED WITH RCC BY STAGE AT DIAGNOSIS, RACE, AND YEAR OF DIAGNOSIS, SEER 9a, 1977-2005


White


Black


1977-1991


1992-2005


1977-1991


1992-2005


Stage at Diagnosis


Number


Rate (%)


Number


Rate (%)


Number


Rate (%)


Number


Rate (%)


Total Invasive


14,318


60.0


21,665


72.1


1,373


59.3


2,675


68.3


Localized


6,900


87.2


13,195


93.0


740


85.1


1,791


86.7


Regional


3,500


58.1


4,167


65.0


257


51.6


363


56.5


Distant


3,480


8.5


3,855


9.5


317


8.6


446


7.5


Unstaged


438


47.8


448


48.6


59


35.2


75


36.5


a SEER program 9 registries supported by the National Cancer Institute; microscopically confirmed cases only; follow-up through 2006.


RISK FACTORS

Several risk factors have been well established for RCC, including cigarette smoking, hypertension, and obesity. Other risk factors have also been implicated, such as a history of diabetes mellitus, physical inactivity, occupational exposure to trichloroethylene (TCE), and high parity among women, but evidence remains inconclusive.


Cigarette Smoking

Considered a causal risk factor for RCC by both the US Surgeon General and the International Agency for Research on Cancer (14,15), cigarette smoking has been shown to increase RCC risk in most studies. However, the risk associated with smoking is relatively modest. A meta-analysis of 24 studies showed that compared to lifetime nonsmokers, ever smoking increased RCC risk by about 50% in men and 20% in women (16). A dose-response of risk with increasing number of cigarettes smoked was evident, doubling in men and increasing by nearly 60% in women who smoked more than a pack of cigarettes per day. Among former smokers, the risk decreases with increasing years of smoking cessation, but the reduction in risk is generally small until 10 or more years after quitting (16,17). An association with other tobacco products, including cigars, pipes, and smokeless tobacco, has not been consistently observed (15,18).

Smoking is hypothesized to increase RCC risk through chronic tissue hypoxia and increased DNA damage due to sensitivity to tobacco carcinogens (19,20). Since the prevalence of cigarette smoking has declined for over four decades (21), smoking is unlikely to have contributed to the continuing rise in RCC incidence in the United States. Further, its relative impact on RCC occurrence is expected to diminish over time.


Obesity

An increased risk of RCC has been associated with overweight and obesity in most epidemiologic studies. These conditions are estimated to play a role in over 40% of RCC occurring in the United States (22). In prospective studies conducted worldwide, individuals who were obese or overweight at baseline were found to have an elevated risk of RCC during the follow-up period (23,24,25,26,27,28,29,30,31,32,33). Furthermore, the risk increased in a dose-response manner with increasing body weight. In a meta-analysis of data from prospective studies, it was estimated that RCC risk increased 24% for men and 34% for women for every 5 kg/m2 increase in body mass index (BMI) (34). The marked increases in the prevalence of obesity in the United States during the past few decades likely have contributed to the continuing rise in RCC incidence. The recent data showing
highest rates of obesity among blacks may also explain, in part, the racial disparity of RCC occurrence in this country (35).


FIGURE 38.5. Relative 5-year survival rates (%) for RCC cases among blacks and whites by stage at diagnosis, SEER 9, 1992-2005.

An enlarged waist-to-hip ratio has also been linked to RCC risk, but an independent effect from that of BMI per se is not yet supported (11,24,29,30,33). In addition, weight fluctuations and weight gain during adulthood have been shown to increase risk after adjusting for BMI, but the evidence is still limited (23,30,33). The pathophysiology underlying the association between excess body weight and RCC risk is not fully understood but is hypothesized to include insulin resistance and compensatory hyperinsulinemia, altered production of adipokines, obesity-induced inflammatory response, lipid peroxidation and oxidative stress, and chronic tissue hypoxia (19,22,36,37).

Only gold members can continue reading. Log In or Register to continue

Stay updated, free articles. Join our Telegram channel

Jul 15, 2016 | Posted by in ONCOLOGY | Comments Off on Epidemiology of Renal Cell Carcinoma

Full access? Get Clinical Tree

Get Clinical Tree app for offline access