Fig. 19.1
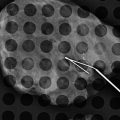
(a) Mammogram (MLO view) demonstrates an area of possible architectural distortion (arrow). (b) Corresponding image from tomosynthesis examination shows no suspicious abnormality. The distortion was due to overlap of normal fibroglandular tissue (Images courtesy of Hologic® and Carl J. D’Orsi, MD)
In contrast, many studies have found optimistic results when examining tomosynthesis in combination with FFDM. Skaane et al. found that tomosynthesis in combination with mammography versus mammography alone resulted in a 27 % increase in the cancer detection rate (p = 0.001), with a 15 % decrease in false positives (p < 0.001). Also encouraging is that they found that adding tomosynthesis allowed for a 40 % increase in detection of invasive cancers [7]. Rafferty et al. had similar results, with a significantly increased area under the receiver operation characteristic (ROC) curve when tomosynthesis was combined with mammography compared to mammography alone. Recall rates for non-cancer cases significantly decreased for all readers. They also found that the increased sensitivity was greatest for invasive cancers [8]. Poplack and colleagues found a reduction of 40 % in the screening recall rate when tomosynthesis was used in addition to mammography [9], while Gur et al. found a decrease of 30 % [10]. A recent study by Rose and associates [11] found that after addition of tomosynthesis to FFDM in routine clinical practice, recall rates decreased from 8.7 to 5.5 % (p < 0.001), and the positive predictive value for recalls increased from 4.7 to 10.1 % (p < 0.001). Several studies have evaluated the use of tomosynthesis in lieu of additional mammographic views in characterizing noncalcified lesions. Some have found the two techniques to be comparable [12, 13], while Zuley et al. found that the area under the ROC curve (AUC) was significantly greater for tomosynthesis versus supplemental mammographic views (0.87 vs. 0.83) [14].
In order to decrease radiation dose and interpretation time, single-view as opposed to two-view tomosynthesis imaging has been explored. Wallis et al. found single-view tomosynthesis examinations to have equivalent diagnostic accuracy to a standard FFDM exam, while two-view tomosynthesis offered an improved accuracy, but only for readers with less than 10 years of experience [15].
Tomosynthesis is thought to be less sensitive than mammography for the detection of calcifications. This is due to images being reviewed as slabs of user-defined thickness. There is an inherent trade-off with the thickness of slabs: thicker slabs allow for the perception of 3D clusters of calcifications, but also lead to decreased spatial resolution of each individual calcification [16]. Poplack et al. found that in general, the image quality of calcifications was better with mammography than with tomosynthesis [9]. However, another study found that though FFDM was slightly more sensitive than tomosynthesis for the detection of calcifications, the diagnostic performance as measured by AUR between the two modalities was not significantly different [16]. Further improvements in image acquisition and display may lead to improvement in calcification detection. An additional drawback of tomosynthesis is an approximate doubling of interpretation time when compared to mammography alone [7, 15]. However, it is anticipated that this will be balanced by reduction in recalled screening examinations, follow-up studies, and biopsies [14]. Another limitation is increased radiation dose. Using tomosynthesis in combination with FFDM results in a doubling of radiation dose, though in many cases, this is still less than the FDA limit for a single standard mammogram exam [1, 8]. However, it is desirable to keep radiation doses as low as reasonably achievable. One solution to this is in the use of synthetically reconstructed two-dimensional images, created from the tomosynthesis data, in lieu of the additional corresponding full-field view. This technology has recently been approved by the FDA [17].
Stereoscopic Mammography
Similar to the idea behind tomosynthesis is that of stereoscopic mammography, which attempts to overcome 2D mammography’s limitation of overlying normal tissue obscuring and mimicking lesions. Stereoscopic imaging uses two images of the breast acquired above and below the 0° axis. These images are viewed with cross-polarized glasses on a display consisting of two cross-polarized monitors at 110° from one another, each displaying one of the images, and a silver-coated glass plate bisecting the 110° angle (Fig. 19.2). In this setup, each eye sees only one of the two images, and the reader’s visual system fuses the images into a single in-depth image. One study that evaluated stereoscopy clinically found that it had significantly higher specificity and accuracy and a lower recall rate when compared to standard mammography, with a similar sensitivity [18]. Further research will need to be done to confirm these results and to see if good results can be obtained at a lower radiation dose.
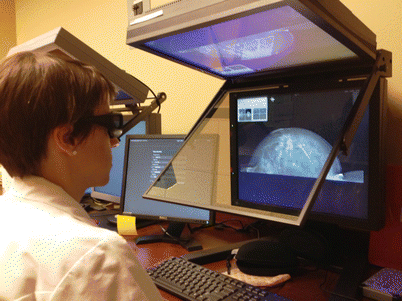

Fig. 19.2
Stereoscopic mammographic dedicated viewing station
Contrast-Enhanced Mammography (CEM)
Another modification that has been developed to overcome the limitations of conventional mammography is the addition of intravenous contrast. This is postulated to improve lesion detection due to the preferential uptake of contrast material within cancers, as seen in contrast-enhanced MRI (magnetic resonance imaging). Contrast-enhanced mammography could theoretically be an alternative for those unable to have an MRI.
There are two methods of obtaining contrast-enhanced mammographic images. One is to use temporal subtraction, in which a pre-contrast mask image is obtained followed by the injection of contrast and a series of additional exposures [19]. The mask image is then subtracted from those taken after contrast injection to show the distribution of contrast. This method is limited by the requirement for compression, motion artifacts due to long imaging times, and the ability to only image one breast in one view per injection. Another method uses dual-energy acquisition, in which, after iodinated contrast injection, two images are performed in rapid succession—a low-energy image below the k edge of iodine (33.2 keV) and a high-energy image above the k edge. The high-energy image preferentially demonstrates the contrast distribution, as photons just above the k edge are more likely to be attenuated by iodine than those below or far above it [20]. The images are then processed to suppress background breast tissue and highlight iodine-enhanced areas [21] (Fig. 19.3a, b). This dual-energy technique allows both breasts to be imaged in multiple views with only one injection [22]. It also permits shorter acquisition times, minimizing motion artifact and the duration of breast compression [22]. A disadvantage of this method is that as contrast is present on both acquisitions, some of the iodine is subtracted out of the processed image [20].
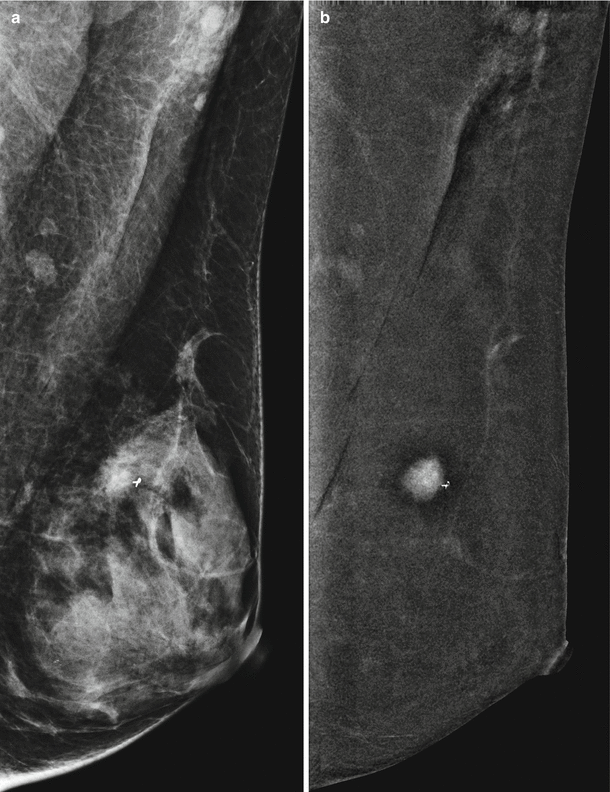

Fig. 19.3
A 48-year-old with grade 1 invasive ductal carcinoma, post biopsy. (a) Standard MLO view mammogram. (b) Dual-energy contrast-enhanced digital mammogram (CEDM). The cancer is not readily apparent on standard mammography (a) but is well demonstrated on CEDM (b) (Images courtesy of John Lewin, MD)
An initial study by Jong et al. showed that with the temporal subtraction method, 8/10 (80 %) cancers enhanced and 7/12 (58 %) benign lesions did not [23]. Another preliminary investigation by Diekmann and associates found that by using temporal subtraction, contrast could be seen within known tumors in all seven participating patients [24]. A subsequent study showed that adding temporal subtraction CEM to conventional mammography increased sensitivity for detecting cancer from 43 to 62 %. The improvement in sensitivity was even greater in patients with dense breasts [25]. Another study of temporal subtraction CEM found that its sensitivity for known cancers was 80 % [26]. Interestingly, in 2 of 20 patients, the cancers were in the posterior part of the breast and moved out of the field of view between the mask and contrast-enhanced images. This highlights one of the limitations of the temporal subtraction technique: prolonged acquisition times resulting in patient motion.
A preliminary study of the feasibility of duel-energy contrast-enhanced (DE CE) mammography was done by Lewin et al. [27]. They demonstrated that all 14/14 cases of cancer enhanced, while out of 12 patients with benign lesion, only 4 enhanced. Jochelson and associates compared DE CE mammography with conventional mammography and with MRI in 52 patients with known cancer [21]. They found that DE CE mammography and MRI both had a sensitivity of 96 % for index tumors, more than conventional mammography, which had a sensitivity of 81 %. Sixteen of the 52 patients had multifocal or multicentric cancers, and MRI was better at detecting these additional ipsilateral cancers than was DE CE mammography (88 % vs. 56 %). However, MRI had more false-positive findings (13/52 or 25 %) than did DE CE mammography (2/52 or 4 %). The Jochelson study found that the size of lesions as measured on DE CE mammography accurately represented the pathologic size in all but two patients, in which it overestimated the size by 1 and 1.7 cm. MRI accurately depicted the size in both. Another study, however, found that there was a good correlation between the size of lesions as measured on CE mammography and histological specimens (coefficient of correlation of 95 %) [26]. Dromain et al. [19, 22] found that diagnostic accuracy was improved when DE CE mammography was performed in addition to conventional mammography with or without ultrasound when compared to conventional mammography with or without ultrasound alone. The area under the ROC curve increased for each reader when DE CE mammography was added to conventional mammography +/− ultrasound.
Interestingly, unlike the rapid washout of contrast seen in malignancies during MRI imaging, enhancement with CE mammography remains present for at least 10 min. This may be due to differences between gadolinium and iodine [21] or as a consequence of breast compression [26]. Because of this lack of washout, kinetic enhancement information is not a helpful discriminator in CE mammography as it is in MRI [25].
Limitations of contrast-enhanced mammography include a decreased ability to evaluate the breast periphery due to a rind of increased density from radiation scatter [19, 21]. Additionally, there is a small increase in radiation exposure compared to conventional mammography. Several authors have calculated that the total additional radiation dose was equivalent to approximately one additional mammographic view [21, 22]. Lastly, there is a possibility of allergic reaction to the iodinated contrast, which can be life-threatening [22]. More studies will need to be done to verify that the risks are justified by a significant improvement in the detection of cancer.
Breast Ultrasound
Background
The appeal of using breast ultrasound (US) as a diagnostic adjunct to mammography was first noted in the 1960s–1970s, related to its “nondestructive technique” [28]. Kobayashi and colleagues reported early success using ultrasound to differentiate between benign and malignant breast lesions, employing a 5 MHz transducer and an automated system. They reported 84 % accuracy in predicting benign pathology and 90 % accuracy with malignant lesions, using only two sonographic criteria, which roughly correlate in today’s terminology to (1) the echo pattern of the lesion itself and surrounding tissue (the latter actually concentrating on the posterior lesion margin) and (2) lesion posterior acoustic features [29]. Their cohort consisted only of palpable lesions that were suspicious enough to warrant excision/mastectomy, however. In addition, the smallest mass they were able to find was 5 mm, even when they were directed to the site in question by clinical findings. Dodd and associates concluded that US lacked the spatial resolution to detect and characterize subclinical cancers [28]. As a result, breast US was largely relegated to differentiating cystic from solid masses detected clinically or mammographically, at which it proved skillful. As sonographic equipment became more sophisticated, with resolution improved by the introduction of higher-frequency transducers of at least 10 MHz, US became an increasingly sought-after tool to supplement mammography in the evaluation of breast problems. Multiple studies have confirmed its utility in determining which mammographically detected solid masses might undergo short-term surveillance rather than requiring biopsy (negative predictive value in the region of 99.5 %), assuming strict morphologic criteria were followed [30, 31] (Fig. 19.4).
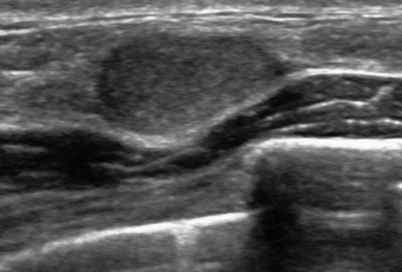

Fig. 19.4
This mass shows multiple features (gently lobulated margins, oval shape, parallel orientation, homogeneously mild hypoechogenicity, absence of suspicious features) that allow surveillance rather than biopsy, despite its solid nature
As the ability of breast US to find and characterize mammographically occult lesions became validated, the possibility of using US as an adjunct screening tool, at least for women at increased risk and/or with dense tissue, has gained momentum. ACRIN (American College of Radiology Investigational Network) 6666, a prospective multicenter study, was designed to compare mammography alone to mammography plus ultrasound in a screening setting, using a cohort of patients at elevated risk for breast cancer and heterogeneously or extremely dense breast tissue in at least one quadrant as determined by mammogram. Among their 2,637 patients, 12 cancers were seen on ultrasound alone, representing a supplemental yield of 4.2 cancers per 1,000 over mammography alone. The cancers found with US alone tended to be smaller and more often node negative [32]. Two additional multicenter studies have confirmed the results noted in ACRIN 6666 [33, 34], showing additional cancer detection yield of 4.2–4.4 per 1,000.
However, breast US has limitations, including imperfect specificity and, at least in the screening setting, many false positives. ACRIN 6666 revealed a near doubling of false-positive rate (8.1 % vs. 4.4 %), a lower positive predictive value for biopsy (PPV2) (8.9 % vs. 22.6 %), and a higher rate of short-term follow-up recommendation (8.6 % vs. 2.2 %) with US alone compared to mammography. Thus, the additionally detected cancers came with a “price,” including unnecessary biopsies and added work-up. Another limitation includes its diminished sensitivity for in situ cancers compared to mammography [32]. Handheld technique is also highly operator dependent: given its real-time nature, if a lesion is not detected and recorded during active scanning, it will be missed. In a screening setting, it is time and labor intensive, especially of concern when requiring physician scanning involvement during times of decreasing technical and professional reimbursement. In ACRIN 6666, the reported average scan time per patient was 19 min for a bilateral exam (often much longer in patient with large breasts or multiple findings), excluding time spent talking to the patient, reviewing and reporting the exam, and comparing to prior exams [32]. Evolving ultrasound technology is primed to address many of these limitations.
New Technologies
Automated whole-breast ultrasound (AWBU) is being revisited, improved, and refined after its introduction in the 1960s–1970s. AWBU has the potential to standardize and expedite study acquisition. It theoretically can be performed by a technologist without requiring physician involvement during scanning. A variety of prototypes are under development and clinical evaluation. Each uses unique acquisition and presentation methods and employs high-frequency probes. One vendor uses a robotically guided but standard transducer to scan the entirety of both breasts, with presentation of the images in a cine loop in 2D axial projection. Another employs a large footprint transducer placed over the central part of each breast with patient supine, with presentation of the reconstructed images in the coronal plane, as well as the orthogonal source images (Fig. 19.5a, b). A third prototype makes use of a custom transducer to scan a pendant, immersed breast, with presentation of 3D reconstructed images [35]. Wang and colleagues showed that the diagnostic accuracy of AWBU in differentiating benign from malignant lesions is comparable to handheld US [36]. A 2010 multicenter prospective screening study comparing mammography to automated whole-breast screening showed that automated US screening resulted in an increase in cancer yield by 3.6 per 1,000 compared to mammography alone [37]. These authors also found an improved PPV (30.7 % vs. 8.9 %) and a higher detection rate of subcentimeter US-only cancers (14.3 % vs. 6.2 %) when their automated technique was compared to the handheld technique used in ACRIN 6666. These results require validation by other large studies, but suggest the potential efficacy of AWBU for increasing throughput in a screening setting, while retaining accuracy. Some potential limitations of AWBU included its limited field of evaluation (the axillae and, with some systems, the periphery of the breasts are excluded) and diminished effectiveness with large breasts (deep lesions may not be well visualized/characterized). As specialized add-on equipment or complete replacement systems will be required to carry out AWBU, cost will rise.
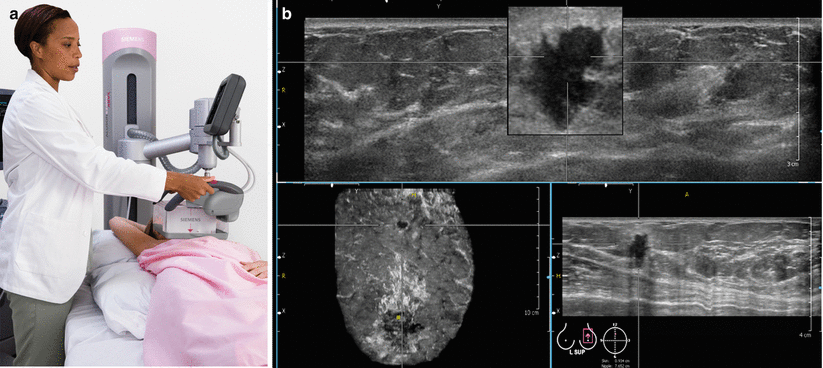

Fig. 19.5
(a) Automated whole-breast ultrasound unit with large footprint transducer covering breast. (b) Breast cancer outlined in three orthogonal views (Images courtesy of Siemens Healthcare)
Ultrasound elastography (USE) is another exciting emerging technology that may improve specificity for lesions detected with ultrasound, aiding in more cost-effective but equally safe management of these lesions. USE essentially evaluates the stiffness of tissue, as is done more grossly and subjectively during physical examination of the breast. Two types of USE are currently being evaluated: compressive (strain) elastography and shear-wave elastography (SWE). In each, one can ascertain the stiffness of a mass and its adjacent environment by observing its reaction to the application of an external stressor. With compressive elastography, gentle transducer pressure is used to apply external force (stress) to the surface of the breast over the lesion in question; the resultant “strain” (the degree to which the tissue changes in shape, size, and position when the stress is applied) has implications about likelihood of malignancy. Upon detection of an equivocal lesion during real-time scanning, elastography software allows side-by-side display of the B-mode image and the corresponding “elastogram” (a color-coded visual display of the semiquantitative strain data generated automatically and behind the scenes) (Fig. 19.6). This elastogram is then qualitatively evaluated and/or assigned a score, as described by Itoh and associates [38]. They described a spectrum of elastogram patterns: a lesion displaying uniform high strain (diffusely soft and malleable) would receive a score of 1; at the other extreme, a lesion and its surrounding tissue showing low strain (firm and immobile) would receive a score of 5. A meta-analytic comparison of USE to conventional B-mode (N = 5,511 lesions) showed an improvement in specificity from 70 % (B-mode) to 88 % (USE) [39]. However, USE alone was far less sensitive than conventional US (79 % vs. 96 % for B-mode), demonstrating that this technique cannot serve as a replacement for conventional US, but rather as a triage tool that may allow safe deferral of biopsy of borderline suspicious (i.e., BIRADS (Breast Imaging and Reporting System) 4a) lesions which have a low elastography score, thereby decreasing the unacceptably high false-positive rate of screening US. This method of USE has some intrinsic limitations. It is operator dependent (related to subjective application of “light” transducer pressure as the source of mechanical stress) and semiquantitative in nature and therefore may lack reproducibility [40].
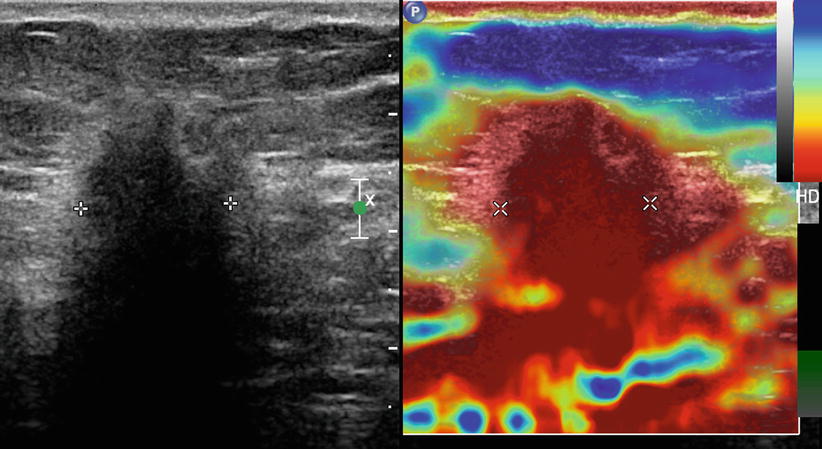

Fig. 19.6
Compression elastography. A mass is seen on standard US image (left). The corresponding elastogram (right) shows the mass to display low strain (assigned red here), indicating a firm consistency compared to other breast tissue. Note that the red coloration extends beyond the margins of the mass as outlined by cursor placement, indicating an Itoh score of 5
Shear-wave elastography (SWE) represents another method of interrogating the stiffness of tissue. Instead of relying on transducer pressure to stress tissue, SWE measures tissue stiffness by calculating the speed at which that tissue variably propagates shear waves. These shear waves are generated as a result of a transducer-produced acoustic radiation force impulse (ARFI), which perturbs the tissue (Fig. 19.7). Ultrafast scanning is required to record the minute degrees of tissue displacement that occurs as the transversely oriented shear waves travel through tissue at varying speeds, depending on tissue stiffness. As the stress imparted by this pulse wave is known, the resultant strain of the interrogated tissue can be quantified. SWE requires no active participation by the technologist over and above scanning and therefore is operator independent and highly reproducible. Therefore, SWE mitigates many of the limitations of strain elastography. This technology is coupled with B-mode imaging. Research is ongoing to determine which single or combination of elastographic features (e.g., quantitative features such as maximum, median, or minimum elasticity value; elastographic lesion homogeneity; elastographic shape; elastographic lesion size vs. B-mode size) serve best to improve specificity and even sensitivity. Results of the BE1 Multinational Study [41] comparing conventional US to US plus SWE confirmed that by considering certain elastographic features, some BIRADS 4a lesions could be safely downgraded. In addition, some BIRADS 3 (and even BIRADS 2) lesions were accurately upgraded: 4 of 4 BIRADS 3 lesions that were morphologically benign appearing but showed suspicious elastographic features proved to be cancer. By adding SWE, specificity was increased from 61.1 to 78.5 %. Both SWE and strain elastography allow accurate differentiation of complicated cysts from solid masses, a situation encountered frequently when using US in both the screening and diagnostic arenas, allowing improvement in specificity and diminishment in false-positive biopsy and short-term follow-up rates.
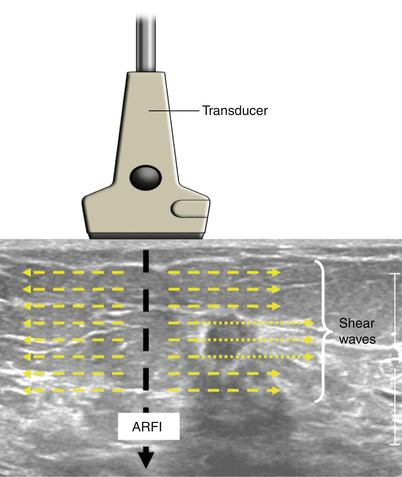

Fig. 19.7
Schematic of shear-wave propagation. An acoustic wave force impulse (ARFI) is sent from transducer into breast, resulting in propagation of transverse shear waves. These waves traverse the mass present here faster than normal tissue and can be quantified and visually displayed
The use of computer-assisted diagnosis (CADx) for US is another way that improved performance can likely be realized. As opposed to computer-assisted detection technology used in mammography, US CADx is used not to detect lesions but to help predict their likelihood of malignancy once detected, based on combined morphologic features. Kashikura and associates showed that reader accuracy (as measured by AUC) on the average improved from 0.716 to 0.864 (p = .006) when CADx was used by three experienced imagers to help evaluate a series of 390 US masses [42].
Dedicated Breast Computed Tomography
Dedicated breast computed tomography (DBCT) represents an additional investigational modality that seeks to address the 2D limitations imposed by standard mammography. Its theoretical appeal includes the ability to image and display the breast in isotropic three-dimensionality, as has been exquisitely demonstrated when imaging other organs, and the lack of need for breast compression.
Several prototype models are undergoing evaluation. They are configured such that the patient lies prone on a table with her breast placed pendant into a dedicated gantry (Fig. 19.8). Rather than traditional cone beam geometry used for whole-body CT, a half cone beam is used, dictated by the need for the X-ray tube and the detector to rotate as closely opposed to the undersurface of the table as possible to allow visualization of posterior breast tissue and, optimally, a portion of chest wall (Fig. 19.9). Flat panel detectors are used, with a 40 × 30 cm field of view (PAXSCAN™ detector, Varian Imaging Systems®, Salt Lake City, UT, USA). A variety of X-ray source types has been employed, operating at kVps from 49 to 80, with resultant scan times ranging from 10 to 16.6 s, allowing single breath hold [43]. These original prototypes allow spatial resolution in the range of 150–400 μm, less than is achieved with standard digital mammography [44]. The images are reconstructed in three orthogonal planes and evaluated by scrolling through an imaging volume. 3D and maximum intensity projection (MIP) can be created as well (Fig. 19.10). Using this general technique, radiation dose per breast per series is comparable to a two-view mammogram [45].
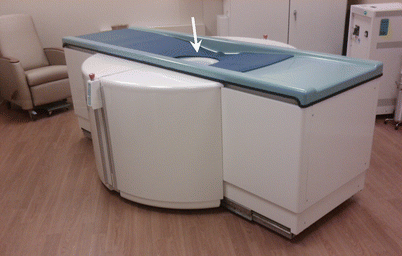
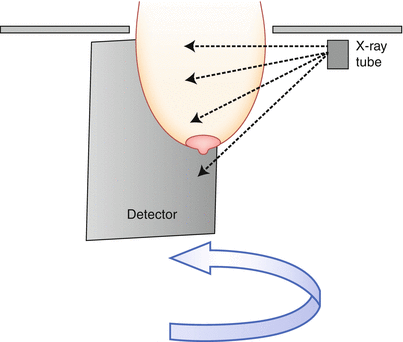
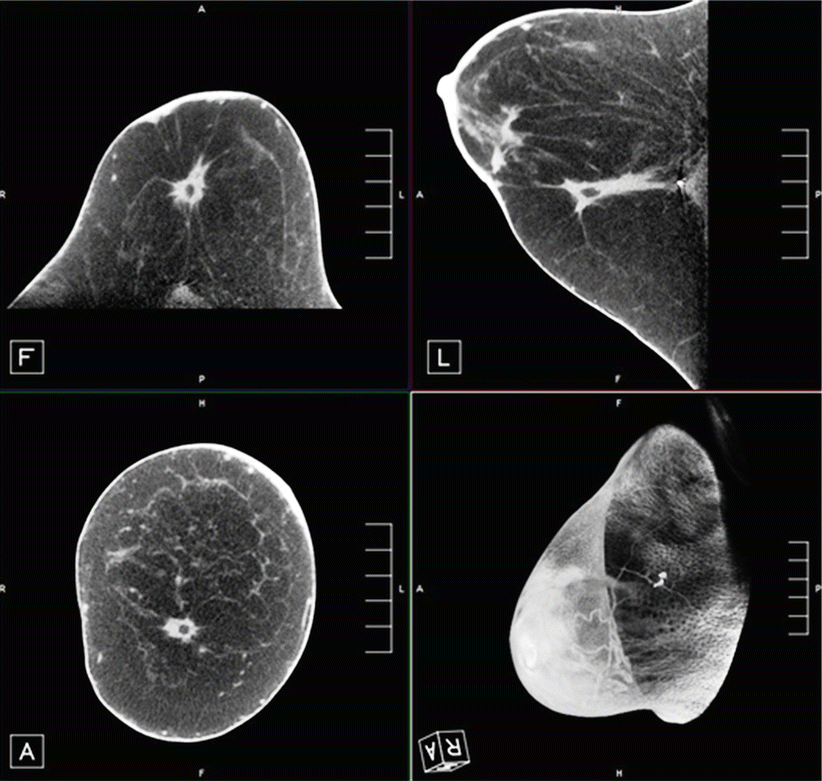

Fig. 19.8
Dedicated breast CT scanner. The patient lies prone and hangs breast in vertical gantry (arrow) (Courtesy of Ioannis Sechopoulos, PhD)

Fig. 19.9
Schematic of dedicated breast CT scanner. The X-ray source consists of a half cone beam (collimated to target only breast) and detector, both of which rotate in synchronized opposition around the pendant breast

Fig. 19.10
Non-contrast breast CT. A mass (showing spiculated margins but central fat: fat necrosis) is displayed in three orthogonal views. A maximum intensity projection (lower right) is also displayed, which can be rotated in any projection (Courtesy of Hologic® and Carl J. D’Orsi, MD)
Adequacy of breast coverage was evaluated by O’Connell and associates. They found that greater tissue inclusion was demonstrated medially, laterally, inferiorly, and posteriorly, with equivalent coverage noted superiorly. However, by using axillary nodes as a marker for comparison, they noted that mammography allowed better coverage of axillary tail. Patient acceptance must be considered in evaluating this modality, since avoidance of breast compression is touted as a potential advantage. O’Connell’s group also assessed patient acceptance and comfort. A minority of patients (13 %) found DBCT to be less comfortable than mammography, with most finding it more (43.5 %) or equally (43.5 %) comfortable compared to mammography [45].
The clinical data regarding DBCT are relatively sparse. Initially, work was done without the use of intravenous contrast. Lindfors and colleagues scanned a cohort of 69 women with BIRADS 4 or 5 lesions, as well as 10 healthy volunteers. They compared DBCT images to the patients’ mammograms in a nonblinded fashion for lesion conspicuity. Overall, there was no difference in lesion detectability between modalities; however, masses were better seen with DBCT, and calcifications were better detected with mammography, reaching significance in both scenarios [46]. These data were confirmed on follow-up studies by the same group [43] and suggest that the lack of comparable spatial resolution achieved with the original DBCT prototypes limits the clinical efficacy of DBCT, at least in the non-contrast setting, when evaluating calcifications. O’Connell et al., using a different prototype scanner, also found, in comparing mammography to non-contrast DBCT, that CT was inferior in detecting calcifications when compared to mammography. In their study, 13.5 % of calcifications seen on mammography were not detectable on DBCT [45].
Non-contrast DBCT is dependent on morphology and differences in intrinsic soft tissue contrast to allow lesion detection. More recent work has looked at leveraging the physiological differences between normal parenchyma, benign tumors, and malignant lesions by using intravenous contrast material, as has been done with breast MRI. In a study of similar design to that described previously, Prionas and associates compared mammography and non-contrast DBCT to contrast-enhanced DBCT (CE-DBCT) in 46 women with BIRADS 4 or 5 lesion who underwent all three imaging studies prior to biopsy. They found that all malignant lesions (N = 29) were better seen on CE-DBCT than on mammography, especially masses. Interestingly, malignant calcifications (N = 7; 5 of 7 were pure DCIS) were also better seen on CE-DBCT, albeit only slightly and not reaching statistical significance. Conversely, benign calcification was seen with greater conspicuity on mammography, raising the possibility that CE-DBCT might allow for greater specificity in calcium evaluation by essentially “missing” benign calcifications. Since degree of enhancement is quantifiable, these investigators were able to show that differential enhancement may allow prediction of malignancy, with an area under the ROC curve of 0.876 [47].
The logistics of CE-DBCT deserve consideration. One of the benefits of dynamic contrast-enhanced (DCE) MRI is that robust temporal and spatial information is obtained with technology that allows parallel imaging of both breasts synchronously. With DBCT, however, only one breast is imaged at a time. It has not been established how best to combine the imaging of both breasts with the timing of contrast administration. Prionas’ group [47] used the following scan sequence: pre-contrast unaffected breast, pre-contrast affected breast, post-contrast affected breast, and post-contrast unaffected breast. Therefore, two patient position changes were required. Obviously, some kinetic data are lost in this situation when compared to DCE MRI, where multiple sequential and bilaterally parallel postcontrast time points are acquired. This group, however, noted that morphology is likely more important than kinetics when evaluating lesions, and DBCT with its superior resolution, may make this logistical point relatively moot. Further study is needed to validate that observation. Prionas’ group also reported that decisions regarding contrast dose and delay after injection were derived empirically. Again, ongoing work will help determine optimal scanning protocols.
The early work regarding DBCT appears promising. In an interesting discussion of what the “perfect” replacement for mammography would look like, Kalender et al. noted that that tool must meet the following specifications: 3D capabilities, good soft tissue contrast, dynamic/kinetic proficiency, high spatial resolution (100 μm), dose comparable to two-view mammography, patient comfort without need for significant compression, biopsy capabilities, and low cost [48]. It appears from these studies that DBCT comes close to meeting this challenge. However, a few concerns remain. The original prototype models, on which the available clinical studies have been performed, offer spatial resolution in the range of 300–400 μm, inferior to that demanded by Kalender. However, several groups are working on new prototypes that achieve improved resolution while maintaining acceptable dose, using spiral technique and other modifications [48, 49]. Additionally, a “clinic-ready” fully shielded model has been developed that employs an open geometry which will allow integration of a (yet-to-be-developed) biopsy system. Its developers indicate that a clinical throughput of 11 min/patient can be expected and a cost comparable to a tomosynthesis unit [49]. Even the original prototypes achieve a rapid per-sequence scan time of 10–16 s. Thus, the kinetic considerations will likely be addressed. These new prototypes await clinical validation. Although it appears that the theoretically “perfect” breast imaging machine has nearly been built, it remains to be seen if DBCT can garner the excitement that DCE breast MRI and tomosynthesis have.
Magnetic Resonance Imaging
Magnetic resonance imaging (MRI) has been validated as a robust breast imaging tool, largely related to its high sensitivity for detection of breast cancer, in the range of 94–99 %. Its many indications include high-risk screening, determination of the extent of disease in newly diagnosed breast cancer patients, assessment of treatment response in patients undergoing neoadjuvant hormonal or chemotherapy, problem-solving in selected cases where a suspected imaging finding can be neither dismissed safely nor validated/localized by standard imaging, and further evaluation of suspicious clinical symptoms where a biopsy target or cause cannot be identified by routine imaging. However, it suffers from some drawbacks, including reported relative low specificity (range 37–86 %) [50] and high cost, when compared to mammography. Newer technologies, which explore parameters other than lesion morphology and kinetic enhancement characteristics, are being developed to address these limitations.
Magnetic Resonance Spectroscopy (MRS)
Magnetic resonance spectroscopy interrogates the chemical composition of tissue in vivo in a noninvasive manner. This technique has been applied to the brain and prostate with success and continues to undergo investigation for use in breast cancer evaluation. The bulk of chemical material in the breast consists of water and fat. However, other molecules can be detected via MRS, including some relatively specific for breast neoplasia, namely, choline-containing compounds (grouped together and referred to as total choline). These molecules have a role in membrane synthesis and metabolism and therefore may serve as signature molecules for the presence of breast cancer, where such metabolism is elevated. This total choline is present in high enough concentrations that its presence can be detected by the small magnetic field alterations its protons create (Fig. 19.11a, b). Choline can be present in normal breast tissue and benign breast lesions, indicating that quantification and not just identification of its presence is paramount [51]. One appealing potential use for MRS would be to increase the specificity of MRI. Bartella and associates found that by incorporating MRS into the MR protocol, the positive predictive value of biopsy could be increased from 35 to 82 %, with MRS showing specificity of 88 %, while maintaining 100 % sensitivity [52]. Dorrius and colleagues showed that BIRADS 3 lesions could be accurately reassigned based on choline concentrations. In their study, the use of MRS would have allowed proper identification of the two of eight malignant lesions initially called BIRADS 3 on routine MRI as well six of eight benign lesions that could have been safely reassigned to the BIRADS 2 category. There was no overlap between the choline concentrations of benign and malignant lesions, and their AUC was 1.00, compared to 0.0964 for standard MRI [53]. However, both studies only interrogated lesions 1 cm or greater in size. Tozaki’s results were less compelling, showing overall sensitivity and specificity of 44 and 85 %, respectively. When only lesions >1.5 cm were considered, sensitivity increased to 82 % but specificity fell to 69 % [50].
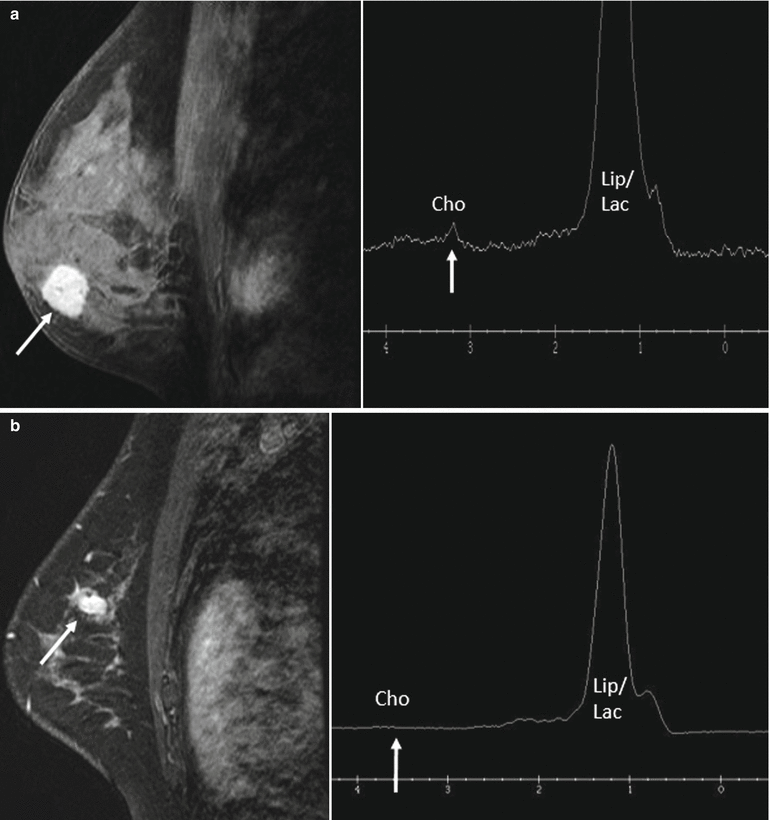

Fig. 19.11
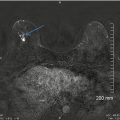
Examples of MR spectroscopy (MRS). (a) The malignant mass shown on conventional post-contrast MR image on left (arrow) displays an elevated choline peak (right, arrow) when interrogated by MRS. (b) The fibroadenoma outlined on post-contrast MR image (left, arrow) shows no elevation in choline spectral peak (right, arrow), in keeping with its benign nature. Lip/Lac lipid/lactate (Images courtesy of Sunitha B. Thakur, PhD)
Another area where MRS may be useful is in the early prediction of treatment response to neoadjuvant chemotherapy (NAC). An optimal tool would allow prediction as early in treatment as possible, to allow midcourse regimen change in nonresponders. Mammography, ultrasound, and physical exam rely on decrease in tumor size as a marker of response, but this has been shown to be unreliable in some cases and may lag behind real response. MRI is a more accurate tool, as it can show physiologic changes that may precede size change [54]. However, as MRS is measuring tumor metabolites in the form of choline compounds, it could provide even more specific information about treatment response and cell death. Meisamy showed that using a 4 T unit, changes in tumor choline concentrations could be detected within 24 h after treatment initiation [55]. Tozaki used a 1.5 T unit to show that this indication was feasible with current clinically available hardware and found that tumor choline was reduced after two treatment cycles in eventual responders compared to nonresponders, despite no significant change in tumor size at that point between the two groups. Positive and negative predictive values were 89 and 100 %, respectively [56].
MRS is hampered by several limitations. Lesion size is one. Most studies have narrowed inclusion criteria to lesions ≥1 cm, as partial volume averaging makes specific detection of choline difficult in smaller lesions. This decreases its utility for lesion characterization/management, especially in non-mass enhancements. However, Razek and colleagues were able to show improved sensitivity and specificity over MRI for lesion characterization even for lesions as small as 0.5 cm with MRS, when using a 3 T system. They attribute their favorable results to higher field strength [57]. Other limitations of MRS include low sensitivity for detection of DCIS, as choline is often absent in in situ lesions; the capability of examining only a single lesion when single-voxel technique (most common) is used; and false-negative exams, especially when inadequate fat suppression allows the spectroscopic peak of fat to broaden and obscure the relatively small choline peak. Additionally, no commercial analytic software has been developed specific to breast MRS [58]. Therefore, for several reasons, MRS remains outside of routine clinical practice at this point, but holds promise.
Diffusion-Weighted Imaging (DWI)
Diffusion-weighted imaging is another emerging MRI technique that probes lesion physiology and local architecture rather than just morphology and kinetic characteristics. It assesses the ability of water to move freely and randomly in tissue (Brownian motion). This motion may be relatively restricted under certain circumstances, such as in the presence of increased cellular density, cellular swelling, changes in membrane permeability, and the presence of cell lysis. Each of these may occur in cancer. As a result, the free motion of water is restricted compared to adjacent normal tissue. This process can be quantified, referred to as the apparent diffusion coefficient (ADC), and can be mapped to allow correlation to standard images of the breast (Fig. 19.12). Many studies have confirmed that the ADC values differ between malignant and benign lesion, with ADCs tending to be lower in cancers (likely related mainly to dense cellularity) [59, 60]. Partridge and associates showed that low ADC was a significant predictor of malignancy and that even when a relatively high discriminating ADC threshold was set so as to allow 100 % sensitivity, biopsy could have been avoided in 33 % of benign cases. Very importantly, that group demonstrated that the improved PPV was realized for non-mass lesions and lesions <1 cm, a weakness for MRS [61]. Pinker and associates developed an interpretation system that combined BIRADS features with ADC values. They set ADC discriminator thresholds and used those to potentially modify BIRADS final assessments. For example, if a mass was assigned BIRADS 4 assessment based on morphology and kinetics, but had and ADC >1.39, it was reassigned as a BIRADS 2 lesion. Conversely, a BIRADS 3 lesion could be upgraded if it had an ADC less than the threshold value. Using this system, the group maintained the high sensitivity of standard MRI but improved specificity to 89.4 % [62].
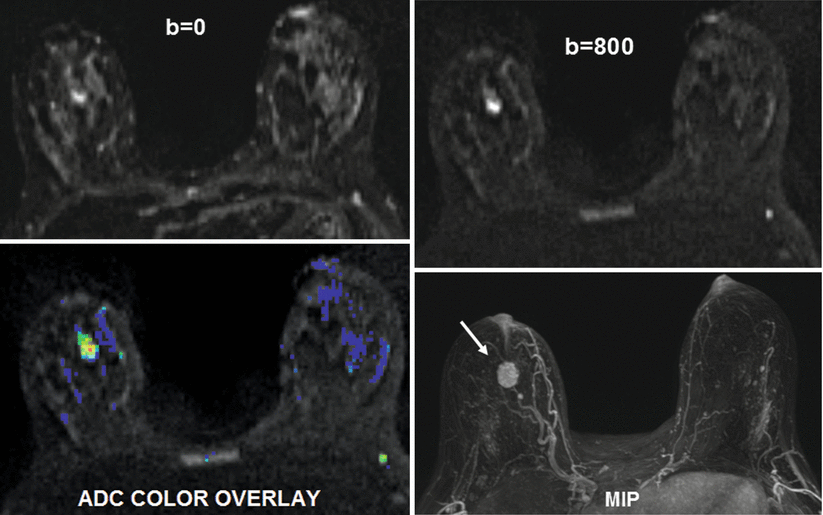

Fig. 19.12
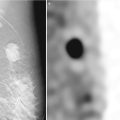
Diffusion-weighted imaging. The cancer seen on the MIP imaged (lower right, arrow) can be visualized on the DWIs (top images) obtained at b values of 0 and 800. Average ADC (1.0 in this case, low) is calculated for area of interest, and values are qualitatively displayed by color map (lower left) (red low ADC) (Courtesy of Hologic®)
DWI may allow early detection of treatment response to NAC. Several studies have shown that ADC values rise as tumors respond to treatment, often before a change in tumor size is noted and as early as 3 weeks after the start of therapy [63–65]. This likely reflects a change in cell density as tumor dies. DWI may also be able to predict the presence of an invasive component when DCIS is evaluated with MRI. Mori and colleagues showed a statistical difference between the ADC of invasive disease and surrounding DCIS, outlining an invasive nest as small as 1.5 mm [66]. Other exciting work suggests that axillary nodal metastasis detection may eventually become noninvasive. Two groups have found that ADC values between normal nodes and malignant nodes differ significantly [67, 68]. Unfortunately, the groups differed regarding whether involved nodes displayed an increased or decreased ADC compared to normal nodes. This brings to light some important limitations regarding DWI. There is overlap in ADC values between benign and malignant lesions. No absolute discriminatory ADC values have been identified; values identified in the literature appear investigator specific. Additionally, due to poor spatial resolution (related in part to slice thickness), tumor conspicuity as on DWI images suffers compared to standard MRI. These issues will likely be solved, especially with increasing penetration of 3 T units in the market, and DWI is expected to become a routine component of breast MRI evaluation in the near future, with software analytic tools currently available on several dedicated breast MRI interpretation systems.
Stay updated, free articles. Join our Telegram channel

Full access? Get Clinical Tree


