Screening
Women with high lifetime risk of breast cancer
Women newly diagnosed with breast cancer to screen the contralateral breast
Women post breast augmentation
Extent of disease
Multifocality and multicentricity
Extension to chest wall and skin
Residual breast cancer
Treatment response evaluation
Additional evaluation
Inconclusive and equivocal breast exam
Recurrence
Metastatic disease and lymphadenopathy with suspected breast primary but negative physical exam and mammography
MRI-guided intervention for lesions seen only with MRI
Screening
1.
Women with high lifetime risk for breast cancer (>20 % lifetime risk by Gail model), such as in cases of family history of breast cancer and genetic predisposition due to mutations of tumor suppression genes BRCA 1 and 2.
2.
Women with newly diagnosed breast cancer to screen the contralateral breast to detect 3–5 % of cases where there is an occult contralateral breast cancer.
3.
Women post breast augmentation with silicone or saline breast implants and those with injections of free silicone, paraffin, or polyacrylamide gel that would be difficult to screen with mammography and are preferably screened with contrast-enhanced MRI. The assessment of integrity of the implant, on the other hand, is done with non-contrast MRI.
Extent of Disease
1.
Multifocality, the presence of two or more tumor foci within the same quadrant of the breast, and multicentricity, the presence of two or more tumor foci in different quadrants of the same breast, are common in both invasive breast cancer and DCIS. The accurate assessment of the extent of breast cancer can change the management significantly; hence, the improved accuracy of MRI over mammography in evaluating the extent of breast cancer makes it a preferable modality for this purpose.
2.
Extension of breast cancer to the chest wall and skin is an important factor in breast cancer staging. MRI offers better visualization and assessment of breast cancer invasion and its relation to the deep fascia.
3.
Residual breast cancer: MRI is used to evaluate the residual disease in cases of lumpectomy with positive margins in pathology.
4.
Treatment response evaluation: MRI can be used to evaluate the response to treatment during and after the course of chemotherapy and to evaluate the residual tumor before the surgical intervention. A baseline exam, before the start of treatment, is critical to achieve that goal. Also, the placement of a tissue marker within the tumor before the start of treatment is essential to be able to identify its location in cases of complete response.
Additional Evaluation of Clinical or Imaging Findings
1.
Inconclusive and equivocal breast exam with mammography and ultrasound
2.
Breast cancer recurrence, to include patients with breast reconstruction surgery (tissue transfer flaps)
3.
Metastatic disease or axillary lymphadenopathy when the breast primary is suspected with negative physical exam and mammography
4.
MRI–guided intervention, biopsy, and wire localization for breast lesions visualized only with MRI and undetectable with other modalities
Breast Cancer Diagnosis
The clinical breast MRI examination is based on the assessment of the breast lesion morphology and breast tissue perfusion evaluated with the dynamic contrast-enhanced (DCE) MRI. In addition, breast glandular tissue composition, nipple, skin, chest wall, and axillae are also evaluated.
Breast Composition (Density)
A subjective assessment of the fibroglandular tissue density of the breast is usually the initial step in the evaluation of the breast MRI. The importance of breast density assessment arises from the correlation between higher breast density and risk of breast cancer [2–4]. According to the ACR BI-RADS, breast composition is categorized into four groups (Fig. 9.1) [5]:
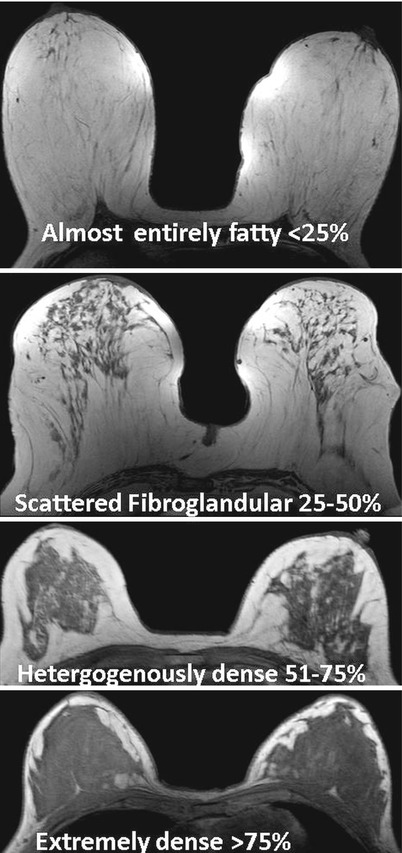
Fig. 9.1
Breast composition (breast density) categorization according to the ACR BI-RADS classification
1.
Almost entirely fatty with glandular tissue density <25 %
2.
Scattered fibroglandular with glandular tissue density of 25–50 %
3.
Heterogeneous fibroglandular densities with glandular tissue density of 51–75 %
4.
Mostly fibroglandular (extremely dense) with glandular tissue density >75 %
Breast Lesion Morphological Assessment
In the clinical breast MRI exam, a high spatial resolution (0.5 mm) and high temporal resolution (15 s) contrast-enhanced imaging are included to optimize morphological evaluation of the breast tissue and enable assessment of breast tissue perfusion. When setting up a breast MRI protocol, the high spatial resolution sequences are used to scan patients pre- and post-contrast injection, which allows subtraction of the images for improved visualization of the resultant morphology of enhancing lesions. Acquiring high spatial resolution breast MRI is needed for the accurate clinical interpretation of size, shape, borders, and internal architecture of the lesion. The American College of Radiology (ACR) Breast Imaging and Reporting Data System-MRI (BI-RADS-MRI) classifies MRI breast lesions into three categories (Box 9.2):
Box 9.2 Breast Lesion Morphological Assessment
Breast lesion |
Focus: a tiny enhancing spot <5 mm |
Mass: 3D space-occupying lesion that has distinct borders and shape |
Shape: round, oval, lobulated, or irregular |
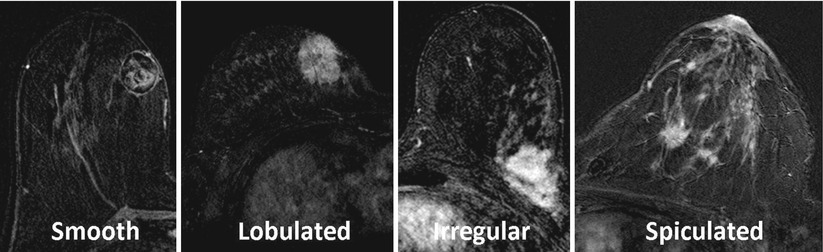
Margins: smooth, lobulated, irregular, or spiculated |
Internal enhancement pattern: homogeneous, heterogeneous, or rim |
Benign features: non-enhancing T2 dark septations and fatty hilum |
Non–mass–like enhancement (NMLE): an area of enhancement seen only after contrast injection and following the glandular distribution |
Pattern of distribution: focal, linear, ductal, segmental, regional, multiple regions, or diffuse |
Internal enhancement pattern: homogeneous, heterogeneous, stippled, clumped, or reticular |
Symmetry |
1.
Focus: A tiny spot of enhancement <5 mm in diameter is identified as a focus as it is so small that it would be difficult to classify it under other categories and it is also difficult to further assess its borders and internal characteristics. Foci are typically associated with benign fibrocystic changes.
2.
3.
Non–mass–like enhancement (NMLE): It is an enhancement seen after contrast injection that does not have distinct border and cannot be separated from the surrounding glandular tissue. It is usually not detected on pre-contrast images even when correlated with post-contrast images, and it follows the distribution of glandular tissue (Fig. 9.2). This entity is unique to MRI and it is usually not detected with mammography or ultrasound.
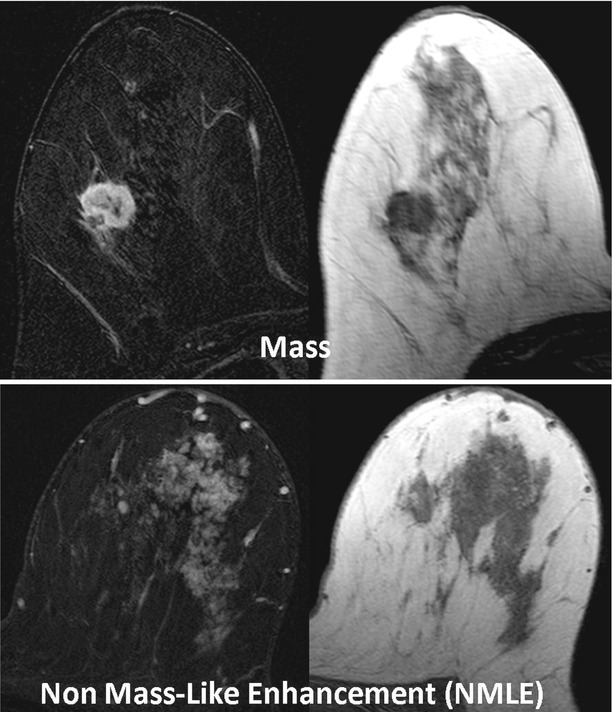
Fig. 9.2
Difference between mass- and non-mass-like enhancement (NMLE). A mass is a space-occupying lesion that has distinct borders and a describable shape. The NMLE is an enhancement that follows the distribution of the glandular tissue with no distinct border or describable shape. Notice that on the non-contrast and non-fat-suppressed T1-weighted image (right side of figure), the mass is recognizable with convex border while the NMLE is not
There are some differences in the reporting system when assessing morphology of masses versus NMLE; therefore, we will discuss their features separately.
Mass
Masses should be assessed for size, shape, margins, and internal enhancement pattern (Box 9.2):
1.
Size: It is recommended to report the three dimensions of the mass: anteroposterior (AP), supero-inferior (SI), and right to left (RL).
2.
Location: There are two systems used to define the lesion location within the breast; the first is the quadrant system, where the breast is divided into five regions: four quadrants (upper outer, upper inner, lower outer, and lower inner) + the nipple and retroareolar region. The second system is the clockwise system where the lesion location is defined as the clock hand position (Fig. 9.3).
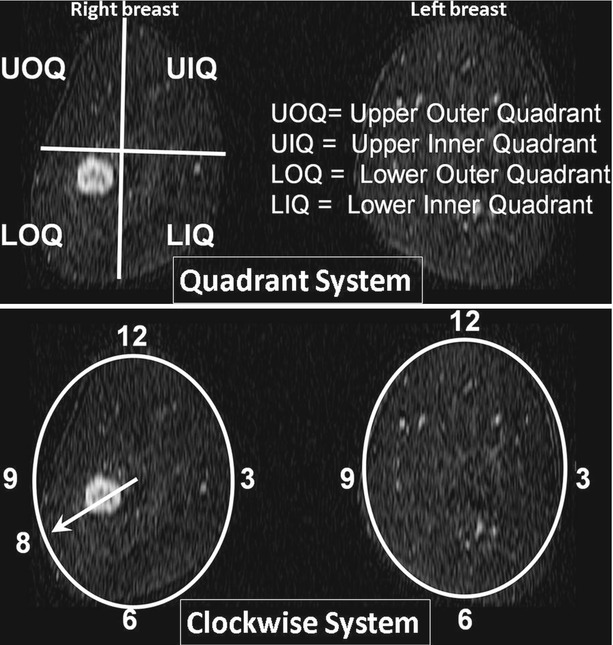
Fig. 9.3
Illustration of the two systems used to define the breast lesion location on coronal reconstructed MR images. The top row is the quadrant system, which divides the breast into four quadrants and the retroareolar region (not shown). The bottom row is the clockwise system, which imagines the breast in coronal orientation as a clock and describes the lesion location as the clock hand position. Notice that the right breast mass is located in the lower outer quadrant or at the 8 o’clock position
3.
Shape: Shape of the mass can be round, oval, lobulated, or irregular.
4.
5.
Internal enhancement pattern: Internal enhancement pattern can be homogeneous, heterogeneous, or rim enhancement (Fig. 9.5). Rim enhancement is the strongest predictor of cancer, with PPV of 70–88 % [7, 9]. It is also important to mention that the total lack of enhancement has a very high negative predictive value that approaches 100 % in some reports [9] (Fig. 9.5).
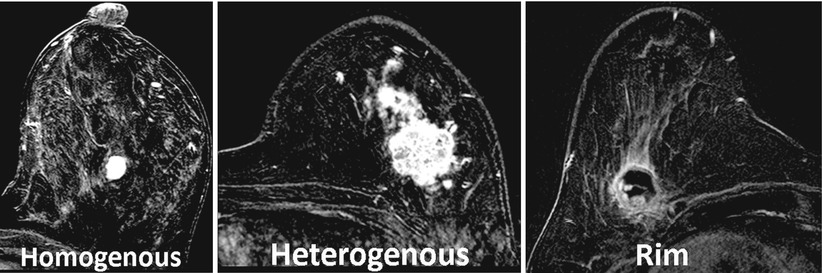
Fig. 9.5
Demonstration of different internal enhancement patterns of masses
6.
Specific benign features of breast masses:
(i)
Non–enhancing T2 dark septations: Non-enhancing septations with low T2 signal are highly suggestive of fibroadenoma [7]. Other features when combined might be associated with fibroadenoma as well such as smooth or lobulated borders with increased T2 signal and a progressive pattern of enhancement. See Fig. 9.6.
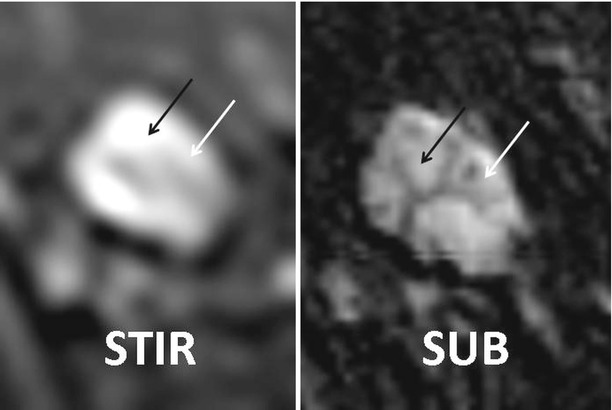
Fig. 9.6
A T2 or STIR bright mass demonstrates dark and non-enhancing septations (arrows), a benign sign that is highly correlated with a fibroadenoma. STIR (short T1 inversion recovery) and SUB (post-contrast subtraction) images
(ii)
Fatty hilum: A fatty hilum is characteristic of a benign lymph node. Lymph nodes usually have high T2 signal and a smooth margin.
Non-Mass-Like Enhancement (NMLE)
For the NMLE breast lesions, the three-dimensional size and location of the NMLE lesion should be reported, in a similar fashion to masses. Additional lesion modifiers are used to describe patterns of distribution and enhancement (Box 9.2):
1.
Pattern of distribution (Fig. 9.7): The pattern of NMLE distribution can be described as focal, linear, ductal, segmental, regional, multiple regions, or diffuse. A focal area of enhancement usually encompasses <25 % of a single quadrant. Linear enhancement, as the name implies, corresponds to a line of enhancement. Ductal enhancement can be in a linear or branching pattern and usually radiates toward the nipple and is believed to conform to a duct. Segmental enhancement is a triangular or cone-shaped enhancement with its apex at or directed toward the nipple. Regional enhancement involves a larger area of enhancement than focal or segmental and has an irregular geographic outline. Multiple regions and diffuse enhancement are even larger and involve the whole or most of the breast. The difference between these two types is that in multiple regions of enhancement, areas of normal glandular or fat tissues separate the multiple regions, while in diffuse enhancement it is widely distributed throughout the breast following the glandular tissue distribution (Fig. 9.8).
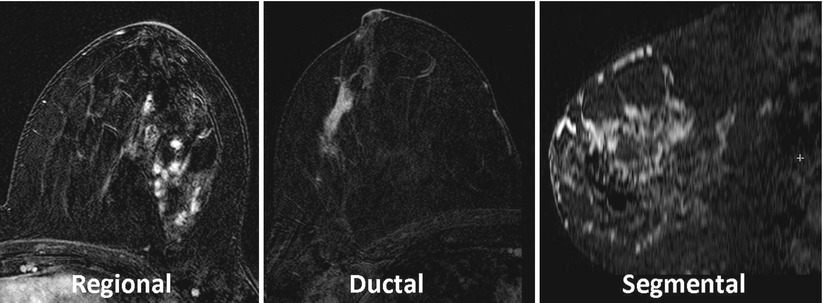
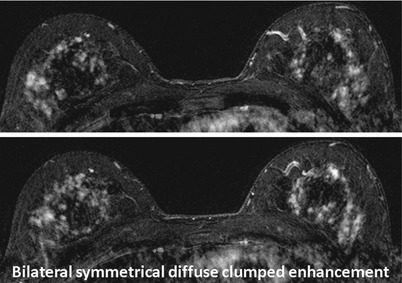
Fig. 9.7
Examples of patterns of distribution of NMLE lesions
Fig. 9.8
Bilateral T1-weighted fat-saturated images after contrast administration show bilateral symmetrical diffuse confluent enhancement. Although the pattern of NMLE is clumped, which is a suspicious pattern, the symmetricity and diffuse distribution of the enhancement lower the level of suspicion. Pathology revealed dense fibrous benign breast tissue
Ductal and segmental enhancements are strong predictors of DCIS with a wide range of positive predictive value (PPV) between 24 and 67 % [8, 10]. It is also important to mention that although there is wide variation in the reported PPV of these two patterns, they are unique to MRI and contribute to the added value of MRI with the high sensitivity in detecting DCIS.
2.
Internal enhancement pattern (Fig. 9.9): The internal enhancement pattern of NMLE can be homogeneous, heterogeneous, stippled, clumped, or reticular. Stippled enhancement corresponds to innumerable small (1–2 mm) punctate dots scattered and widely separated within the enhancing area. This is usually an indicator of benign, fibrocystic changes. Clumped enhancement corresponds to clusters or foci that tend to coalesce. Clumped enhancement is concerning for DCIS, especially if following the segmental distribution. Reticular enhancement corresponds to a dendritic pattern with loss of normal curving pattern of glandular tissue. It is usually found in women experiencing some degree of glandular tissue involution with replacement by fat resulting in scattered glandular tissue within fat.
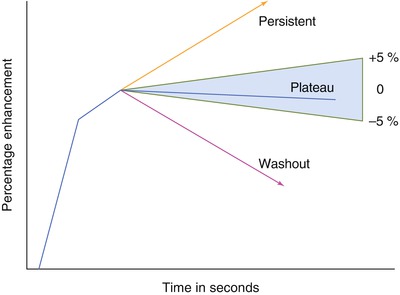
Fig. 9.9
Demonstration of the difference between stippled (scattered punctate, similar appearing enhancing foci) and clumped (cobblestone-like, confluent) enhancement patterns
3.
Symmetry: The symmetry of enhancement is an important indicator of normal glandular tissue distribution and might indicate scanning in the wrong time of the menstrual cycle (Fig. 9.8), i.e., in the secretory phase in the second half of menstrual cycle. Lack of symmetry of the enhancement may raise the suspicion of NMLE.
Dynamic Contrast-Enhanced (DCE) MRI Interpretation
Dynamic contrast-enhanced MRI is an essential component of the clinical breast MRI [11–15] exam. The purpose of the DCE-MRI is to observe the uptake and washout of intravenously injected contrast material of the tissue as an indicator of the perfusion and vascular pattern of the tissue of interest. There are several specific DCE parameters that can be extracted from the DCE imaging series. The main parameter that is universally used in the clinical practice is the time signal intensity curve (commonly called the kinetic curve) [15].
Time Signal Intensity Curve (Kinetic Curve Type)
The kinetic curve type is constructed by plotting the change in signal intensity (SI) resulting from contrast injection (on the Y-axis) over time (on the X-axis) (Fig. 9.10). Most breast centers use the percentage enhancement rather than the crude SI. The percentage enhancement method has many distinct advantages over the SI method by normalizing the SI in the post-contrast image to the baseline SI (pre-contrast), this eliminates the confounding effect of many factors that may influence the SI in both the patient and scanner. Moreover, using the percentage enhancement can measure the initial uptake within the lesion.
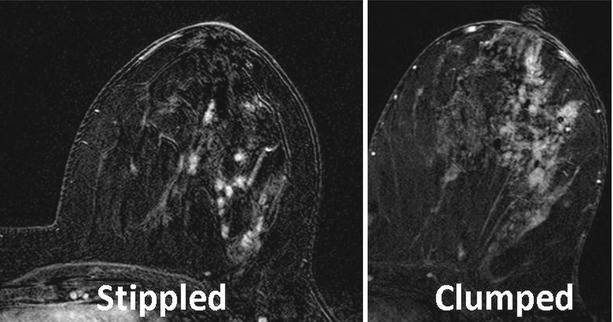
Fig. 9.10
The time to % enhancement graph demonstrates three types of kinetic curve shape. It also illustrates the semiquantitative method for kinetic curve-type categorization based on the change from the peak enhancement to the delayed phase, 5 % on both sides (positive and negative) defined as a plateau, and considering an increase or a decrease of more than 5 % defined as persistently enhancing or washout, respectively
The percentage enhancement is calculated according to the following universal equation [13, 16]:
 where SI pre is the signal intensity in the pre-contrast image, while SI post is the signal intensity in the post-contrast image.
The shape of the kinetic curve is the most widely used parameter to differentiate benign from malignant enhancement patterns and is categorized into three different types (Fig. 9.10):
Type 1 (persistently enhancing): Where there is gradual slow and continuous enhancement along the DCE series time. This type is further categorized into type 1A and type 1B according to the enhancement pattern in the first 2 min. In type 1A the enhancement is slowly progressing, while in type 1B there is an early marked enhancement, sometimes exceeding 80 % percentage enhancement, followed by a slower continuous enhancement (Fig. 9.10). Both types 1A and 1B are considered a good predictor of a benign enhancement pattern with a 94 % negative predictive value (NPV) [15] unless morphological features indicate otherwise.
Type 2 (plateau): Where there is an intense early enhancement (in the first 2 min) ≥80 % percentage enhancement followed by persistence of enhancement along the rest of the DCE series. This type of curve carries intermediate probability as this enhancement pattern has been demonstrated in both benign and malignant lesions. When morphological features are suggestive of malignant process, this kinetic curve shape is considered supportive of malignancy; however, when morphological features are indeterminate, further workup should be considered.
Type 3 (washout): Where there is an intense early enhancement ≥80 % followed by a decrease in the percentage enhancement (washout). This type reflects the expected vascular pattern of malignant tumors and is considered a strong indicator of malignancy with 87 % PPV [15].
Although kinetic curve shape is the most important parameter of DCE-MRI interpretation, it is commonly assessed qualitatively (subjectively). The qualitative assessment of kinetic curve shape is frequently reported to widely vary among readers and even among different readings of the same radiologist and is expected to depend on the experience of the radiologists [11, 14, 15, 17].
Semiquantitative Method (Fig. 9.10)
The assessment of the kinetic curve shape can be performed with a more quantitative (objective) approach which makes it independent of observer’s subjectivity, as was proposed in the literature [18]. Two parameters were calculated from the kinetic curves: the average washout slope and the absolute washout percentage enhancement difference. The enhancement difference is an easier and more practical method and it is calculated as the difference between the peak percentage enhancement and the mean value of the last three time points (in the high temporal resolution DCE series). The percentage enhancement cutoff point is 5 %, so if the percentage enhancement difference is between −5 and +5 %, the kinetic curve shape is categorized as plateau (type 2), while if it is > +5 %, the curve type is 1 for persistently enhancing. An example of the semiquantitative categorization is shown in Fig. 9.10.
The Wash-In Rate and Early Peak Percentage Enhancement
Wash-in rate is the rate of change of the tissue SI over time in seconds within the first 2 min after contrast injection, while the peak percentage enhancement is the highest enhancement within the first 2 min. Wash-in rate is categorized into slow (initial enhancement <60 %), intermediate (initial enhancement 60–80 %), or fast (initial enhancement >80 %) [15]. Lesions that show early intense enhancement are highly suspicious for malignancy. The percentage enhancement >80 % in the first 2 min is suspicions for malignancy.
Washout Rate
Washout rate is a quantitative assessment of the delayed phases of the DCE series (washout portion). Washout curves (type 3) showing negative washout rates are considered high predictor for malignancy, while persistently enhancing (positive washout rates) curves type 1 are considered a good predictor of benign behavior.
Enhancement Pattern
The enhancement pattern describes the direction of filling (enhancement) of the enhancing lesion through different phases of the DCE-MRI series [16, 19]. The pattern of enhancement can be described as centripetal or centrifugal:
In centripetal pattern, the lesion starts enhancing from the periphery and progresses to the central portion and may suggest malignant pattern of enhancement (Fig. 9.11).
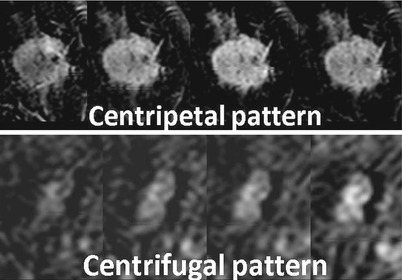
Fig. 9.11
Demonstration of the two enhancement patterns: centripetal (from the periphery to the center) and centrifugal (from the center to the periphery). The top row is an invasive ductal carcinoma and the bottom row is a fibroadenoma
In centrifugal pattern, the lesion starts enhancing from the center and progresses to the periphery and may suggest a benign pattern (Fig. 9.11).
Unilateral Increased Vascularity
To assess the breast vascularity, a maximum intensity projection (MIP) image can be generated [20, 21], and vascularity of both breasts can be compared. Breast vascularity scoring is then determined [21] depending on number of vessels per breast that are ≥3 cm in length and ≥2 mm in maximum transverse diameter (Table 9.1). When the difference in number of vessels between the two breasts was ≥2, it was considered positive for unilateral increased vascularity of the breast, and the breast with a higher number of vessels was considered suspicious for harboring a malignant lesion (Fig. 9.12).
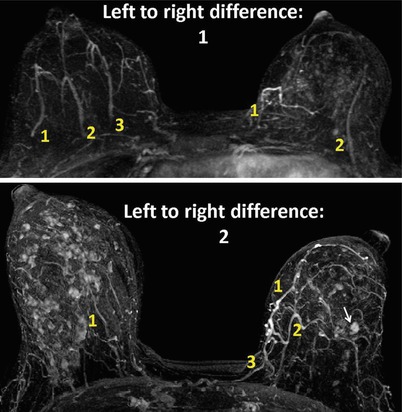
Table 9.1
Vascularity map scoring
Vascularity map scoring | |
|---|---|
Score 0 | Absent or very low vascularity (no vesselsa) |
Score 1 | Low vascularity (only one vessela) |
Score 2 | Moderate vascularity (2–4 vesselsa) |
Score 3 | High vascularity (>5 vesselsa) |
Fig. 9.12
Illustration of the unilateral increased vascularity sign. Vessels that meet two criteria (length 3 cm or longer and thickness 2 mm or thicker) are counted on each side (yellow numbers). Then the difference between the side of interest (with a suspicious lesion) and the contralateral side is calculated. A difference of two or more increases the suspicion of malignancy. The top image shows a difference of one, and the lesion in the left side was found to be benign. The bottom image shows that the left breast has two more vessels meeting the criteria which denote a positive left-side unilateral increased vascularity and the lesion (arrow) was proven to be infiltrating ductal carcinoma
ACR BI-RADS-MRI Impression
The overall assessment of the breast MRI exam should be reported according to the following BI-RADS classification:
BI–RADS 0: Need additional imaging evaluation. That may include repeating the MRI scan if not technically satisfactory or getting a second-look ultrasound.
BI–RADS 1: Negative. This indicates normal exam with a recommendation to return to routine screening.
BI–RADS 2: Benign findings. This indicates that lesions with benign features but no lesions with malignant features were noted with a recommendation to return to routine screening.
BI–RADS 3: Probably benign with low probability of malignancy. Short interval follow-up would be recommended.
BI–RADS 4: Suspicious findings. Lesion has moderate probability of malignancy but no confirmatory method was performed. Biopsy should be considered.
BI–RADS 5: Highly suggestive of malignancy and appropriate action should be taken.
BI–RADS 6: Known biopsy proved malignancy and appropriate action should be taken.
Future Directions
Pharmacokinetic Modeling
Pharmacokinetic modeling is based on the analysis of the enhancement kinetics to characterize tissue perfusion. Pharmacokinetic modeling offers many advantages over the typical qualitative assessment of the DCE-MRI studies; it provides quantitative parameters that reflect physiological and anatomical information about the lesion. These parameters are expected to be more independent of the scanner hardware and software. They allow characterization of breast lesions and enable the assessment of treatment response in a setting of neoadjuvant therapy of breast cancer [22, 23].
Scanning Recommendation
1.
The baseline T1 mapping sequence: Pharmacokinetic modeling relies on accurate calculation of contrast material concentration within the tissue of interest in each dynamic phase. The simplest way to measure the change in contrast material concentration along time is to assume that the change in T1 is directly proportional to the contrast material concentration with the tissue of interest. Because of the fact that the relationship between the contrast concentration and SI is not linear, a baseline T1 map is generated for an accurate measurement of contrast concentration [24–27].
2.
The dynamic series: It is recommended to include a large blood vessel within the field of view of the DCE series to allow measurement of the vascular input function (VIF), contrast material concentration in the plasma over time. The VIF is used to calculate the contrast material concentration gradient (between the blood and lesion), which enables accurate pharmacokinetic modeling analysis [28, 29].
Pharmacokinetic Parameters
The three main quantitative parameters that are extracted from the DCE-MRI data using the pharmacokinetic analysis are as follows:
1.
K trans (transfer constant): the rate of contrast agent transfer from plasma compartment to extravascular extracellular spaces (wash-in rate).
2.
K ep (rate constant): the rate of escape of contrast agent from the extracellular spaces to the plasma compartment (washout rate). K ep is the ratio of the transfer constant to the extravascular extracellular space fractional volume (v e).
3.
V e (extravascular extracellular space volume): volume of the interstitial tumor space.
4.
Peak enhancement: maximum tissue enhancement.
5.
Initial area under the curve (IAUC): Another method for quantitative assessment of DCE-MRI is the measurement of IAUC of the contrast agent concentration across the early acquisition phase (within the initial 2 min after contrast injection). It was reported to be reproducible and correlated well with tissue permeability, especially when normalized to the surrounding normal tissue [30].
Visual Display (Fig. 9.13)
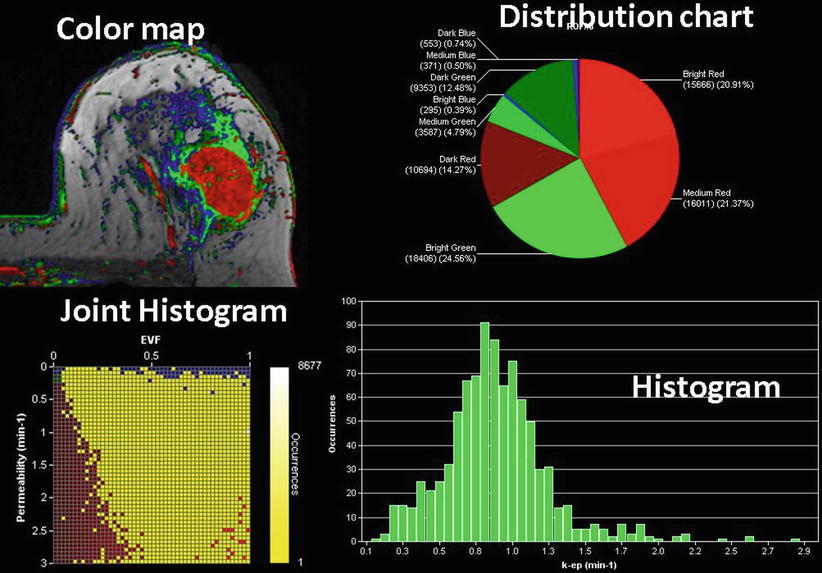
Fig. 9.13
Computer-assisted diagnosis (CAD) demonstrates different visual display options of the quantitative data from the pharmacokinetic analysis of DCE-MRI series, a color map, pixel color distribution chart, joint histogram of permeability and extracellular volume fraction EVF, and a k-ep histogram
1.
 Breast Cancer Genetics and Risk Assessment
Optimizing Mammographic Screening and Diagnosis of Breast Cancer
Emerging Technologies in Breast Imaging
Imaging of the Symptomatic Breast in the Young, Pregnant, or Lactating Woman
Mammography Techniques, Positioning, and Optimizing Image Quality
The Postoperative Breast
Breast Cancer Genetics and Risk Assessment
Optimizing Mammographic Screening and Diagnosis of Breast Cancer
Emerging Technologies in Breast Imaging
Imaging of the Symptomatic Breast in the Young, Pregnant, or Lactating Woman
Mammography Techniques, Positioning, and Optimizing Image Quality
The Postoperative Breast


Color maps: Pharmacokinetic model while attempting to simulate the physiology of the MRI contrast agent distribution within the breast tissue calculates multiple parameters that describe contrast delivery, accumulation, and washout. To simplify the clinical interpretation of this complicated multiparametric analysis, color maps reflecting pharmacokinetic information were introduced into clinical settings. Color maps are constructed by representing the combined values of K trans (permeability) and V e (extracellular volume fraction (EVF)) on a voxel level, using cutoff values. Color red indicates high permeability and low extracellular volume fraction typically seen in cancer, while color blue indicates low permeability and high extracellular volume fraction typically seen in benign tissues. Color green reflects intermediate values for permeability and extracellular volume fraction. Color maps enable radiologists to accurately place the ROI on the most suspicious part of the lesion instead of the usual method of placing ROI randomly (Fig. 9.13).
Related posts:
Breast Cancer Genetics and Risk Assessment
Optimizing Mammographic Screening and Diagnosis of Breast Cancer
Emerging Technologies in Breast Imaging
Imaging of the Symptomatic Breast in the Young, Pregnant, or Lactating Woman
Mammography Techniques, Positioning, and Optimizing Image Quality
The Postoperative Breast
Stay updated, free articles. Join our Telegram channel
Full access? Get Clinical Tree
