Fig. 4.1
Schematic description of the main components in digital mammography, from X-ray tube to image display. The image acquisition, display, and storage can be optimized separately in digital mammography, unlike screen-film mammography where they are integrated in the film
Although, DM is superior to SFM in many aspects, its clinical performance is still less than perfect. The digital technology provides a platform that allows development of different technologies to facilitate early-stage detection of breast carcinoma. As such, in recent years digital breast tomosynthesis (DBT) has been developed for three-dimensional visualization of the breast. DBT produces a set of images (e.g., 9–25) acquired along a limited arc that is reconstructed into a 3D volume. The images have a high in-plane spatial resolution as determined by the detector system, while the depth resolution, which depends on system geometry, acquisition technique (number of views and angular range), and reconstruction algorithms, is lower but substantially increased in relation to 2D mammography. Aside from this, advantages of DBT include that it is integrated on units that have a dual functionality in that both DBT and DM can be performed on the same system. A combination of tomosynthesis and complementary technologies, e.g., optical procedures, nuclear medicine methods, X-ray contrast media, ultrasound, and computer-assisted diagnosis, may further increase the imaging information. In the following text section, technical aspects in DBT imaging are described.
Advancement of Digital Breast Tomosynthesis
History of DBT Imaging
Based on a sequence of projection views acquired during a single X-ray scan, tomosynthesis (a combination of two Greek words “tomos”—a section, slice, or a cutting—and “synthesis”—a process, resulting in formation of something new) permits any plane to be visualized in the imaged object. The principles of tomosynthesis were proposed by Ziedses des Plantes in the early 1930s who also built a tomography-based unit (i.e., the planigraph) [45, 46]. Three decades later the first tomosynthesis images were produced in an experiment performed by Garrison et al. [47] and reconstruction methods were presented [48]. From that point tomosynthesis underwent development in various periods of time. During the 1970s and 1980s, much of the research aimed at improving image quality and optimizing examination times, making tomosynthesis a potential candidate for a wide range of clinical applications. Various systems evolved in experimental settings using screen film, computed radiography detectors, and image intensifiers, but the need for acquiring multiple images made the procedure in these systems too time-consuming with a film change in between each exposure or nonoptimal in image quality for most clinical applications [49]. In addition, the possibilities for post-processing of the images were limited. Although these early systems have provided essential proof of concept, tomosynthesis imaging for clinical use is dependent on a digital detector with rapid readout capabilities, high-dose efficiency (detector quantum efficiency6; DQE), and low noise, allowing low-dose projections to be acquired under geometric stability. Because of lack of such detectors and since the popularity of computed tomography (CT) was rising, there was a marked reduction in research and development of tomosynthesis in the later 1980s. The situation changed substantially in the late 1990s, due to the development in flat-panel radiographic digital detectors with the appropriate qualities. The improvements in computers with regard to graphic cards, processing speed, random-access memory7 (RAM), storage capacity, etc. have further enabled the rational use of the technique during the late 1990s. Initially, prototype tomosynthesis units with flat-panel detectors were developed for research and optimization purposes with a large degree of freedom in varying parameters, which was followed by commercialized units [50]. Tomosynthesis has been applied to several clinical applications over the years, including chest, bones, angiography, and dental imaging, and has emerged as a highly promising method in breast imaging.
Technical Aspects
Basic Imaging Procedure
As shown in Fig. 4.2, the basic equipment for digital breast tomosynthesis (DBT) image acquisition geometry is the same as that of 2D mammography but differs primarily in the rotation of the gantry and in acquisition of multiple images at various angles.
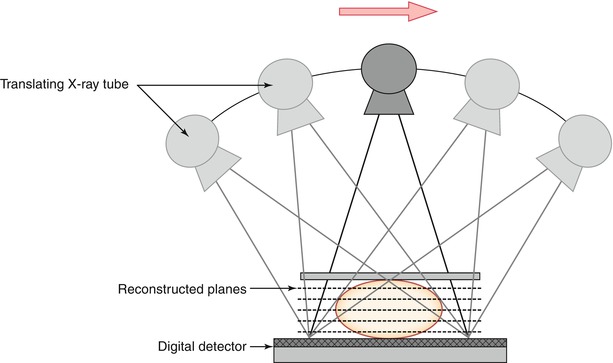
Fig. 4.2
Schematic geometry for digital breast tomosynthesis (DBT) acquisition. The X-ray tube moves (arrow) in an arc and information from multiple projection views are collected by a single digital flat-panel detector that can be static or rotating. The detector can be based on selenium alone, on cesium iodide crystals, on a silicon layer, or on photon-counting linear detectors. The latter provide low scatter signal with no electrical noise and may inherent energy resolution that is used in contrast-enhanced imaging to produce images at different energies. See Ref. [50] for further discussion on this
While the breast is being compressed and the detector is held in a fixed position, the X-ray tube translates over a limited angular range that can vary from 11° to 60° (manufacture dependent) and a low-dose exposure is made at every few degrees [51, 52]. Since DBT is a 3D imaging device, it might be desirable to use lower breast compression force than in 2D digital mammography. In 3D imaging, a lower compression force could be useful since it allows a greater depth within the breast volume (e.g., larger separation of the structures in the z-direction), which potentially can help to visualize obscured or partially obscured structures further. A couple of studies have addressed this question. Still, the lesser compression force needs to be weighted properly against the potential increase in average glandular dose (AGD) to the breast and possible degradation in image quality that originate from the increase of scattered radiation. The detector can be stationary or rotate with the tube during exposure; a moving detector results in a larger field of view, which might help to ensure that tissues located in the periphery of the breast are included. The fast readout employed in the detector permits the information from each exposure to be extracted and stored prior to next exposure. In this way, a series of low-dose images are obtained, usually 9–25, that differ individually in depth information throughout the breast volume [51]. Many of the DBT parameters can be varied, which include the number of projection images and angular range. To a certain extent, a wider angular range offers increased separation of the breast tissues in depth and allows thinner slices to be reconstructed, while a larger number of images provide a better image quality [53]. The total radiation dose from the low-dose projection images is usually within the range of that from one to two standard mammograms. Low-dose imaging in DBT is possible because the image information in the reconstruction is additive, but as with other X-ray techniques, there is a trade-off (quantum mottle) where the appearance of image noise is noticeable and image quality degraded. With regard to the movement of the X-ray tube during DBT acquisition, different manufacturers have adopted one of two principles, based either on continuous movement or on step-and-shot movement in which the tube stops prior to each individual exposure [52]. Important considerations in the system design for continuous movement are that sufficiently short X-ray pulses are used and that the X-ray tube translates at an appropriate speed. If these two parameters are nonsynchronized, it could cause lack of sharpness in the images. Conversely, if the step-and-shot acquisition is applied, it is important that the gantry is stationary prior to the following exposure. If not, vibrations induced by the prompt stop could cause blur in the images. In general, short exposure times are necessary to obtain sharp images and since data acquisition using the step-and-shot method typically is longer, there is also a greater risk of more image artifacts induced by patient motion [54]. There is ongoing research and development on alternatives to the previously described acquisition methods. One proposed solution that avoids the problems in gantry movement and potential unsharpness in the images is a system based on a stationary array of X-ray sources [55], with the multiple X-ray sources already located in the various exposure angles. Qian et al. [55] have shown that this geometry yields higher modulation transfer function (MTF) over rotation-based systems and increases the sharpness of microcalcifications.
Image Reconstruction
The basic concept of DBT reconstruction is illustrated in Fig. 4.3. A set of projection images is acquired of the breast (in practice, typically 9–25). A DBT slice is created by summing information from the individual projection images about the same tissues (synthesized information). In the DBT slice of the lesion, the lesion contrast is enhanced, while the normal tissue is smeared out (Fig. 4.3). The same principle applies when the focus plane (slice) of the normal tissue is reconstructed. Shifting and adding the projection images repeatedly form a complete set of slices that describes the entire breast volume. The thickness of the reconstructed slices may vary, but typically, images are reconstructed with a slice separation of 1 mm. As such, a 40 mm thick compressed breast will be presented to the breast imager as a stack of at least 40 reconstructed images (slices).
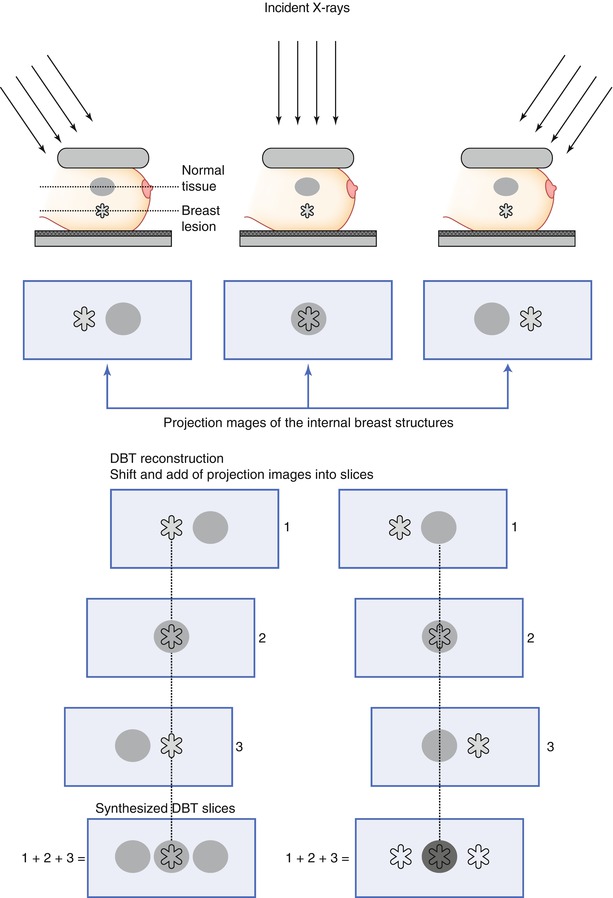
Fig. 4.3
Illustration of the basic image reconstruction in digital breast tomosynthesis. Images are acquired at different exposure angles and projection images collected. In the reconstruction, the projection images are shifted and added, which yields increased information of the breast structures. In the schematics, two slices are reconstructed: the in-focus plane of the lesion (left) and the in-focus plane of the normal tissue (right), which are enhanced in each DBT slice, respectively. (1–3) Number of projection images
There are two main benefits in the reduction of tissue overlap. First, in women with parenchymal densities that lie above or below a breast cancer, it yields a better differentiation of the lesion and benign or normal tissue, as illustrated in the schematics (Fig. 4.4a) and in a clinical case (Fig. 4.4b). Second, overlying normal structures that yield an appearance in 2D mammography that is suspicious for cancer may be resolved as superimposed glandular tissue in DBT (schematics and case; Fig. 4.5a, b).
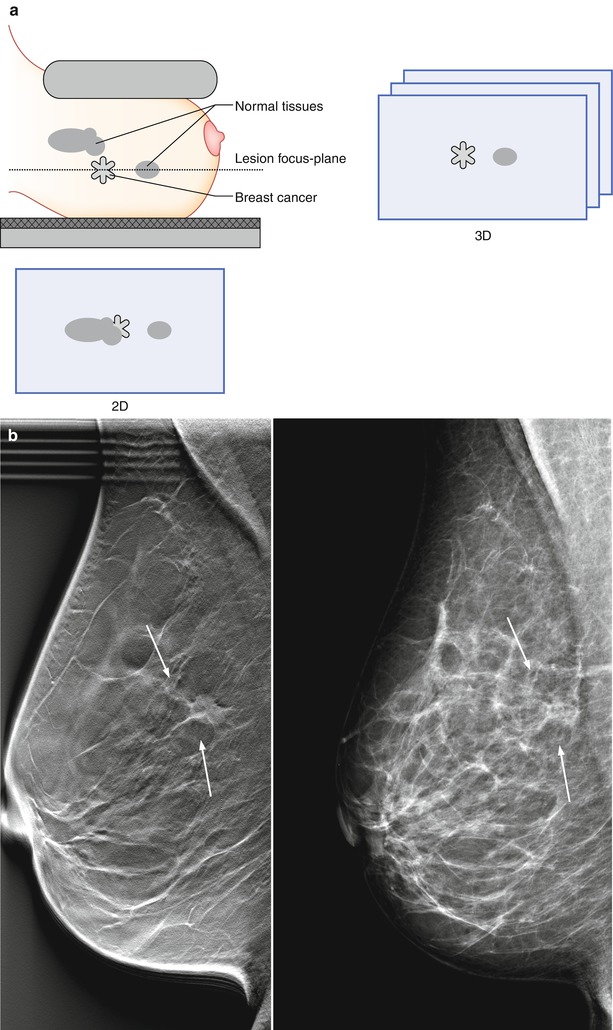
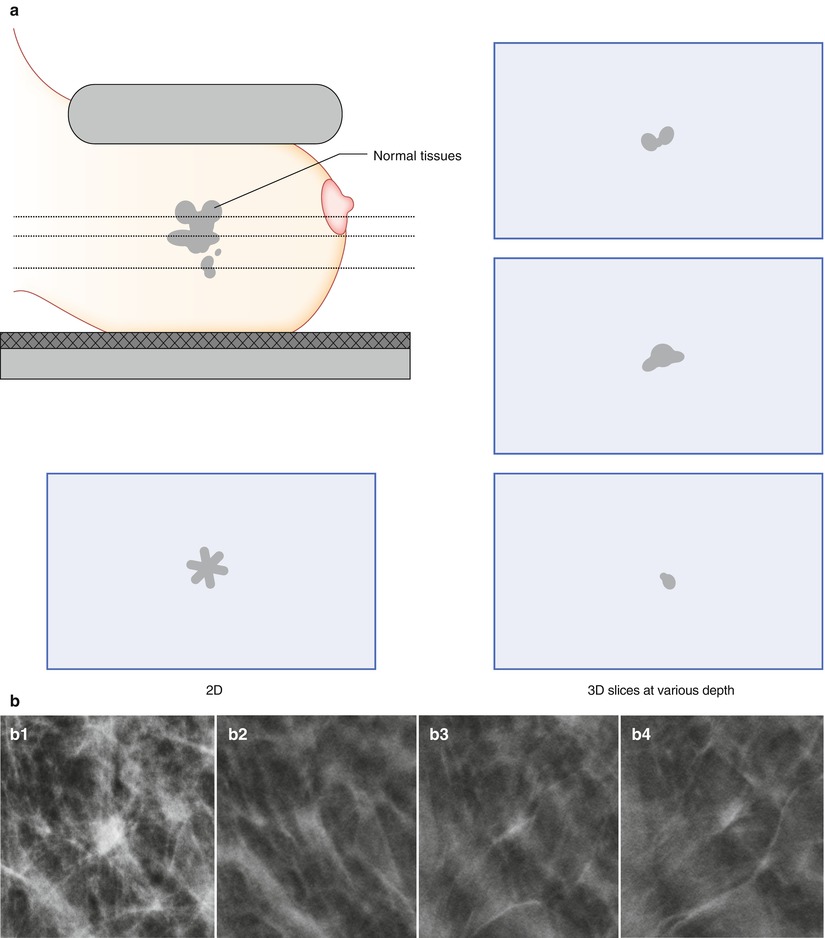
Fig. 4.4
(a) A breast cancer partially concealed by normal tissues in 2D mammography has a greater chance of becoming visible with 3D digital breast tomosynthesis (DBT). (b) A 62-year-old female with a 15 mm spiculated invasive lobular carcinoma (indicated by the arrows) imaged by digital breast tomosynthesis (left) and 2D digital mammography (right). The breast lesion is conspicuous in DBT, but lacks in contrast and edge characteristics in DM. The individual DBT slice contains less fibroglandular tissue than DM
Fig. 4.5
(a) Normal tissues that are superimposed onto the 2D plane in 2D mammography may appear as an asymmetry that can result in an unnecessary recall of patient. In 3D imaging, the normal tissues can be better depicted to the radiologist by viewing them at different depths. (b) (1–4). Superimposition of normal tissues can lead to an asymmetry in 2D (b1) that is resolved as overlapping glandular tissue in 3D (b2–b4) (b2–b4: Images courtesy of Dr. Liane Philpotts and Dr. Brian Haas, Yale University, New Haven, USA)
Grant developed one of the first reconstruction algorithms for tomosynthesis imaging in 1972, e.g., the shift-and-add method (Fig. 4.3) [56]. Based on his work, several variants of the method followed. Multiple variants of reconstruction techniques have been tested or used in DBT imaging that estimate the 3D distribution of the tissues in the breast additively [51]. The two most common types of methods in commercially available DBT systems and prototype units are the filtered back projection (FBP) technique, which is an analytical method, and algebraic iterative reconstruction methods [51]. Unlike the one-step operation in FBP, an iterative algorithm performs the reconstruction in a recursive fashion, e.g., repeatedly updated until it converges to a solution. Both types of algorithms have their own pros and cons. In general, FBP offers speed and ease of implementation, while iterative algorithms have potential to yield a better image quality by yielding lower image noise and reduced artifacts, but it also requires more computational power or time. If DBT is to be used in the screening, it is essential to keep the time required for this post-acquisition processing step as low as possible. In recent years, the increase in computer processing speed and GPU-based image reconstruction has reduced the reconstruction time considerably, which is noticeable for iterative methods, in particular. However, more progress is underway [57, 58]. Most algorithms have a number of refinements (filters) implemented to remove image artifacts and improve image quality for presentation purposes, which can affect the quality of the reconstructed slices substantially. A general difficulty in the development of algorithms is to optimize them for all structures in the breast. For example, some methods visualize soft tissue components of low contrast better, such as masses, while other algorithms do a better job on smaller structures of high frequency, e.g., calcifications. Wu et al. [59] compared the standard back projection (BP), FBP, and the iterative maximum likelihood expectation maximization (MLEM) reconstruction methods in phantoms and in patient images and found that the BP algorithm resulted in the best in-plane image quality for low-contrast masses but resulted in more out-of-plane artifacts. The FBP algorithm performed better than BP for calcifications, while the iterative MLEM algorithm provided a high image quality with regard to both masses and calcifications. The development of tomosynthesis reconstruction algorithms is challenging, since data of only a limited number of low-dose projections are available. This type of data is where iterative methods could be useful the most; however, improvements in faster analytical methods have also been done. Since the clinical application of tomosynthesis is relatively new, continued work is needed.
Reconstruction Artifacts
One common phenomenon associated with digital breast tomosynthesis (DBT) is that the reconstructed images contain a certain degree of artifacts, mainly caused by the incomplete sampling during DBT image acquisition. Some of the artifacts can potentially obscure the breast tissue details and interfere with radiologist visual interpretation of subtle mammographic features. In-plane artifacts refer to falsely reconstructed signals arising from an object, e.g., a mass or calcification, contained within the same image plane as the object itself and can appear as either darker than the object from which they arise (Figs. 4.6 and 4.7a–c) or brighter, which depends on whether it is more or less attenuating than the surrounding tissue. Out-of-plane artifacts refer to falsely reconstructed signals arising from an object and contained within planes other than the object itself. They typically appear as multiple repeated ghost images, which gradually are smeared out (Fig. 4.7a–c). Both types of artifacts appear along the scan direction of the DBT system and are more pronounced for structures of higher contrasts, particularly large benign calcifications.
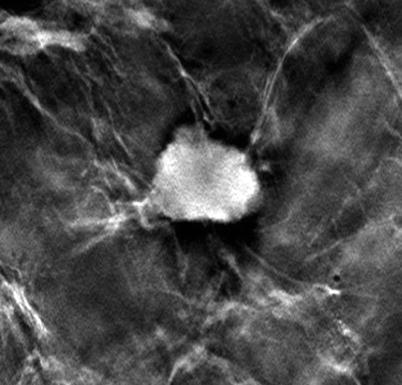
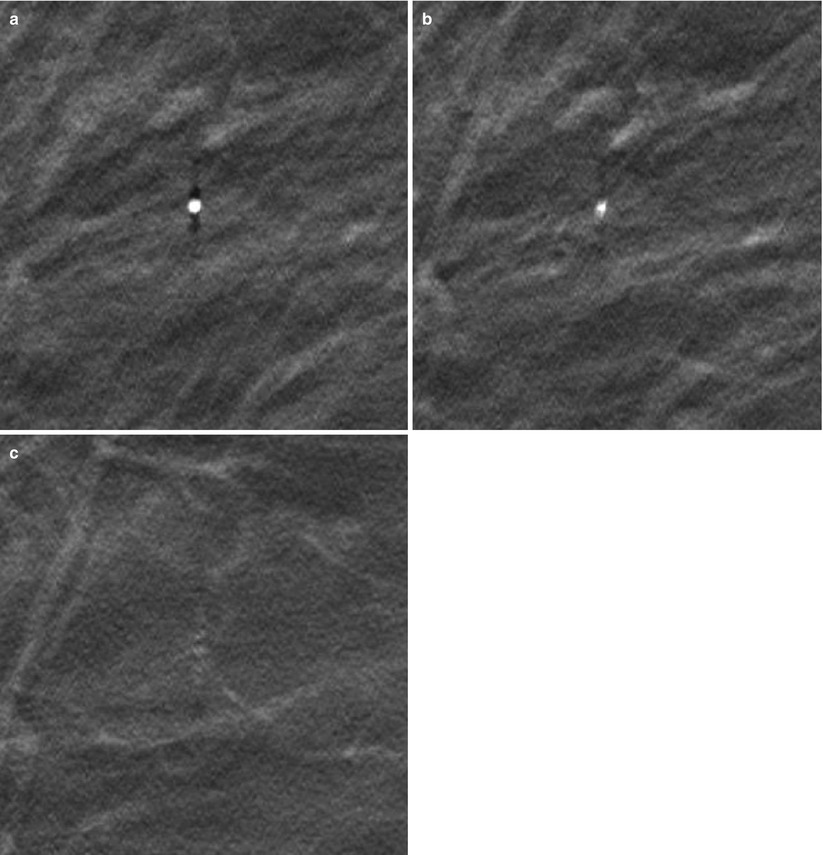
Fig. 4.6
In-plane artifacts surrounding an invasive lesion within a mastectomy specimen in DBT. The artifacts appear as dark rims in the scan direction
Fig. 4.7
(a) A calcification in its focus plane (a), (b) the slice 3 mm below and (c) 7 mm below the focus slice. The calcification is surrounded by in-plane artifacts (dark shadows) in (a) and out-of-plane artifacts can be seen in (b, c) as ghosting images that are gradually smeared out
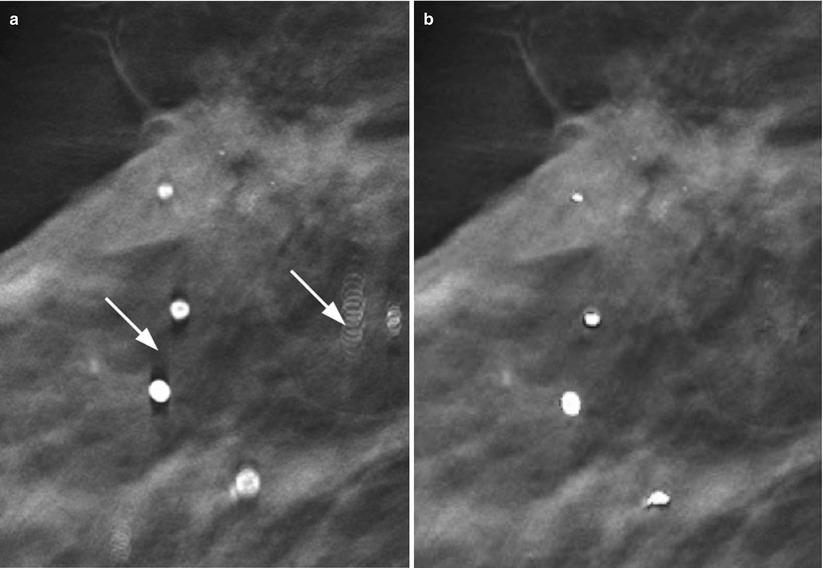
Several investigators have demonstrated that the nature of the artifacts is dependent both on the parameters used for image acquisition (e.g., angular range, number of images acquired during a scan, etc.) and on the image reconstruction method used. Iterative methods such as simultaneous algebraic reconstruction technique and maximum likelihood expectation maximization have in some studies shown to reduce the artifacts more than the filtered back projection technique [59–61], and integrated methods have been proposed (Fig. 4.8a, b). Alternatively, the artifacts can be suppressed by displaying thicker slices of the breast. It should be noted, though, that the use of thicker slices might suppress other relevant information in the images.
On one hand, these artifacts represent erroneously reconstructed signals, and the general aim is to attempt to minimize them, but on the other hand, since the peak values of the in-plane artifacts are situated at the edge of the breast lesion (Figs. 4.6 and 4.7a–c), they serve to some degree as edge enhancers, which may in turn increase the detection of some lesion types. The true effect of the artifacts on visualization of breast cancers remains to be studied.
Image Interpretation
As in 2D digital mammography, the digital breast tomosynthesis (DBT) image volume is interpreted in soft-copy format, using high-resolution monitors. It can be displayed in dynamic cine mode, which sequentially displays the slices automatically in a movie-like fashion, or they might be rendered through manually, slice by slice. The radiologist can scroll back and forth in the breast volume and, as in DM, use tools of pan, windowing and leveling, and zoom. These tools may also be altered in the dynamic mode. Alternatively, the tomosynthesis image volume can be reviewed at various slice thicknesses, also called slabs. A lesion is usually contained within multiple slices. A single tomosynthesis slice, however, describes only a cross section of the lesion. Hence, if several consecutive slices with a finding are added together, it may be enhanced further. The desired slice thickness can be reconstructed instantly at the workstation. Using thicker slices produces fewer images of the breast volume and allows faster image rendering. While thinner slices may be helpful for visualization of details such as morphology, thicker slices may increase lesion contrast or facilitate an overview of calcifications that are spread out at various depths (Fig. 4.9a–c). The slabs can be produced in different ways. Two common algorithms are the maximum intensity of projections (MIP) and simple averaging. The MIP provides high contrast, but results in an elevated noise level. On the contrary, the average algorithm results in lower contrast at a lower noise level. In a comparative study, the MIP provided best visualization of calcifications, while averaging was found to best visualize well-circumscribed or spiculated masses [63].
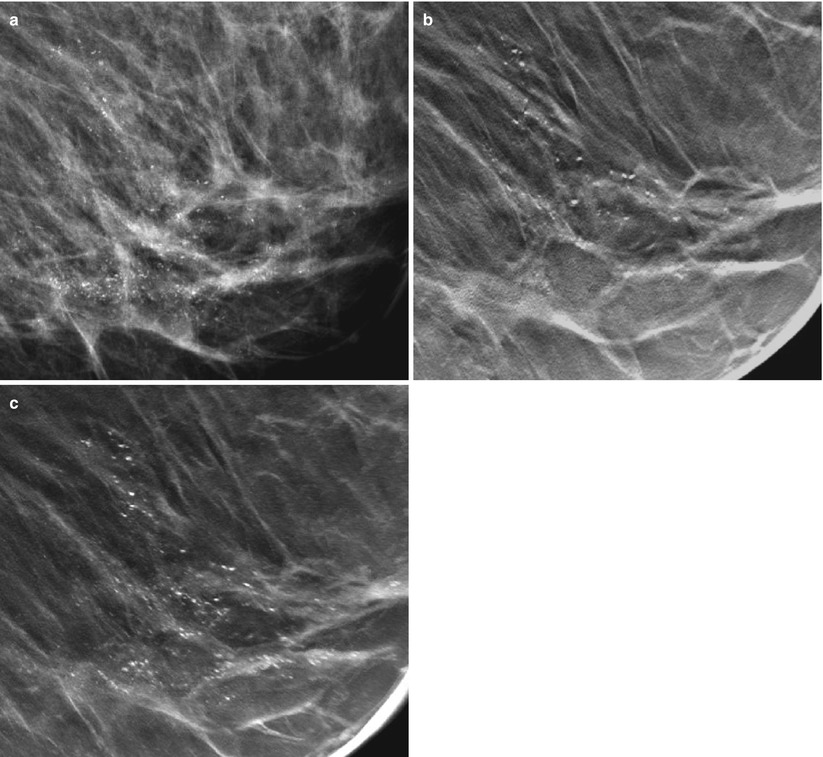
Fig. 4.9
(a) A 60-year-old female with a 40 mm DCIS indicated by microcalcifications located in the lower medial quadrant of the breast, imaged by DM (a) and DBT (b, c). (b) A central DBT slice has been extracted within the cluster of calcifications. (c) Slices have been added together using the maximum intensity of the projections. The most characteristic calcifications are seen with the comedo type of DCIS, which vary in size, form, and density and are clustered with partly ductal (linear) orientation
Synthesized 2D Images
It is possible to reconstruct 2D images from the 3D DBT image set. The concept is founded on the usefulness of reviewing 2D images in combination with DBT. A hybrid of the imaging modalities may speed up the assessment of calcifications and yield a more immediate overview of the breast. The synthesized 2D would be helpful in decreasing the radiation dose to the breast up to 50 % for two-view imaging, compared to if a set of 2D mammography images would be acquired. Gur et al. [64] found a lower sensitivity at a comparable specificity in an early study evaluating the performance of the synthesized 2D images in relation to standard 2D mammography images. However, the algorithm generating the 2D images has been developed since then and was recently used in screening trials [65, 66] (Fig. 4.10).
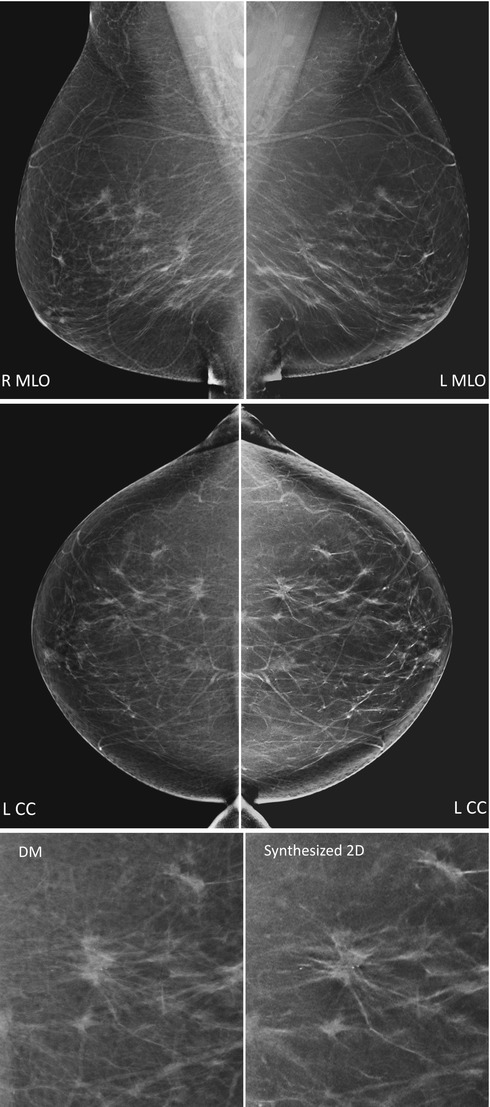
Fig. 4.10
Digital mammography (left) and synthesized 2D (right) mirrored in mediolateral oblique (MLO, top) and craniocaudal (CC, middle) views. The synthesized 2D images have been reconstructed from the series of tomosynthesis projection images. Close-ups (bottom) of the CC images show a spiculated invasive tumor with calcifications (Images courtesy of Professor Fiona Gilbert, University of Cambridge, Cambridge, UK)
Clinical Studies of Breast Cancer Detection, Efficiency, and Aspects of Imaging Protocol
Introduction
Poplack et al. [67] performed one of the first clinical studies on patients that compared digital breast tomosynthesis (DBT) and conventional two-dimensional (2D) mammography. Image quality and recall rates were compared in images of 98 patients. The patients were selected consecutively from the screening program when the mammogram was interpreted as being abnormal. DBT and screen-film mammography (SFM) were compared in image quality, which included lesion conspicuity and feature analysis. The need for recall was assessed when DBT was combined with digital screening mammograms (DM). Image quality of DBT was similar (n = 51) or superior (n = 37) to SFM in 89 % of the cases. The numbers of recalls were reduced by 40 % when DM was supplemented with DBT. It was concluded that DBT has similar or superior image quality compared to SFM in a diagnostic setting and has potential to reduce screening recall rates when used in combination with digital screening mammograms. A number of retrospective studies on breast cancer detection have followed that compares the diagnostic tests of tomosynthesis and mammography. Interpretation is done in a blinded fashion, usually by multiple radiologists independently to account for reader variability.
Reported Studies in 2008–2013
Table 4.1a, b show results of studies reported in 2008–2013 comparing DBT and conventional DM in breast cancer detection. The studies have been stratified according to (1) those that evaluated tomosynthesis alone, performed in one or in two views (Table 4.1a), and (2) those that evaluated tomosynthesis in adjunct to mammography (Table 4.1b). When the same populations of cases and readers have been used on several imaging modalities (paired study design), it allows for a matched comparison. Hence, if studies are listed in both tables by the same authors, the order of imaging modality in performance may be of interest. The tables show the results in increase (+) or in decrease (−) in performance measures using DBT in relation to conventional DM. The most common measures that have been used are presented: diagnostic accuracy (i.e., the radiologist’s ability to discriminate between abnormal and normal/benign cases, fourth column), sensitivity and specificity (fifth column), and recall rate for assessment (sixth column). When statistical significance (p < 0.05) has been achieved, the value is indicated with an asterisk*. As the sensitivity and specificity measures are correlated and depend on the individual threshold of the radiologist, it is valuable to use combined performance measures (denoted as diagnostic accuracy). Diagnostic accuracy has been estimated by the area under the ROC curve or by area under the alternative free-response ROC curve (applied in JAFROC analysis). The main difference in between the methods is that the ROC method considers the cases as a whole (e.g., if they are abnormal or normal/benign), while the free-response method also considers the locations of individual breast cancers, e.g., the radiologist needs to indicate the location of the finding [84]. By considering individual breast cancers, the free-response method assesses a higher statistical strength and makes the evaluation more realistic [85, 86]. These and other observer performance methods have been described in more detail elsewhere [84, 85, 87]. Recall rate is defined as the percentage of screening studies in which further work-up was recommended by the radiologist. Reduced recall rate results in less anxiety, inconvenience, and cost for patients with false-positive findings. These numbers are known to vary widely, especially in between countries. Commonly reported recall rates ranges from around 5 % for mammography screening in northern Europe to 15 % for screening in North America [88]. However, the presented values (Table 4.1a, b) are based on enriched reader studies and are relative, in contrast to absolute performance values, which are being evaluated in clinical studies based on screening populations [89].
Table 4.1
Clinical studies reported in 2008–2013 on breast cancer detection using digital breast tomosynthesis alone (DBT; a), in one and in two views, and in adjunct to two-view digital mammography (DM; b) in comparison to standard two-view DM
4.1a: Studies comparing DBT only versus DM | |||||||
|---|---|---|---|---|---|---|---|
Study | Subjects (anormal) | Radiologists | Diagnostic accuracy | Sensitivity/specificity | Recall rate (%) | ||
Benign/normals | Cancer cases | ||||||
One-view DBT | Svahn et al. [68] | 50 (25) | 5 | +6.6 | |||
Gennaro et al. [69] | 376 (63) | 6 | +1.5 | −4.5/+4.1 | |||
Michell et al. [70] | 501 (111) | 8 | +4.5* | ||||
Svane et al. [71] | 144 (76) | 2 | −0.7 | −3.9/+5.1 | |||
Svahn et al. [72] | 185 (89) | 5 | +10.3* | +10.8*/+0.8 | |||
Wallis et al. [73] | 130 (40) | 10 | +0.1 | −11.2 | −10.5 | ||
Zanca et al. [74] | |||||||
Exp. readers | 130 (40) | 5 | +1 | −12.5 | −1.2 | ||
Inexp. readers | 130 (40) | 5 | −1 | −10.7 | −19.3 | ||
Waldherr et al. [75] | 144 (86) | 2 | +16.7*/+0.3 | −69.7* | −52.5* | ||
Thibault et al. [76] | 131 (55) | 7 | +2.27 | −7/+11 | |||
Two-view DBT | Good et al. [77] | 30 (25) | 9 | +2 | −2.6 | +3.3 | |
Gur et al. [78] | 125 (35) | 6 | +5/+4 | −10 | +5.7 | ||
Teertstra et al. [79] | 501 (111) | 1 | +1.5 | 0/–1.7 | |||
Wallis et al. [73] | 130 (40) | 10 | +7.9* | −11.2 | 0 | ||
Zanca et al. [74] | |||||||
Exp. readers | 130 (40) | 5 | +4.7 | −17.5* | −1.2 | ||
Inexp. readers | 130 (40) | 5 | +11.0* | −5 | −1.2 | ||
4.1b: Studies comparing DBT in adjunct to DM versus DM | ||||||
|---|---|---|---|---|---|---|
Studya | Subjects (anormal) | Radiologists | Diagnostic accuracy | Sensitivity/specificity | Recall rate (%) | |
Benign/normals | Cancer cases | |||||
Smith et al. [80] | 316 (48) | 12 | +7.1* | −42.6* | ||
Gur et al. [78] | 125 (30) | 8 | +5/+12 | −30* | +5.7 | |
Svahn et al. [68] | 50 (25) | 5 | +11.3* | |||
Michell et al. [81]b | 738 (204) | 6 | +7.2* | |||
Waldherr et al. [75] | 144 (86) | 2 | +21.1*/+2.2 | −72.7* | −68.3* | |
Rafferty et al. I [82] | 312 (48) | 12 | +7.2* | +10.7/+5.1 | −69.7* | −7.8 |
Rafferty et al. II [82] | 312 (51) | 15 | +7.1* | +16/−1.7 | −38.3* | +1.1 |
Gennaro et al. [83] | 469 (68) | 6 | +2.1 | +3.4/−1.9 | ||
Thibault et al. [76] | 131 (55) | 7 | +2.39 | −5/+11 | ||
Although, diagnostic accuracy tends to increase (+) for tomosynthesis as a single imaging modality compared to mammography (Table 4.1a), there are few studies with significant improvements (31 %, 5 out of 16 comparisons). In studies comparing several different tomosynthesis imaging protocols, a trend of increased performance can be seen as the image information increases, by the addition of either tomosynthesis views or mammography views. A majority of studies evaluating DBT combined with DM (Table 4.1b) have found significant improvements (e.g., 78 %, in 7 out of 9 studies). When counting solely with the studies using a full set of two-view images from both imaging modalities, e.g., two-view tomosynthesis reviewed in adjunct to two-view mammography, they all showed significant improvements (Table 4.1b; 100 %, in 5 out of 5 studies). This image protocol has also resulted in the largest improvements [68, 75, 82]. Several of the studies did not show significant improvements using tomosynthesis, but resulted in rather similar performance values compared to conventional DM (Table 4.1a and a couple of studies in Table 4.1b). In one of these studies [69], six radiologists interpreted images of 376 subjects (63 abnormal). Subjective analysis found abnormal and benign lesions to be more conspicuous in one-view tomosynthesis than in mammography in substantially more cases. However, no significance was achieved in terms of improved breast cancer detection. In a follow-up study [83], tomosynthesis images were reviewed with the complementary DM view. Although the improvement was still statistically nonsignificant, the clinical performance increased, compared with tomosynthesis alone, as seen by the narrower confidence intervals, which were close to the limit of superiority. The same trend was seen in separate analyses of sensitivity and specificity. Besides the influence of image protocol used, there are several possible explanations for different results in studies. As discussed by Houssami and Skaane [89], it may depend on differences in readers or in research methods. Another aspect is the case difficulty. If only cases are included that are easy to detect and identify on both imaging modalities, any performance difference may be diluted or likewise is true if the cases are too difficult to detect on both imaging modalities [90]. Cases of borderline detection are essential to show differences in between medical imaging devices. The clinical occurrence of such cases can be registered in the data sampling of reader studies or naturally be assessed in population-based trials. At this stage, the fact that so many reader studies have found increase in accuracy should be regarded as very promising. Additionally, these studies have been performed in controlled environments and usually regard reader variability in a large extent. However, in many of the presented studies, readers are only included from the same mammography centers, which may result in smaller reader variability than using readers from different centers. In the same way, the use of mainly experienced readers in a study might require a smaller number of readers, compared to using inexperienced, e.g., to obtain an acceptable level of uncertainty in the study results. To investigate the potential of DBT utmost, it is important to consider variability in different mammography centers that is described more in the following text section.
Multicenter, Multi-reader Trials
In a study by Beam et al. [91], the effectiveness of screening mammography was evaluated by randomly selecting fifty accredited mammography centers across the USA. A total of 108 radiologists at the centers interpreted the same set of 79 2D screening mammograms. The gold standard (state of truth) of the mammograms was obtained by either biopsy or follow-up during 2 years. The spread (dispersion) in radiologists’ performance was large in sensitivity, at least 40 %, and in specificity, at least 45 %, but largely reduced (to 11 %) when estimating variability in the area under the curve (AUC) on the same reader data (Fig. 4.11). The study results demonstrate that a large part of the variability in sensitivity and specificity is due to the variable thresholds for reporting disease. Diagnostic accuracy considers individual shifts that might exist in sensitivity and specificity, for example, in between readers or for a specific reader interpreting cases obtained from different imaging modalities, and consequently, two radiologists may have identical AUC representing a similar skill in discriminating between abnormal and normal/benign findings but in practice perform at rather different values of sensitivity and specificity.
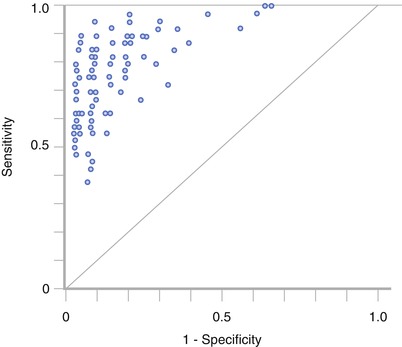
Fig. 4.11
Reader variability in 108 radiologists interpreting the same studies. A substantial variability is present in sensitivity (40 %) and in specificity (45 %) as described by the spread of reader data. The diagonal illustrates the performance associated with pure chance. When fitting ROC curves to the points and estimating the area under the curve, the reader variability was largely reduced (to 11 %) (Reprinted with permission from Chakraborty [85])
Variability has since long been noted in many areas of clinical medicine [92, 93]. The Breast Imaging Reporting and Data System (BIRADS) was initially introduced by the American College of Radiology in 1992 [94] as a tool designed to standardize breast imaging terminology and to help radiologists reduce false-positive screening mammograms. However, despite of this and many other improvements in mammography, the level of agreement among radiologists interpreting the same sets of mammograms has shown to be relatively low [93], which in practice can result in delayed detection of breast cancer and be both alarming for the patient and expensive. When comparing two medical imaging devices, large variability may compromise the aim of obtaining a value that represents radiologists in general and thus the reliability of the results. In worst case, the results of a study might be an effect of reader variability and subsequently it is essential to account for. Rafferty et al. [82] compared DBT in adjunct to DM with DM in two separate reader studies with a total of 27 radiologists participating from five different mammography centers (Table 4.1b). In both studies, the DBT modality was superior to digital mammography in diagnostic accuracy and in reduced recall rates. Other studies have included readers with various expertise in mammography from different countries and found benefits in breast cancer detection with tomosynthesis [73, 74].
Related posts:

Stay updated, free articles. Join our Telegram channel

Full access? Get Clinical Tree


