Diabetes in Minorities in the United States
A. Enrique Caballero
As human beings, we all share innumerable biologic, psychological, spiritual, and social elements. At the same time, we are each different enough in some or all these elements to make us unique. An evident and closer share of genetically transmitted physical characteristics, history, nationality, religion, language, traditions, and cultural heritage provides the basis to our integration into races or ethnic groups. Race is defined primarily by genetically transmitted physical characteristics, whereas ethnicity is a broader concept that refers to the sharing of a common and distinctive racial, national, religious, linguistic, or cultural heritage. Whites account for three fourths of the population in the United States. However, an increasing number of other racial and ethnic groups in the country contribute to the wide heterogeneity of the current population. In quantitative terms, these groups are known as the “minorities.” In the United States, the largest minority groups are Hispanics or Latinos, African Americans, Native Americans, Alaska natives, and Asian and Pacific Islanders.
Significant information on the health status of these groups has become available (1). Whereas the reported prevalence and incidence rates of type 1 diabetes in these groups are lower than those in whites, those reported for type 2 diabetes and its complications are higher in these groups (1).
Type 2 diabetes is a heterogeneous disease that results from a combination of genetic and environmental factors. Many studies have shown that these minority groups have a strong genetic predisposition for the development of type 2 diabetes. The “thrifty gene” hypothesis has emerged as a possible explanation for this genetic tendency to the development of diabetes. This hypothesis, first proposed in 1962, suggests that populations of indigenous people who experienced alternating periods of feast and famine gradually developed adaptations that increased the efficiency of their storage of fat during periods of plenty to better survive famine. However, now that food supplies have become more constant and abundant, this genetic adaptation has become detrimental, leading to an increased prevalence of obesity and
type 2 diabetes in some populations (2,3). Much research has been devoted to identifying the precise nature of the “thrifty gene or genes.” Unfortunately, no uniform genes across ethnic groups have been identified to fully support this hypothesis.
type 2 diabetes in some populations (2,3). Much research has been devoted to identifying the precise nature of the “thrifty gene or genes.” Unfortunately, no uniform genes across ethnic groups have been identified to fully support this hypothesis.
Environmental factors have undoubtedly contributed to the increase in risk for obesity and diabetes in these populations. The best data to support this concept come from the multiple studies that have found that the rates of type 2 diabetes and obesity are significantly higher in some minority groups in the United States than in the same racial and ethnic groups in their country of origin (4,5,6,7,8,9,10,11,12,13). Studies comparing their rates of diabetes in urban and rural areas also support this notion (14,15). The common elements of “Westernization” that increase the risk for obesity, diabetes, and related diseases include a diet higher in total calories and fat but lower in fiber and a decreased expenditure of energy because of labor-saving devices. In addition, particular aspects of preferred foods and lifestyle practices in each of these groups certainly play a role in the development of diabetes and its management. We now have a better understanding of how obesity, insulin resistance, diabetes, and cardiovascular disease are interrelated (16,17).
The high rates of diabetes in these populations represent a serious burden to the healthcare system in the United States. The burden comes not only from the high rates of diabetes and complications that they exhibit but also from the lack of widely available culturally and linguistically appropriate programs that demonstrate basic understanding of the needs and characteristics of each of the minority groups. Differences in cultural background do not impose a barrier for diabetes care per se. These differences do impose a barrier to the medical system and health professionals only when we lack the cultural competence to provide adequate care. A general call for action in developing research and clinical programs for minority populations has been posed by the U.S. government. New information being generated can increase our understanding of the challenges and opportunities in these groups. The goal of this chapter is to contribute to this effort by presenting information on various aspects of diabetes in the largest minority groups in the United States. For each group, general information is included on the population, diabetes epidemiology and pathophysiology, categories at risk for diabetes, microvascular and macrovascular complications, cultural and lifestyle factors related to diabetes, and prevention strategies.
DIABETES IN HISPANICS/LATINOS
The Hispanic/Latino Population
DEFINITION
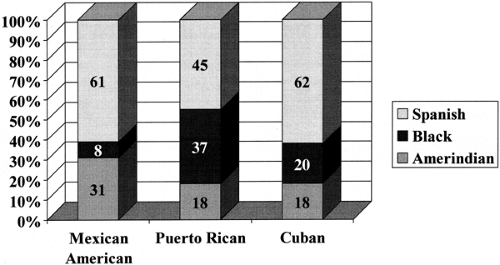
Hispanic or Latino refers to a person of Cuban, Mexican, Puerto Rican, South or Central American, or other Spanish culture or origin regardless of race (18). Historically, Spaniards, blacks, and Native Americans have contributed, to one degree or another, to the contemporary Hispanic populations. An example of these contributions is presented in Figure. 29.1.
DEMOGRAPHICS
According to the 2000 U.S. census, there are approximately 35 million Hispanics in the United States, representing 12.5% of the population. For the first time, Hispanics represent the country’s largest minority group (18) (Table 29.1). It is certainly the fastest growing group, and it is estimated that, by the year 2050, Hispanics will number 97 million and will constitute 25% of the U.S. population (19). The largest Hispanic groups in the country are Mexican Americans (66%), Central/South Americans (15%), Puerto Ricans (9%), and Cuban Americans (4%). The majority of Hispanics live in the South Central and Southwestern United States, but their numbers are increasing rapidly in many states in the North and Northeast. The mean age of Hispanics is 36.7 years, whereas it is 43.8 years in whites. Approximately one third of the Hispanic population is younger than 18 years old; thus, Hispanics are considered to be the youngest population in the United States (18).
TABLE 29.1. Distribution of U.S. Population by Race/Ethnicity in the 2000 U.S. Census | |||||||||||||||||||||||||||||||||
|---|---|---|---|---|---|---|---|---|---|---|---|---|---|---|---|---|---|---|---|---|---|---|---|---|---|---|---|---|---|---|---|---|---|
| |||||||||||||||||||||||||||||||||
Diabetes Epidemiology
PREVALENCE AND INCIDENCE OF DIABETES
Type 1 Diabetes
Overall, the rates of type 1 diabetes are lower among Hispanics than among the white population, as shown in a study of Mexican-American and white children in Colorado (20). A study in Philadelphia found a similar incidence of type 1 diabetes in Puerto Rican children and their white counterparts (21). Because genetic, immunologic, and environmental factors are involved in the development of type 1 diabetes, differences
in these factors may account for distinct prevalence rates among Hispanic subgroups.
in these factors may account for distinct prevalence rates among Hispanic subgroups.
Type 2 Diabetes
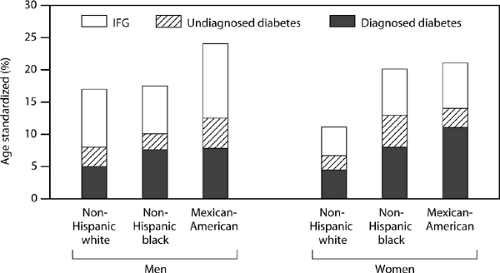
The most recent prevalence data in the United States are from the National Health and Nutrition Examination Survey III (NHANES III), conducted from 1988 to 1994 by the National Center for Health Statistics of the Centers for Disease Control and Prevention (22,23). This study included a representative sample of the U.S. civilian noninstitutionalized population to assess the prevalence of total, diagnosed, and undiagnosed diabetes, as well as categories at risk for type 2 diabetes, such as impaired fasting glucose (IFG) and impaired glucose tolerance (IGT) (24), in the general population as a whole and in non-Hispanic whites, non-Hispanic blacks, and Hispanics (25). The Hispanic population in this survey was represented by Mexican Americans, who constitute the largest Hispanic group in the United States. Overall, the prevalence of diabetes in Hispanic Americans was 1.9 times higher that in non-Hispanic whites. Figure 29.2 shows the prevalence rates, according to age and gender, of diagnosed and undiagnosed diabetes and IFG in adults older than 20 years of age in these various populations. The prevalence rates of diagnosed diabetes, undiagnosed diabetes, total diabetes, and IFG were significantly higher in Hispanic Americans than in non-Hispanic whites and similar or higher than in non-Hispanic blacks. When considering only those between the age of 40 and 74 years of age, the prevalence of diabetes (diagnosed and undiagnosed) was 11.2% for non-Hispanic whites and 20.3% for Mexican Americans. The prevalence of IGT, according to the 1980–1985 World Health Organization (WHO) (26,27) criteria, was 20.2% for Mexican Americans, and 15.3% for non-Hispanic whites. Similarly, other studies have reported higher prevalence and incidence rates of diabetes in Hispanics than in whites (28,29,30,31,32).
Subgroup Analysis
Age
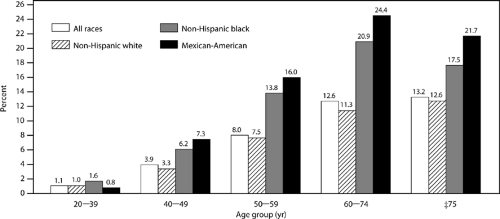
In practically every age group, the prevalence of diabetes is higher in Mexican Americans than in non-Hispanic whites. The proportion of the Mexican-American population with diabetes increases from less than 1% among those younger than 39 years old to as high as approximately 25% among those 60 to 74 years old (25) (Fig. 29.3). These rates incorporate only diagnosed cases; thus, overall rates of diabetes are higher in all age groups. This is also applicable to young Hispanic adults, adolescents, and children, who have been found to have high prevalence of obesity and type 2 diabetes (33,34).
Gender
The NHANES III study showed a higher prevalence of diagnosed diabetes among Mexican-American women older than 20 years of age than among Mexican-American men (10.9% vs. 7.7%) (25). On the other hand, the prevalence of undiagnosed diabetes in the same population was 5.4% in men and 3.6% in women. Therefore, the overall rate of diabetes is similar in men and women (13.1% and 14.5%, respectively). In addition, although the prevalence of IFG was higher in men (11.6%) than in women (6.3%), that of IGT, which was evaluated only in those between 40 and 74 years of age, was higher in women (22.3%) than in men (18.2%) (25).
Hispanic subgroups
The Hispanic Health and Nutrition Examination Survey (HHANES) was conducted in 1982 to 1984
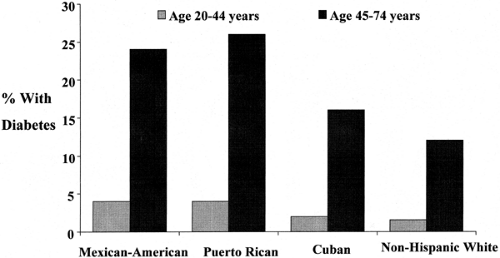
to address the prevalence of diabetes in three Hispanic populations: Mexican Americans in the Southwestern United States; Cuban Americans in Miami, Florida; and Puerto Ricans in the New York city area (35). In this survey, the total rate for diabetes (diagnosed and undiagnosed) in adults between 20 and 74 years of age was 27.7% in Mexican Americans, 30.2% in Puerto Ricans, and 18.2% in Cuban Americans (the corresponding rates for non-Hispanic whites and non-Hispanic blacks in this survey were 13.6% and 22.6%) (Fig. 29.4). This lower rate of diabetes in Cuban Americans may be due to a lower proportion of Native American and African genes and a higher socioeconomic level. There are no available data for other Hispanic subgroups in the United States.
to address the prevalence of diabetes in three Hispanic populations: Mexican Americans in the Southwestern United States; Cuban Americans in Miami, Florida; and Puerto Ricans in the New York city area (35). In this survey, the total rate for diabetes (diagnosed and undiagnosed) in adults between 20 and 74 years of age was 27.7% in Mexican Americans, 30.2% in Puerto Ricans, and 18.2% in Cuban Americans (the corresponding rates for non-Hispanic whites and non-Hispanic blacks in this survey were 13.6% and 22.6%) (Fig. 29.4). This lower rate of diabetes in Cuban Americans may be due to a lower proportion of Native American and African genes and a higher socioeconomic level. There are no available data for other Hispanic subgroups in the United States.
MORTALITY
Few studies address diabetes-specific mortality rates in the Hispanic population in the United States. The Starr County Diabetes Study found that Mexican Americans with diabetes, particularly those with chronic complications, such as proliferative retinopathy (36), experience premature and excessive mortality as compared with the general population. In addition, a study conducted in New Mexico showed that diabetes mortality rates
among Hispanics in that area gradually increased between 1958 and 1994 and that these rates are higher than those in whites (37).
among Hispanics in that area gradually increased between 1958 and 1994 and that these rates are higher than those in whites (37).
Pathophysiology of Type 2 Diabetes
GENETIC PREDISPOSITION
The three primary ancestors of Hispanics are Spaniards, native Indians, and Africans. Clearly, the rates of diabetes are higher in both the native Indian and African groups. The differences in rates of diabetes in the various Hispanic subgroups have been explained by the various degrees of genetic influence from these main groups (Fig. 29.1). Thus, a group such as the Puerto Ricans, who have a significant genetic contribution by Africans and native Indians, have shown a high rate of diabetes, whereas Cuban Americans, for whom the genetic contribution of these two groups is lower, have a lower rate of diabetes (35). Yet, even among Cuban Americans, whose reported rate of diabetes is the lowest among Hispanics, the rate of diabetes is higher than that among non-Hispanic whites (35) (Fig. 29.4). The prevalence rate for diabetes in Spain is higher than that in the non-Hispanic white population in the United States, suggesting that even Spanish admixture may be an important factor in explaining the higher rates of diabetes in Hispanics (38).
The nature of the precise genes that increase the risk for diabetes in this population is still unknown, although interesting information about potential genetic factors is now becoming available (39,40). Whatever the predisposing genes, it is evident that people with a family history of type 2 diabetes have an increased risk of the disease. The San Antonio Heart Study showed that the prevalence of diabetes among Mexican Americans who have first-degree relatives (e.g., parents) with diabetes is twice that of those with no family history of diabetes (41). In addition, the full metabolic profile of insulin resistance is fully established in the offspring of people with type 2 diabetes in this population (42). Strictly speaking, besides sharing a genetic background, first-degree relatives of persons with diabetes usually share environmental factors that may also participate in increasing the overall risk.
INSULIN RESISTANCE
Among people without diabetes in the NHANES III survey, insulin levels were higher in Mexican Americans than in non-Hispanic whites, a finding that suggests more insulin resistance in this population and, therefore, their greater predisposition for type 2 diabetes. Several other studies also have shown higher rates of hyperinsulinemia in Hispanics than in non-Hispanic whites, even after adjusting for obesity and body-fat distribution (43,44). In a more detailed evaluation of insulin resistance, the Insulin Resistance and Atherosclerosis Study found that nondiabetic Hispanics have significantly higher insulin resistance and a higher acute insulin response than do nondiabetic whites, although this difference disappears after adjustments are made for obesity and body-fat distribution (45). Therefore, although there is enough evidence to support a high prevalence of insulin resistance in Hispanics, the extent of its dependence on the degree and distribution of adiposity is not known.
INSULIN SECRETION
Acute insulin secretion has been reported to be higher in Hispanic Americans than in the non-Hispanic white population (45). This may represent a compensatory response of β-cell function to the degree of insulin resistance in this population. However, insufficient insulin secretion relative to the degree of insulin resistance is considered a crucial independent factor in the development of type 2 diabetes in this population (46).
OBESITY
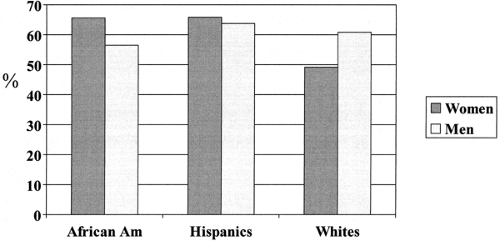
Obesity is a major risk factor for type 2 diabetes in any population. Recent U.S. data show that the age-adjusted prevalence of combined overweight and obesity [body mass index (BMI) >25] in Mexican-American women older than age 20 years is 65.9%. The corresponding proportion in Mexican-American men is 63.9% (47). These rates are higher than in white women and white men, who have rates of 49.2% and 61%, respectively (47). Figure. 29.5 shows the combined overweight and obesity (BMI >25) rates by gender in the Hispanic, non-Hispanic black, and non-Hispanic white population according to the NHANES III study (47). Other studies previously showed that Mexican-American adults and children, particularly women, have substantially higher rates of obesity than do non-Hispanic white Americans (48,49). The rate for diabetes has also been described to increase with each higher level of percent desirable weight in Mexican Americans, Puerto Ricans, and Cuban Americans (50). The localization of adipose tissue in the Mexican-American population has also been addressed, with upper body obesity being an important contributing factor for the development of type 2 diabetes (51,52). Low income level has also been reported to correlate with obesity. Among Mexican-American women age 20 to 74 years, the age-adjusted prevalence of overweight is 46% for women living below the poverty line as compared with 40% for those living above the poverty line (53). In an interesting finding, now applicable to many populations, low birthweight
is associated with the development of type 2 diabetes in Hispanics (54).
is associated with the development of type 2 diabetes in Hispanics (54).
Categories at Risk for Diabetes
IMPAIRED FASTING GLUCOSE AND IMPAIRED GLUCOSE TOLERANCE
Rates of IFG and IGT are higher in Hispanics than in non-Hispanic whites. The age- and sex-standardized rate of IFG in people older than 20 years of age in the NHANES III survey was 8.9% in Hispanics, 7% in blacks, and 6.8% in whites (25). Rates of IGT among adults age 40 to 74 years in the same study were also higher for Mexican Americans (20.2%) than for non-Hispanic white Americans (15.3%) and blacks (14%) (25).
GESTATIONAL DIABETES
The prevalence of gestational diabetes in Hispanics is two to three times higher than that in the general population (55). The risk of type 2 diabetes among Hispanic women who had gestational diabetes has been explored in a study of Mexican-American women in Southern California. This study showed that 12% of women with gestational diabetes progress to type 2 diabetes each year. This figure is about four times higher than that in the white population (56). Hispanic women with gestational diabetes represent an important group considered for diabetes prevention programs.
Microvascular Complications
RETINOPATHY
In the San Antonio Heart Study, the rate of diabetic retinopathy was 2.3 times higher among Mexican Americans than among non-Hispanic white Americans, even after controlling for duration of diabetes, severity of hyperglycemia, age, and systolic blood pressure (57). In concordance with these findings, the NHANES III study also found that the prevalence of diabetic retinopathy was twice as high in Mexican Americans as in whites and that this difference was not explained by duration of diabetes, glycemic control, or mode of diabetes treatment (58). In contrast, the San Luis Valley Diabetes Study found lower rates of retinopathy in Hispanics than in non-Hispanic whites (59,60). These opposite findings are not well understood but may reflect differences in some characteristics of the Hispanic groups included in these studies. The results of all three studies coincided in that severity and duration of diabetes was significantly associated with diabetic retinopathy.
The risk for microvascular complications is closely related to glycemic control. The NHANES III study found that 40.8% of Mexican Americans had glycosylated hemoglobin A1c (HbA1c) values greater than 8% as compared with 35.7% of non-Hispanic whites (61). In a subgroup analysis by gender, 44.5% of Mexican-American men had HbA1c values greater than 8%. In this study, education, income, health insurance coverage, and number of physician visits per year were not associated with poor glycemic control and did not seem to explain the differences observed by ethnicity. Another study suggested that lack of outpatient health insurance is associated with a higher rate of microvascular complications in Mexican Americans (62).
NEPHROPATHY
All stages of diabetic nephropathy are more frequent in Hispanics than in non-Hispanic whites. The San Antonio Heart Study showed that the prevalence of clinical nephropathy, defined by the presence of proteinuria, was 2.8 times higher and that the prevalence of microalbuminuria was 3.5 times higher in Mexican Americans than in non-Hispanic whites with diabetes. These differences remained statistically significant after adjusting for age and duration of diabetes (63). The NHANES III data also showed a higher prevalence of clinical proteinuria in Mexican Americans than in whites (11% vs. 5%) (50). However, the San Luis Valley Diabetes Study showed no difference in the incidence of diabetic nephropathy in Hispanics and non-Hispanic whites (59). Some clinical differences among these groups may explain these discrepant results.
The risk of end-stage renal disease (ESRD) due to diabetes, mostly type 2, has been reported to be six times higher in Mexican Americans than in whites (64,65). This increased risk does not seem to be completely explained by a higher prevalence of diabetes. Survival among Hispanics receiving hemodialysis appears to be better than among whites, perhaps because of a lower cardiovascular risk (66).
NEUROPATHY
The San Luis Valley Diabetes Study found no significant difference in the prevalence of diabetic neuropathy in Hispanics and non-Hispanic whites (59). In this study, symptoms and a physical examination, including vibration threshold, were taken into consideration to define diabetic neuropathy. In contrast, in the 1989 National Health Interview Survey, symptoms of sensory neuropathy were reported more frequently by Mexican Americans than by whites or African Americans (67).
Macrovascular Complications
CARDIOVASCULAR DISEASE
In the general population, no significant differences exist in the prevalence of nonfatal coronary heart disease (CHD), defined by electrocardiogram, among whites, blacks, and Hispanics (68). With regard to the diabetic population, studies in Texas and Colorado found lower rates of myocardial infarction in Mexican Americans than in non-Hispanic whites. Mexican Americans, men in particular, also exhibit a decreased prevalence of fatal myocardial infarction as compared with non-Hispanic whites (69,70). More studies are needed to determine whether this finding is consistent and applicable to other Hispanic subgroups.
Associated Cardiovascular Risk Factors
Findings from NHANES III indicate that the age-adjusted prevalence rate of metabolic syndrome was higher in Hispanics (Mexican Americans) than in the white population (31.9% vs. 23.7%). The age-adjusted individual metabolic abnormalities considered to define the metabolic syndrome were all higher in Hispanics than in whites: abdominal obesity, 45.7% vs 37.2%; hypertriglyceridemia, 37.7% vs 31.1%; low high-density lipoprotein (HDL) cholesterol, 39.6% vs. 37.9%; high blood pressure, 36.6% vs. 32.8%; and diabetes or IFG, 20% vs. 11.9% (71). With regard to hypertension, not all studies have shown a higher prevalence rate in Hispanics than in whites (72). In fact, the NHANES III study showed that, in the population with type 2 diabetes, the frequency of hypertension was significantly lower in Mexican Americans than in non-Hispanic whites (54% vs. 66%) (73). The prevalence rate of dyslipidemia was also lower in Hispanics than in non-Hispanic whites (51% vs. 65%) (73). Dyslipidemia in Hispanics is clearly associated with the degree of insulin resistance (74).
PERIPHERAL VASCULAR DISEASE AND AMPUTATIONS
Lavery et al. (75) found a higher incidence of diabetes-related lower-extremity amputations among Hispanics than among whites in Texas and California. In the San Antonio Heart Study,
the rate of peripheral vascular disease also was higher in Mexican Americans with type 2 diabetes than among non-Hispanic whites, although in this case, this increased incidence was not statistically significant after adjusting for the prevalence of diabetes (76). Of interest are the lower in-hospital mortality rates due to amputations among Hispanics than among whites. It is not known whether this difference is related to a lower cardiovascular risk in Hispanics (77). Certainly, preventing amputations is an important task in people with diabetes in diverse populations (78).
the rate of peripheral vascular disease also was higher in Mexican Americans with type 2 diabetes than among non-Hispanic whites, although in this case, this increased incidence was not statistically significant after adjusting for the prevalence of diabetes (76). Of interest are the lower in-hospital mortality rates due to amputations among Hispanics than among whites. It is not known whether this difference is related to a lower cardiovascular risk in Hispanics (77). Certainly, preventing amputations is an important task in people with diabetes in diverse populations (78).
CEREBROVASCULAR DISEASE
In a multicenter evaluation of nondiabetic subjects, the Insulin Resistance and Atherosclerosis Study found that common carotid artery intimal-medial thickness was significantly lower in Hispanics than in non-Hispanic whites, suggesting a lower degree of atherosclerosis (79). This difference remained even after adjusting for major cardiovascular risk factors and insulin sensitivity. This measure of atherosclerosis exhibited a clear relationship with the degree of insulin resistance in the study groups. No difference between Hispanics and whites was seen regarding the internal carotid artery measures (79). However, the degree of thickness of internal carotid artery plaque was lower in Hispanics than in blacks and whites in the Northern Manhattan Stroke Study (80).
Lifestyle and Cultural Factors
As previously mentioned, the prevalence of obesity is higher in the Hispanic population. An interesting cultural aspect about obesity is that the desire to lose weight may not be as strong among some Hispanics as among people of some other cultures. It is well known that in some societies women equate thinness with beauty; however, some Hispanic women, particularly older women, may equate physical robustness with physical health. As a result, being overweight may be considered normal and in some instances preferable to being slimmer (81,82). Food preferences are shared but are not necessarily the same for all Hispanic subgroups. There are differences in traditional foods among people from the many countries in Central and South America. The diet of Mexican Americans has been found to be slightly more atherogenic than the diet of whites (83). However, this concept cannot be generalized to all Hispanic subgroups. Even more, some traditional foods may have some beneficial effects in diabetes (84,85).
With regard to physical activity, the HHANES showed that the prevalence of diabetes was lower among Hispanic men with high levels of work-related physical activity than among those who had less physically demanding work (35). Unfortunately, The NHANES III survey found that 65% of Mexican-American men and 74% of Mexican-American women reported little or no leisure-time physical activity (86). Exercise was found to be inversely predictive of the incidence of type 2 diabetes among Mexican-American men but not among Mexican-American women (87).
The process of acculturation of Hispanics, and perhaps of other groups, to mainstream U.S. society has been described in terms of having two limbs: an ascending limb at which people adopt unhealthy food choices and become more sedentary, and a potential descending limb, at which people become progressively more affluent and try to adopt a healthier lifestyle (88). This latter stage, reflecting a higher level of acculturation, has been correlated with reduced prevalence of type 2 diabetes among Mexican Americans (89). For some other social aspects, lower socioeconomic status and education level is linked to a higher prevalence of diabetes (90,91).
Another important cultural aspect of diabetes care is language. A significant proportion of Hispanics do not speak English, and the healthcare system does not always provide services in Spanish. This issue has represented a limitation for healthcare access (92, 93). A study conducted in a group of Hispanic patients with diabetes showed that recall of the disease process and treatment information was higher in patients who were seen by bilingual physicians than in patients who were seen by physicians who spoke only English (94).
Like any ethnic group, the Hispanic culture is rich in beliefs, traditions, practices, and attitudes. Among Hispanics, family and religion play a crucial role in day-to-day life. All these aspects offer an opportunity to develop culturally and linguistically appropriate services and educational programs for Hispanics (95).
DIABETES IN AFRICAN AMERICANS
The African-American Population
DEFINITION
Black or African American refers to people who have origins in any of the black racial groups of Africa (18).
DEMOGRAPHICS
According to the 2000 U.S. census, there are 34.7 million African-American people in the country, representing 12.3% of the total U.S. population (18). The median age of this population is 30 years. Approximately 33% are younger than 18 years of age and 8% are older than 65 years of age. The majority of African Americans live in the South (54%), and 16% live in the Midwest, 18% in the Northeast, and 10% in the West. The ten states with the largest black populations are New York, California, Texas, Florida, Georgia, Illinois, North Carolina, Maryland, Michigan, and Louisiana. Between 1990 and 2000, the rate of increase in the black population was greater than that of the total population (15.6% vs. 13.2%) (18).
Diabetes Epidemiology
PREVALENCE AND INCIDENCE OF DIABETES
Type 1 Diabetes
Rates of type 1 diabetes appear to be lower in African-American children than in white American children (96). Incidence rates have been reported at around 5 to 8 per 100,000 per year in the African-American population, as compared with 14 to 17 per 100,000 per year in the white population. The distinct incidence rates reported in black populations may be due to the different proportions of racial admixture, particularly with the white population (97). It is known that genetic factors play a significant role in the development of type 1 diabetes. The major histocompatibility genes (HLA) most frequently associated with type 1 diabetes are infrequent in this population (98).
Type 2 Diabetes
The prevalence of type 2 diabetes in African Americans is higher than in the non-Hispanic white population and similar to that in Hispanic-Americans. Figure. 29.2 shows the most recent national data according to the NHANES III survey conducted from 1988 to 1994. The prevalence rate of diagnosed diabetes in African Americans
older than 20 years of age is 8.2%, as compared with 4.8% in whites. Among those age 40 to 74 years in this survey, the prevalence rate was 18.2% for blacks and 11.2% for whites. Therefore, the prevalence of type 2 diabetes in African Americans is approximately 1.6 times higher than in whites (25). Over the past 35 years, the number of people diagnosed with diabetes in this population has significantly increased. The total diabetes prevalence in African Americans 40 to 74 years old has increased from 8.9% in 1976 to 1980 to 18.2% in 1988 to 1994. Other studies have also reported a higher prevalence of diabetes in blacks than in whites (99). The incidence of type 2 diabetes has also been reported to be distinctly higher in the black population than in the white population (100,101).
older than 20 years of age is 8.2%, as compared with 4.8% in whites. Among those age 40 to 74 years in this survey, the prevalence rate was 18.2% for blacks and 11.2% for whites. Therefore, the prevalence of type 2 diabetes in African Americans is approximately 1.6 times higher than in whites (25). Over the past 35 years, the number of people diagnosed with diabetes in this population has significantly increased. The total diabetes prevalence in African Americans 40 to 74 years old has increased from 8.9% in 1976 to 1980 to 18.2% in 1988 to 1994. Other studies have also reported a higher prevalence of diabetes in blacks than in whites (99). The incidence of type 2 diabetes has also been reported to be distinctly higher in the black population than in the white population (100,101).
The rates for undiagnosed diabetes and IFG are also higher in African Americans than in whites (Fig. 29.2). It is estimated that among blacks there is one case of undiagnosed type 2 diabetes for every two diagnosed cases. This is similar to the proportion for other racial/ethnic groups in the United States. Identifying patients with diabetes is a major task in this group, as it is in the general population.
Subgroup Analysis
Age
The proportion of the African-American population with diabetes increases with age, increasing from less than 2% for people younger than 39 years old to as high as 21% for those 60 to 74 years old (25) (Fig. 29.3). These rates are based only on diagnosed cases of diabetes; therefore, the rates for total diabetes, which include undiagnosed cases, would be higher. Type 2 diabetes frequently develops in children and adolescents from this population (33).
Gender
The NHANES III survey found that the prevalence of diabetes in the African-American population is higher in women than in men at all ages (25). Among those age 20 years or older, the prevalence rate of diagnosed diabetes was 9.1% for women and 7.3% for men. The prevalence of undiagnosed diabetes in this study was 4.5% in women and 2.7% in men. However, the prevalence of IFG was 6.4% in women and 7.7% in men, whereas the prevalence of IGT was 13% in women and 15% in men.
MORTALITY
Diabetes is the seventh leading cause of death in the general African-American population and the fifth leading cause of death in people 45 years of age or older (102). In all age groups, the diabetes-related mortality rate is higher in African Americans than in whites (103). The overall mortality rate is 20% higher for black men and 40% higher for black women as compared with the rates in whites. These increased mortality rates have also been found in high-income areas (104).
Pathophysiology of Type 2 Diabetes
GENETIC PREDISPOSITION
As postulated in the “thrifty gene hypothesis,” some populations, such as Africans, developed a genetic adaptation to “feast and famine” cycles to use food energy more efficiently. It is believed that this protective change has now become an unfavorable situation that increases the risk of type 2 diabetes (2,3). Unfortunately, the precise genes that increase the risk for diabetes in the African-American population have not been clearly identified. However, these genes are very likely involved in increasing insulin resistance, decreasing insulin production, or both.
INSULIN RESISTANCE
African Americans have been found to have a higher degree of insulin resistance than their white counterparts. The NHANES III survey found that insulin levels were higher in African Americans without diabetes than in whites without diabetes (50). Hyperinsulinemia is a compensatory mechanism for overcoming peripheral insulin resistance and is thus an indirect measure of insulin resistance. This finding was particularly evident in African-American women and is consistent with the high rates of obesity and diabetes reported in black women. The Insulin Resistance and Atherosclerosis Study found significantly higher levels of insulin resistance and acute insulin response in nondiabetic African Americans than in nondiabetic whites, even after adjusting for obesity and body fat distribution (45).
In an alarming fashion, the full-blown syndrome of insulin resistance and type 2 diabetes are now frequently noted in African-American children and adolescents (33). African-American children have been found to have higher acute insulin responses and lower insulin sensitivity than white children, even after adjusting for body composition, social-class background, and dietary patterns (105).
INSULIN SECRETION
Deficient insulin secretion has been considered an important pathophysiologic element in the development of type 2 diabetes in African Americans. It has been identified not only in people with type 2 diabetes but even in those with impaired glucose tolerance (106).
Some interesting atypical forms of diabetes have been described in this population. A form of diabetes that presents with features of type 1 diabetes, with an evident insulin-secretion deficiency but without the usual HLA associations, has been reported (107). An interesting form of diabetes, called “Flatbush diabetes,” has also been described (108). These individuals present with ketoacidosis and a subsequent clinical course of type 2 diabetes. They are negative for antibody to glutamic acid decarboxylase and have an increased frequency of HLA-DR3 and -DR4 antigens (108). In addition, a ketosis-resistant diabetic syndrome associated with malnutrition has been reported in Jamaica. This form is associated with impaired insulin function and phasic insulin dependence (109). Some transient remission due to recovery of β-cell function after intensive glycemic control has also been reported in some African Americans (110).
OBESITY
Consistent with the higher rates of diabetes and insulin resistance, the prevalence of obesity is higher in African-American adults than in whites. Recent U.S. data show that the age-adjusted prevalence of combined overweight and obesity (BMI >25) in black women older than 20 years of age is 65.8%. The rate in black men is 56.5% (47). The corresponding rates in white women and white men are 49.2% and 61%, respectively (47) (Fig. 29.5). The difference between blacks and whites is noted only among women. In addition, the rates of central obesity, which is related to an increase in visceral fat that is clearly associated with the risk of diabetes, hypertension, and dyslipidemia, are also higher in the black population than in the white population.
It is tempting to believe that the higher rate of diabetes among African Americans is merely related to higher rates of obesity. However, the prevalence of diabetes is still higher in this population than in whites after adjusting for the presence of obesity and its degree and type (50,69). The extent to which obesity per se contributes to the higher rate of diabetes in blacks is uncertain; however, as in all populations, obesity is clearly a factor that increases the risk of diabetes and its associated metabolic abnormalities.
Stay updated, free articles. Join our Telegram channel

Full access? Get Clinical Tree


