Abstract
“Normal ranges” for hematologic values of neonates are not available. This is because blood is not drawn on healthy normal neonates to establish such ranges, as is done with the consent of healthy adult volunteers. Instead, neonatal hematology utilizes “reference intervals.” These consist of 5th to 95th percentile values compiled from laboratory tests that were performed on neonates thought to have minimal pathology relevant to the specific laboratory test under consideration, or with pathology unlikely to significantly affect that test result. The premise on which the reference interval concept is based is that these values approximate normal ranges, although they were admittedly obtained for a clinical reason and not from healthy volunteers. Basically, reference intervals are the best tools we have to interpret a neonate’s complete blood count (CBC), and they likely will continue to be the best we will have for several years to come [1].
The Reference Interval Concept
“Normal ranges” for hematologic values of neonates are not available. This is because blood is not drawn on healthy normal neonates to establish such ranges, as is done with the consent of healthy adult volunteers. Instead, neonatal hematology utilizes “reference intervals.” These consist of 5th to 95th percentile values compiled from laboratory tests that were performed on neonates thought to have minimal pathology relevant to the specific laboratory test under consideration, or with pathology unlikely to significantly affect that test result. The premise on which the reference interval concept is based is that these values approximate normal ranges, although they were admittedly obtained for a clinical reason and not from healthy volunteers. Basically, reference intervals are the best tools we have to interpret a neonate’s complete blood count (CBC), and they likely will continue to be the best we will have for several years to come [1].
Establishing reference intervals for the various parameters in the neonatal CBC is complicated by the fact that values obtained from term infants often do not apply to preterm infants, and values obtained from low birthweight preterm infants can be very different from ranges obtained from extremely low birthweight infants. As an example, a venous hematocrit of 38% of a 24 week gestation preterm neonate on the day of birth would be well within the reference interval of 30%–52%, and thus would be “normal.” However, a hematocrit of 38% of a term neonate on the day of birth is low, in the anemic range, because the reference interval for hematocrit at term is 42%–64%.
Reference intervals at birth are not static, but change over the first days, weeks, and months following birth. Therefore one set of reference intervals, at birth, is not sufficient for judging normalcy over the entire neonatal period. Another problem encountered in defining reference intervals in neonatal hematology is that unstable, sick neonates may have values within the reference interval, yet those values may not be optimal for patient care. As an example, a neonate born at 24 weeks’ gestation, now 4 weeks old, has a hematocrit of 24%, which is within the reference interval. However, if that patient develops an infection and becomes hypoxemic and tachycardic, the hematocrit of 24% might be too low for optimal patient care. A higher hematocrit might facilitate better tissue oxygenation, diminish the heart rate, and permit better caloric utilization for growth. Therefore, just because a value falls within the reference interval does not assure that it is optimal for the clinical circumstance.
Determining whether a hematologic value is normal often requires cognizance of the gestational age, the age (hours after delivery) when the sample was obtained, any illnesses involved, the level of intensive care support, and the anatomical site of the blood sampling (venous, arterial, capillary). Sometimes knowledge of other factors is pertinent, such as whether delayed clamping of the umbilical cord, or “cord milking” was performed. This chapter describes the reference intervals published for use in neonatology, and provides information needed to avoid pitfalls in interpreting these values.
Erythrocytes
Hemoglobin Concentration
The concentration of hemoglobin in the blood and the hematocrit are among the most commonly performed of all clinical laboratory tests. The hemoglobin can be quantified by manual or automated techniques. The standard assay for hemoglobin determination, approved by the World Health Organization, is simple but highly reproducible [2]. It involves the conversion of the several forms of hemoglobin in the blood, including oxyhemoglobin, carboxyhemoglobin, and the minor quantities of other hemoglobin species present, to a single compound, hemoglobincyanide, which is then determined spectrophotometrically. The hemoglobin concentration and the hematocrit are for the most part different measurements of the same biologic variable. However, because the hemoglobin concentration is a direct measurement but the hematocrit is usually calculated, as explained later, the hemoglobin concentration has sometimes been a slightly preferred method.
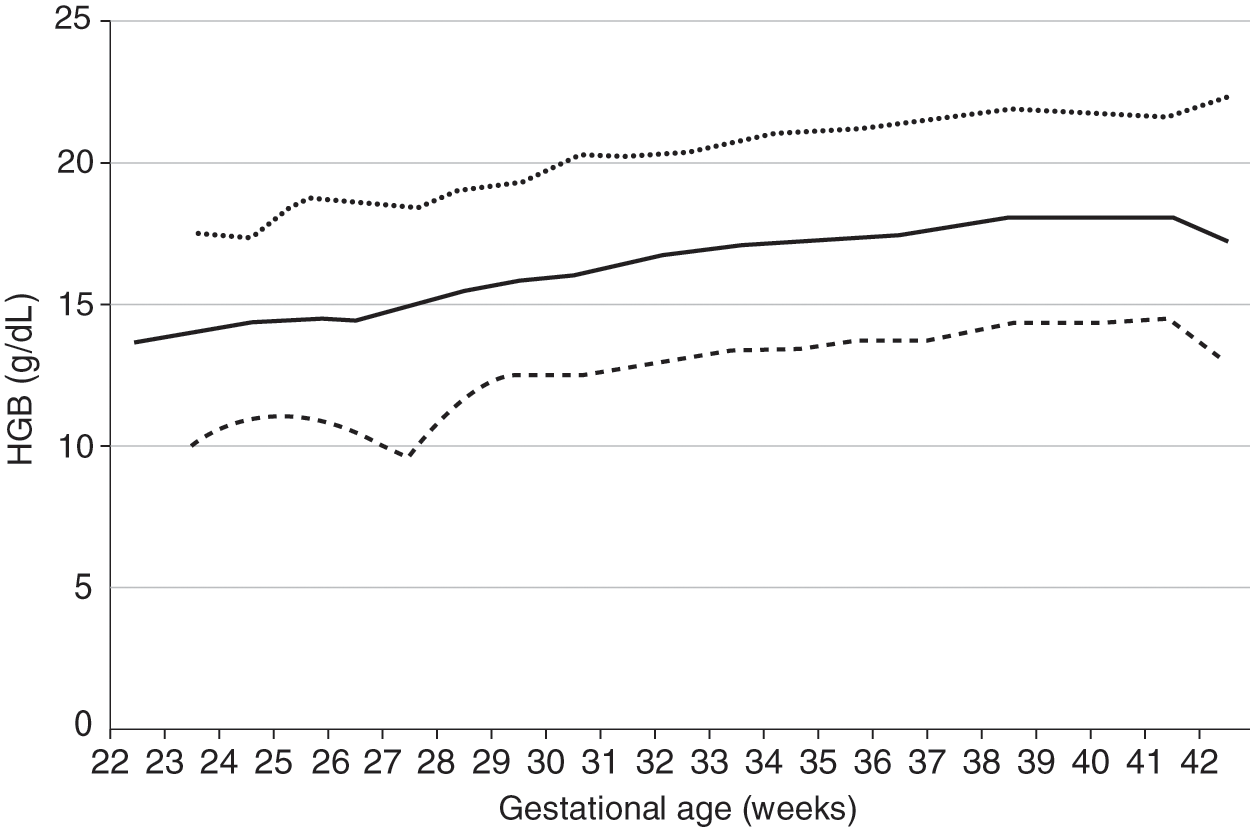
Reference ranges for hemoglobin values of newborn infants 22 to 42 weeks’ gestation [3] are shown in Fig. 24.1. In keeping with the reference range concept, values were not included in the figure if the mother had a diagnosis of placenta previa, abruptio placenta, or any antenatal hemorrhage, or if the patient had a diagnosis of hemorrhage at birth. No differences occur on the basis of gender. Postmature infants do not have higher hemoglobin concentrations than those delivered at term, unless chronic hypoxemia has occurred.
Fig. 24.1 Reference range for blood hemoglobin concentration on the day of birth (n = 24 416 patients) at 22 to 42 weeks’ gestation. The solid line shows the mean value and the dashed lines show the 5% and 95% reference range.
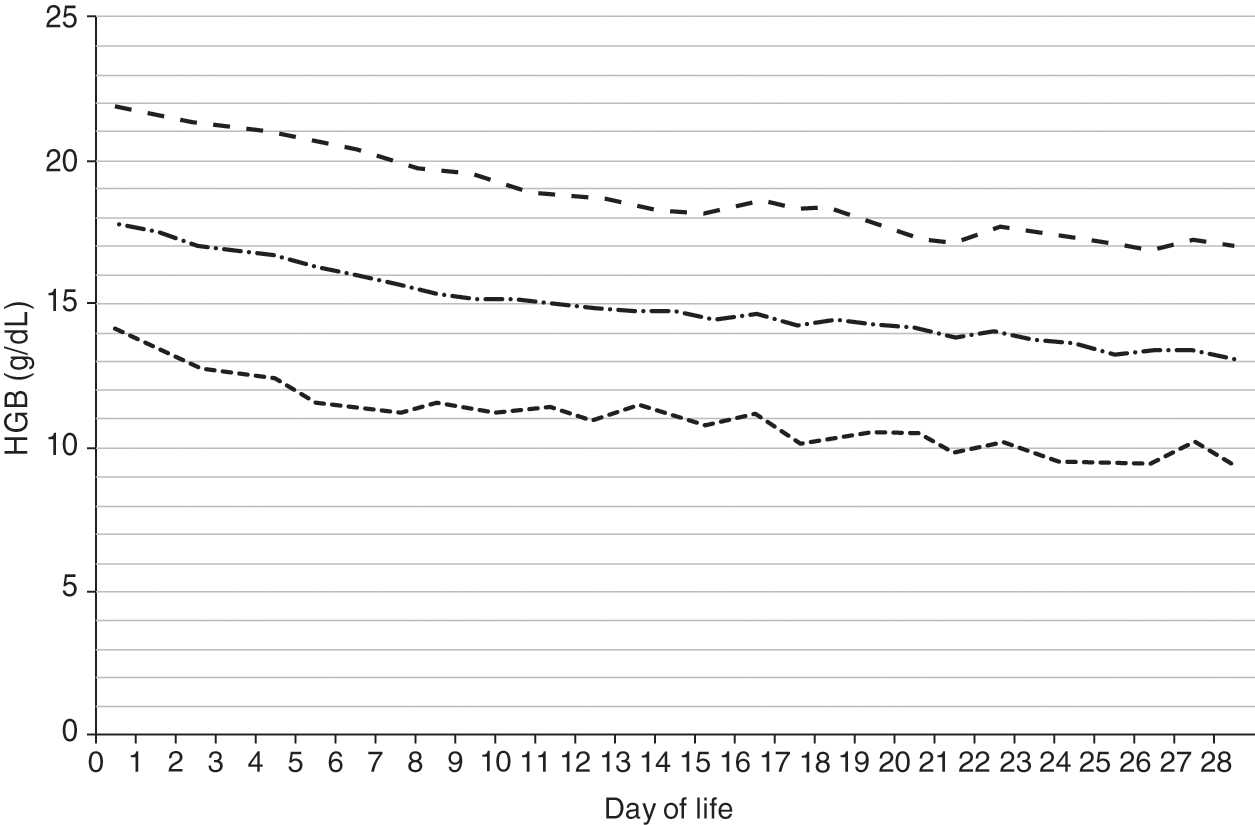
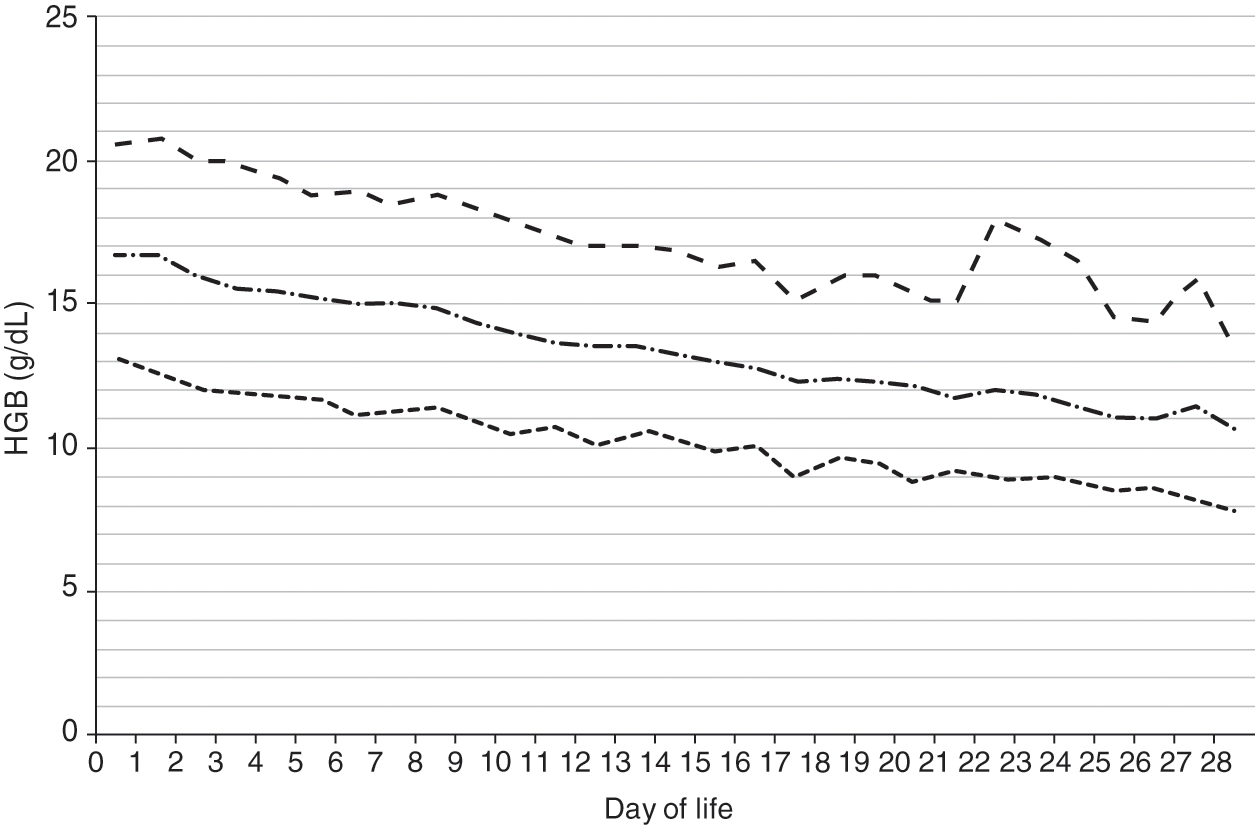
Reference ranges for hemoglobin over the first 28 days after birth are shown in Fig. 24.2 for patients 35–42 weeks’ gestation at birth, and in Fig. 24.3 for patients 29–34 weeks’ gestation. Hemoglobin values for patients <29 weeks were not included in the report because virtually all had repeated phlebotomy and erythrocyte transfusions, thus confounding the slope of the hemoglobin reference range.
Fig. 24.2 Reference range for blood hemoglobin concentration during the 28 days after birth for neonates 35 to 42 weeks’ gestation. The solid line shows the mean value and the dashed lines show the 5% and 95% reference range.
Fig. 24.3 Reference range for blood hemoglobin concentration during the 28 days after birth for neonates 29 to 34 weeks’ gestation. The solid line shows the mean value and the dashed lines show the 5% and 95% reference range.
Hematocrit
In 1929, Dr. Maxwell M. Wintrobe described a clinical laboratory test that he called the volume of packed red blood cells (VPRC) [4]. The test was performed by centrifuging blood in a specifically designed glass tube called a hematocrit. Originally, “hematocrit” was the name of the tube used in the measurement, not the measurement itself. However, usage subsequently changed, and the term hematocrit now typically indicates the measurement, and the term VPRC is rarely used.
The hematocrit measurement is the proportion of the blood sample occupied by erythrocytes. The units for hematocrit are usually given as either a percentage or a decimal fraction (liters of red blood cells/liter of blood). Because neonates and young children do not have a liter of blood in their entire circulation, children’s hospital laboratories sometimes choose to express the hematocrit as a percentage not as liters per liter.
Originally, the result of the hematocrit test was read directly from the tube, after a standardized centrifugation, as the proportion of the height of the total column of blood occupied by red cells. Although an extremely simple concept, this test constituted a significant advance in clinical medicine. It was highly successful and became widely used, probably because the results were very reproducible and useful in patient care and because the test could be performed without complicated or expensive instrumentation. Subsequent modifications of the hematocrit test to permit using small blood samples led to its applicability to neonates. Ten years after it was described for testing adults, Waugh and colleagues reported that the hematocrit of normal infants, averaging 51.3%, was higher than that of normal adults [5].
Most hospital laboratories no longer use centrifugation methods for hematocrit determinations; instead, aperture-impedance instruments calculate the hematocrit. This is done by electronically measuring the mean red blood cell volume and multiplying this number by the erythrocyte concentration, also measured electronically. The mean volume of the erythrocytes multiplied by their number per microliter yields the volume of red blood cells per microliter, or the hematocrit. Other types of cell counters calculate the hematocrit using laser optics, correlating the magnitude of a light pulse generated by passing a red blood cell through a laser with the cell’s volume.
Many neonatologists have noticed that when manual and electronic methods for hematocrit determination are used on an individual neonate, a consistent difference occurs between the two, a difference usually not seen in testing older children and adults. Neonates tend to have a slightly higher spun hematocrit than automated hematocrit. The reason for this involves the phenomenon of trapped plasma in the spun hematocrit determinations. When blood is centrifuged in a hematocrit tube, a small amount of plasma is always “trapped” between the erythrocytes, slightly elevating the spun hematocrit value. The amount of trapped plasma is insignificant in most cases, usually in the range of 1% to 3% of the plasma volume, as determined by radioiodinated serum albumin labeling experiments [6]. However, in samples with a very high hematocrit, more plasma becomes trapped when the cells are centrifuged. Because term neonates have considerably higher hematocrits than adults, this additional plasma trapping tends to make the spun hematocrit a higher value than the automated, calculated value (which is not subject to the plasma trapping pitfall). Few spun hematocrits are used in modern neonatology, but in any neonatal intensive care units (NICUs) doing so, this difference between spun and automated hematocrit values should be recognized.
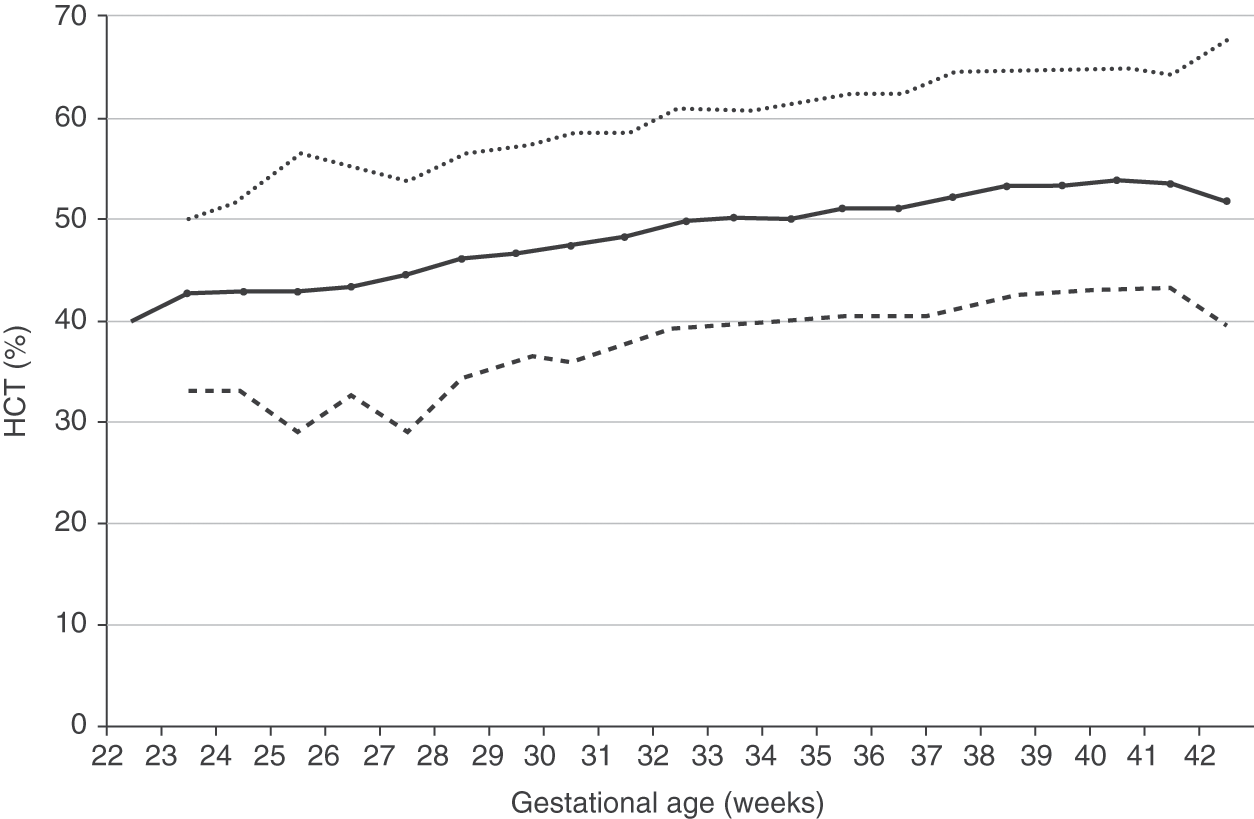
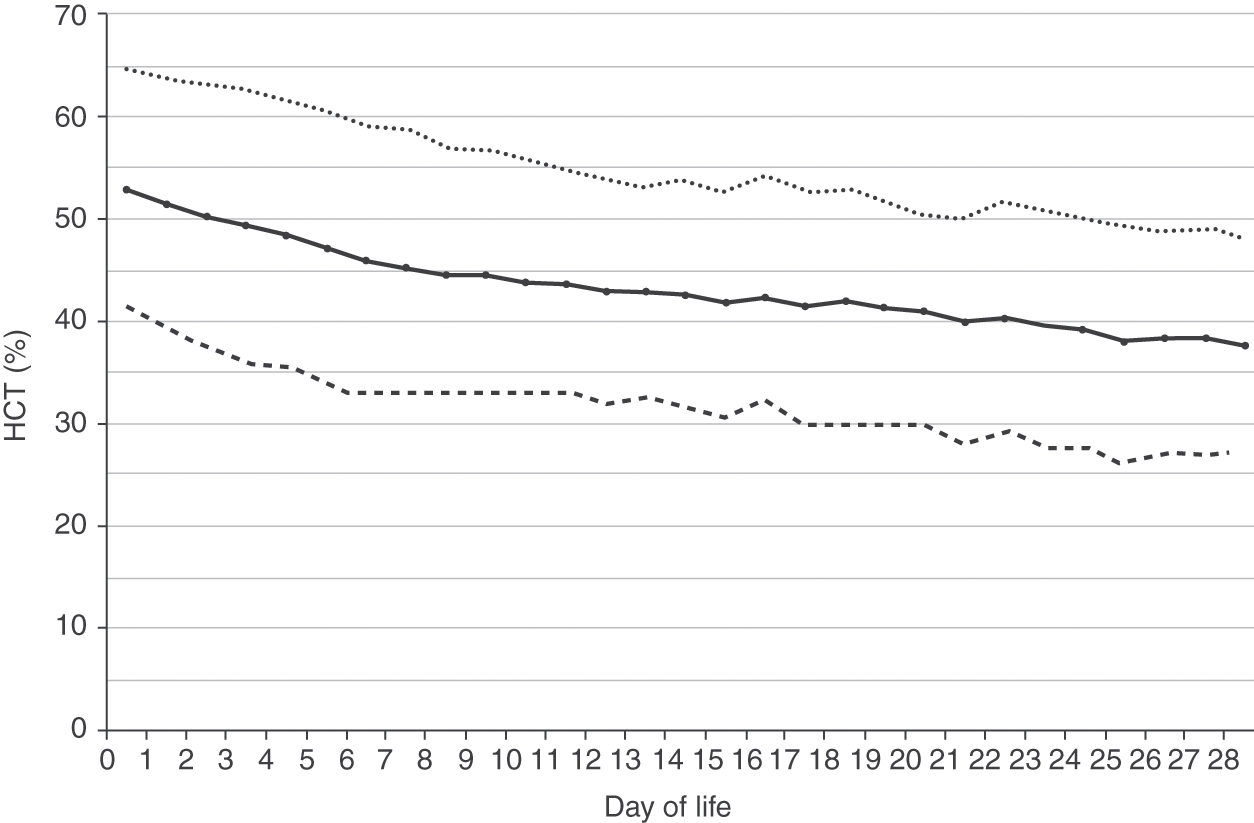
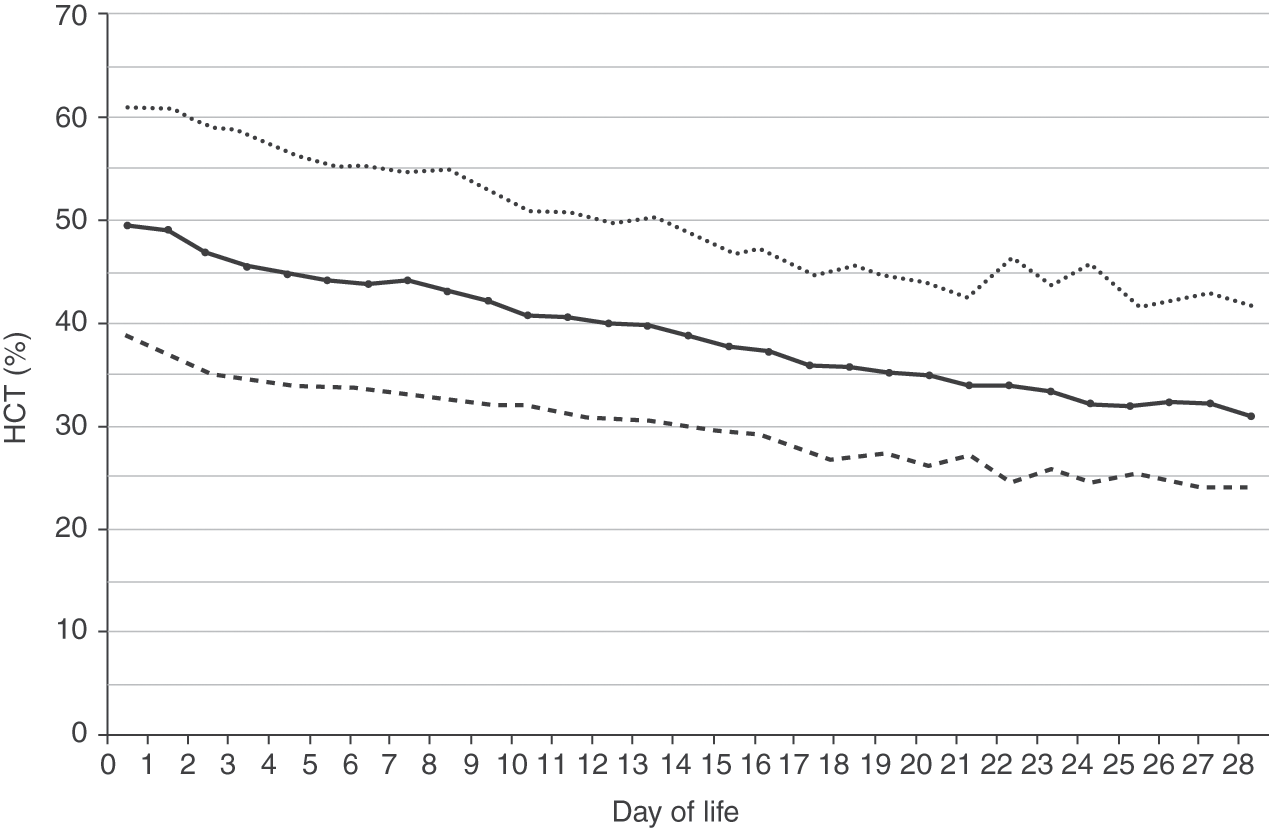
Reference intervals for hematocrits of neonates 22 to 42 weeks’ gestation are shown in Fig. 24.4 [3]. As with hemoglobin values, no differences occur on the basis of gender. Reference intervals for hematocrit over the first 28 days after birth are shown in Fig. 24.5 for patients 35–42 weeks’ gestation at birth, and in Fig. 24.6 for patients 29–34 weeks’ gestation.
Fig. 24.4 Reference range for hematocrit on the day of birth (n = 25 464 patients) at 22 to 42 weeks’ gestation. The solid line shows the mean value and the dashed lines show the 5% and 95% reference range.
Fig. 24.5 Reference range for hematocrit during the 28 days after birth for neonates 35 to 42 weeks’ gestation. The solid line shows the mean value and the dashed lines show the 5% and 95% reference range.
Fig. 24.6 Reference range for hematocrit during the 28 days after birth for neonates 29 to 34 weeks’ gestation. The solid line shows the mean value and the dashed lines show the 5% and 95% reference range.
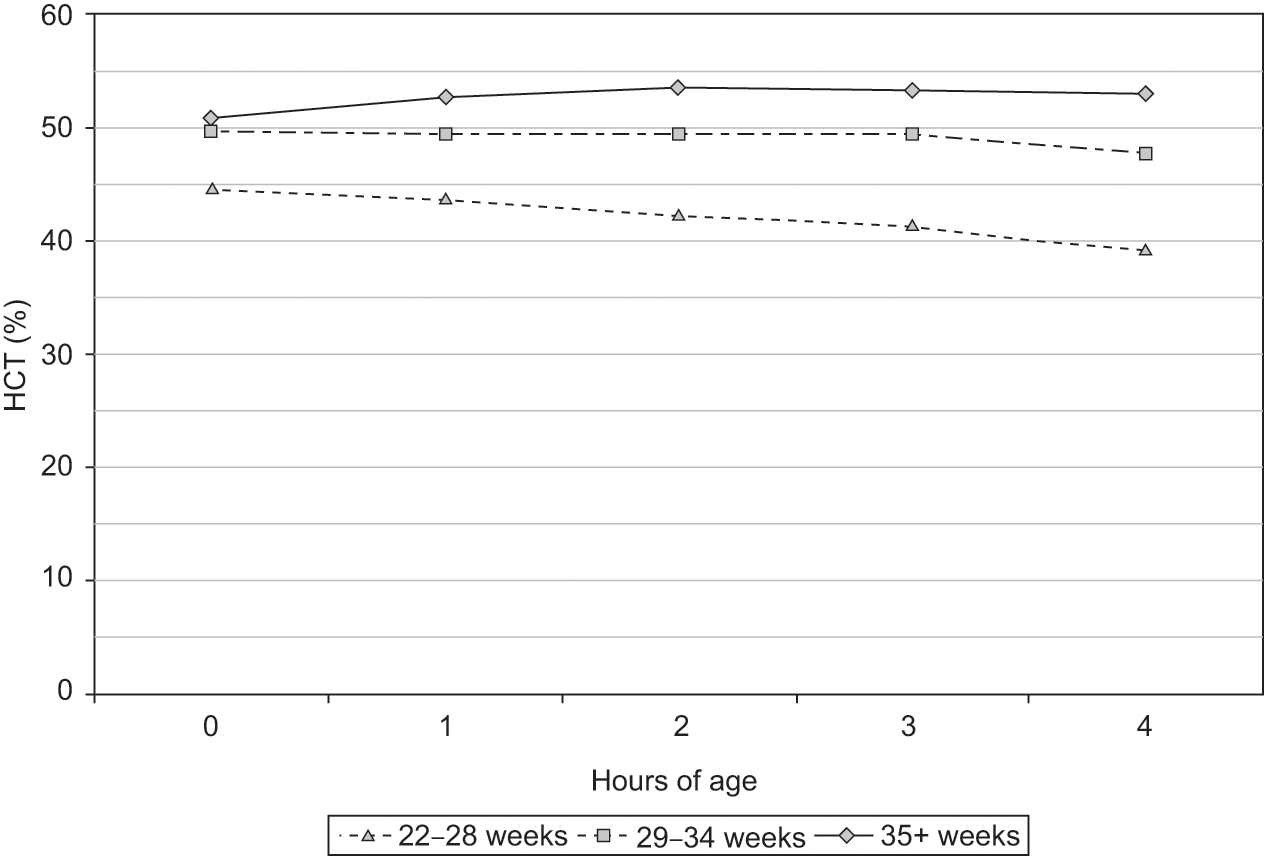
The hematocrit, like the hemoglobin concentration and the erythrocyte count, normally increases during the first 4 hours after birth. The increase, as shown in Fig. 24.7, might not occur in preterm infants. Gairdner et al. first reported this consistent postnatal increase in hematocrit during the hours following birth, and speculated that it was the result of the intravascular concentration of blood received by placental transfusion [7]. Its absence in preterm infants might be due to early phlebotomy losses for laboratory studies, lack of a placental transfusion (because of the desire to rapidly hand the patient to the neonatology team), or other reasons.
Fig. 24.7 Reference range for hematocrit over the 4 hour period following birth (n = 23,534 patients). Three groups are shown based on gestational age.
Erythrocyte Count
The erythrocyte count is the number of erythrocytes in a volume of blood, usually expressed as cells per micro-liter, or cells per liter. Older methods for determining the erythrocyte count used a counting chamber viewed from a microscope, but modern methods use an electronic particle counter, sampling many logs more cells than the previous methods.
Erythrocyte Indices
In addition to devising the hematocrit, Dr. Wintrobe introduced the concept of erythocyte indices and described methods for their calculation. Virtually every CBC includes a report of these indices. The original manual methods for making the measurements with which the erythrocyte indices were calculated have been replaced by automated instruments, which provide measurements that are more precise and reproducible. Although sometimes overlooked, these indices can provide the neonatologist with valuable information not otherwise available.
The mean corpuscular volume (MCV) is a measure of the average size of circulating erythrocytes, expressed in femtoliters (fL, 10–15L). Most modern automated cell counters, using laser optics or aperture impedance, measure the MCV of erythrocytes directly. However, as originally described, the MCV was calculated after measuring the hematocrit and the erythrocyte count by the formula:

The mean corpuscular hemoglobin (MCH) is a measure of the amount of hemoglobin in an average circulating erythrocyte. It is expressed in picograms of hemoglobin (pg, 10–12 gram) and is given by the formula:

The mean corpuscular hemoglobin concentration (MCHC) is a measure of the concentration of hemoglobin in an average circulating erythrocyte, and is expressed as units of grams of hemoglobin per deciliter of packed red blood cells (g/dL):

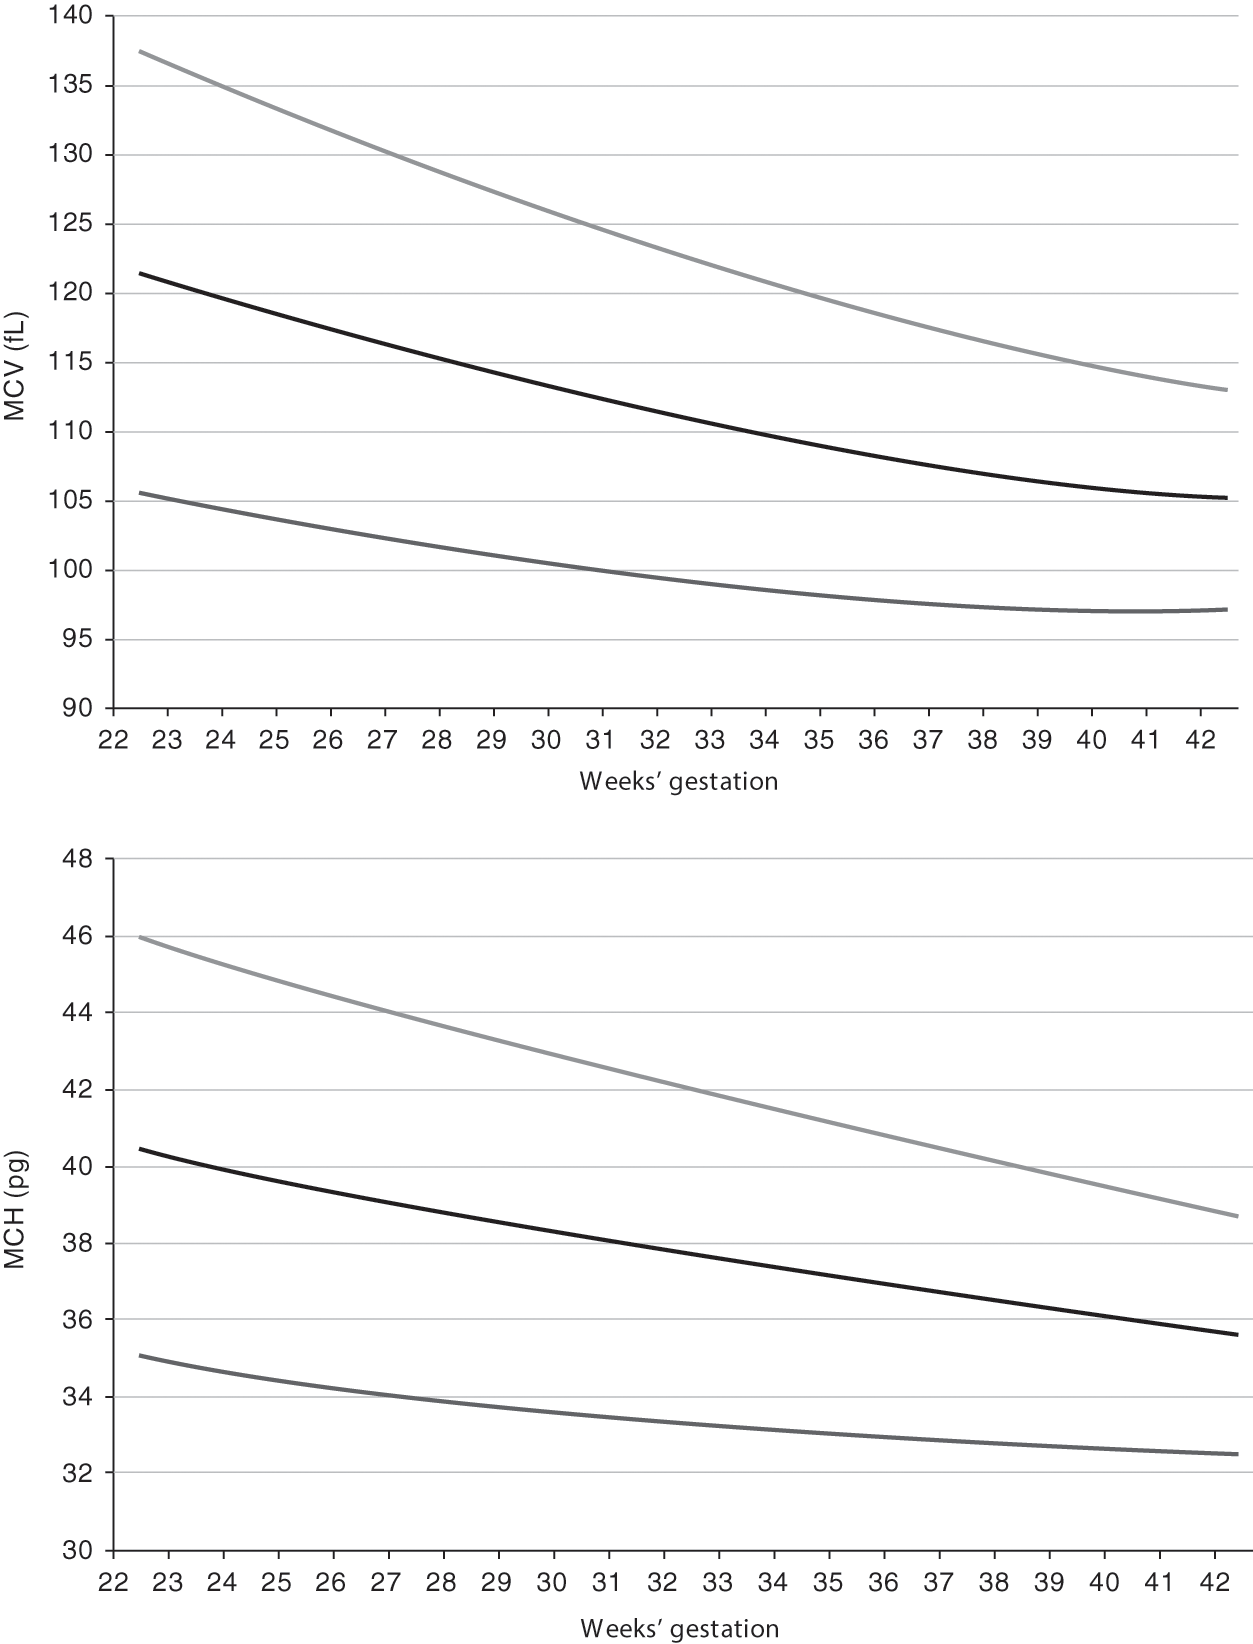
Reference ranges for MCV and MCH from 22 to 42 weeks’ gestation are shown in Fig. 24.8 [8]. A fetus at 22–24 weeks’ gestation, and similarly an extremely preterm neonate at 22–24 weeks’ gestation, has erythrocytes that are exceedingly large, in comparison to those of adults. The MCV and MCH fall immediately when a preterm neonate receives an erythrocyte transfusion, because the MCV and MCH of the blood donor will be much lower. By 3 to 4 months after birth, the MCV and MCH of a neonate have diminished gradually to that of the level of a normal adult (88 ± 8 fL). Thereafter, the MCV continues to decline, reaching nadir levels during the fourth to sixth months and then slowly increasing to adult values after the first year. When a newborn infant has an MCV of less than 94 fL, α-thalassemia trait or iron deficiency should be considered. Erythrocyte indices of central African neonates do not differ from those of neonates from other parts of the world, although the hematocrits of these neonates are somewhat lower [9].
Fig. 24.8 Reference range for mean corpuscular volume (MCV) and mean corpuscular hemoglobin (MCH) for neonates on the first day after birth for neonates 22 to 42 weeks’ gestation. The lower line shows the 5th percentile values, the middle line shows the mean values and the upper line shows the 95th percentile values.
Unlike the MCV and MCH, the MCHC does not change, either during gestation or after delivery. A reference range for MCHC of 34±1 g/dL is appropriate to all ages [8]. An elevated MCHC can be a useful screen for hereditary spherocytosis. Michaels and associates compared automated MCHC measurements from 112 children with hereditary spherocytosis who had not undergone splenectomy with 112 matched healthy children and observed that the MCHC of the group with hereditary spherocytosis was 35.9 g/dL, significantly higher than the controls (34.3 g/dL, P <0.001) [10]. Similarly, newborn infants with hereditary spherocytosis have a higher MCHC than do neonates with similar peak serum bilirubin concentrations that do not have hereditary spherocytosis (see Table 24.1).
Table 24.1 An elevated mean corpuscular hemoglobin concentration (MCHC) in a neonate can suggest the possibility of hereditary spherocytosis
| N | MCHC (g/dL) | |
|---|---|---|
| Non-transfused neonates <12 hrs since birth | 17,624 | 34.0 (33.0–35.1) |
| Neonates with Coombs (−) jaundice | 1,592 | 34.4 (33.2–35.5) |
| Neonates with Coombs (+) jaundice | 363 | 34.7 (33.3–36.0) |
| Neonates with hereditary spherocytosis | 15 | 36.9 + 0.7 |
| P (Coombs (+) vs. Coombs (−) neonates) | <0.001 | |
| P (Hereditary spherocytosis vs. Coombs (−) neonates) | <0.001 | |
| P (Hereditary spherocytosis vs. Coombs (+) neonates) | <0.001 |
Note: Values are shown as mean and 95% confidence intervals or mean + SD (when too few values were present to calculate confidence intervals).
Red Blood Cell Distribution Width
The red cell distribution width (RDW) and the hemoglobin distribution width (HDW) are commonly reported on automated CBCs. The RDW is a measure of the homogeneity of red blood cell size, and the HDW is a measure of the homogeneity of red blood cell hemoglobin. The RDW is expressed as a percentage, meaning the percent of erythrocytes that fall outside (smaller or larger) the standard gated population of erythrocytes. An elevated RDW value reflects an abnormal divergence of erythrocyte size [11]. The RDW begins to increase in cases of iron deficiency before any other change in erythrocyte indices or concentrations.
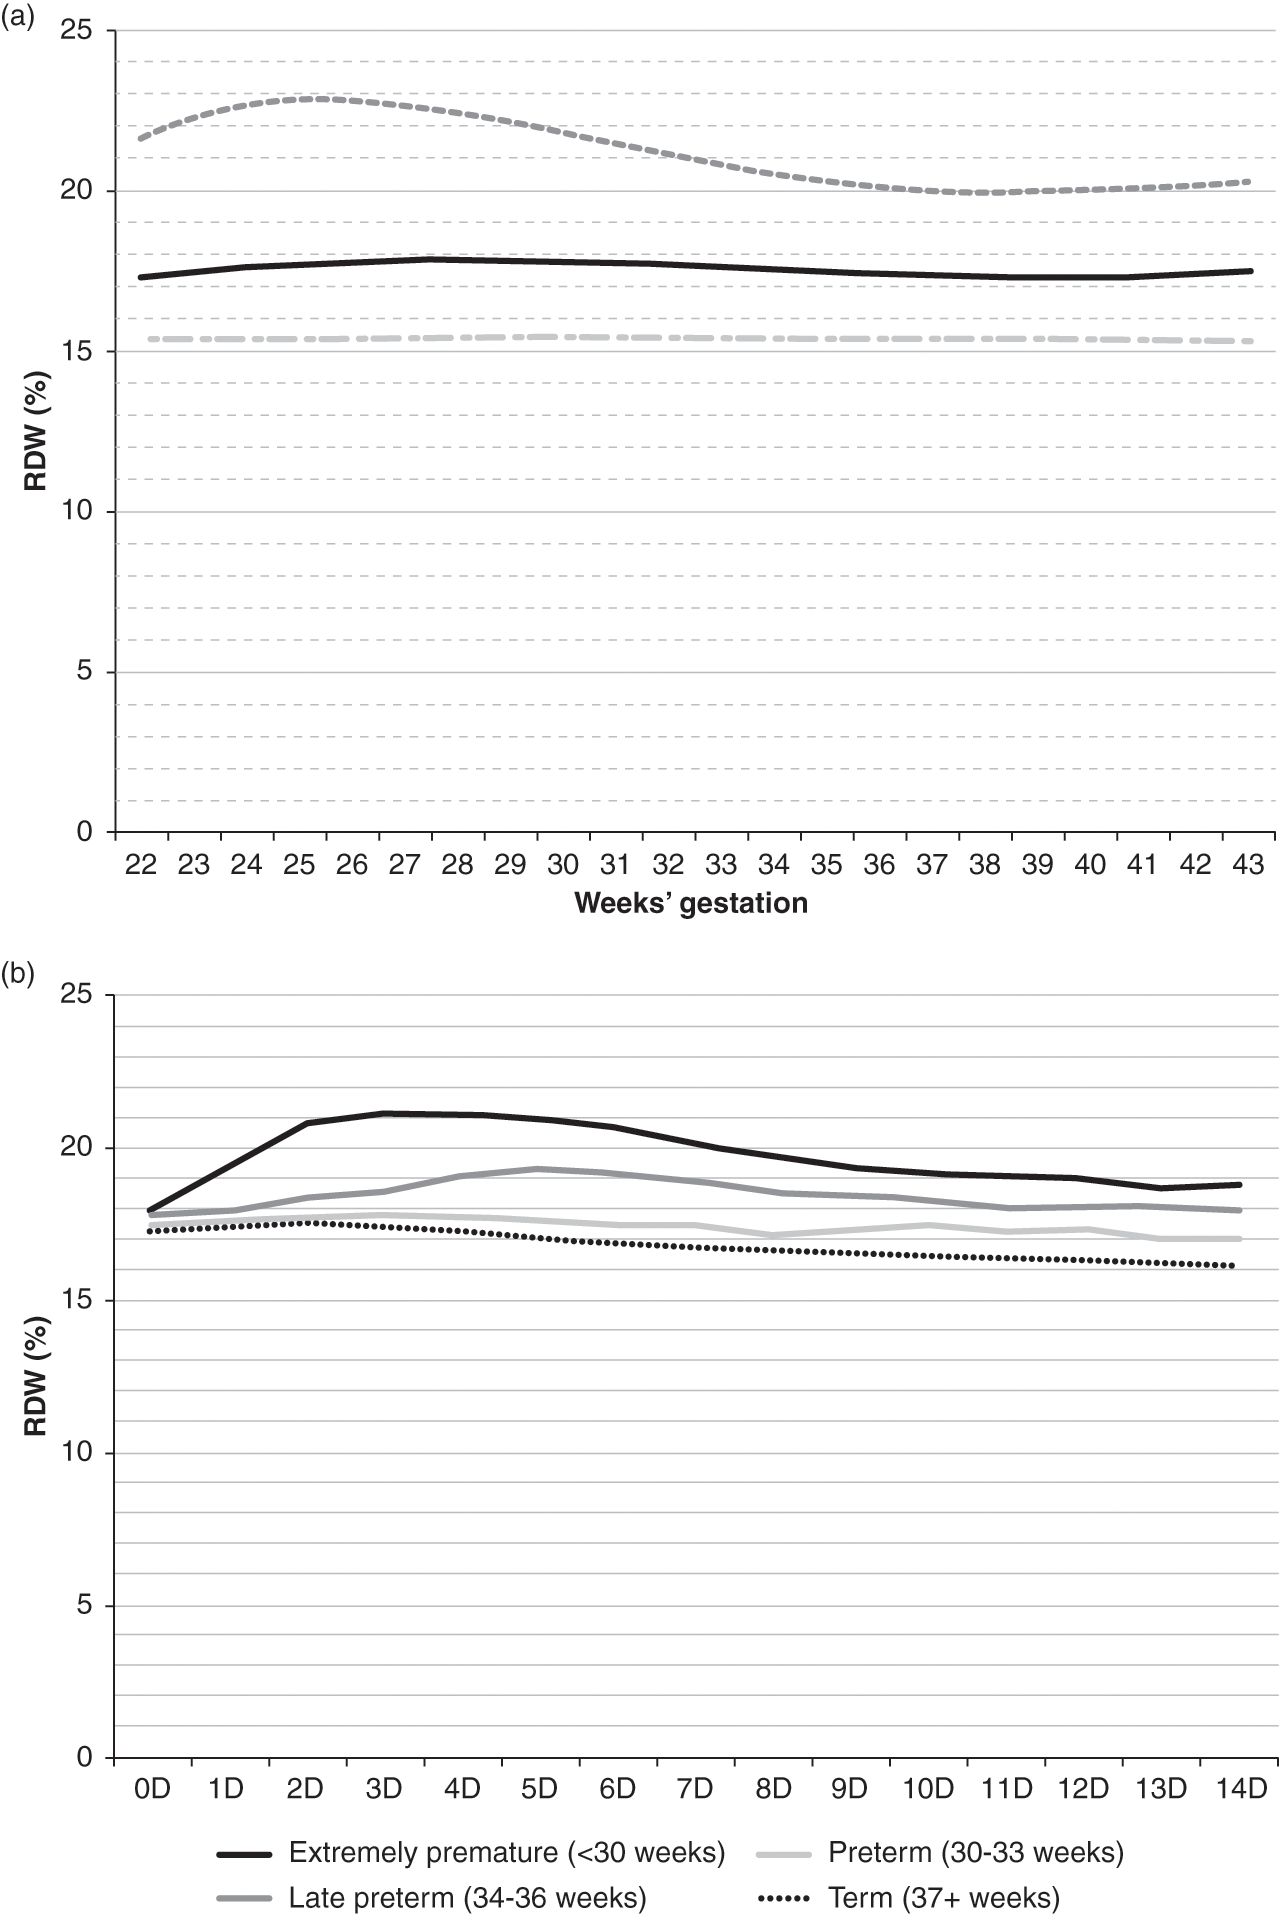
The HDW is expressed in grams per deciliter (g/dL) and provides an index of divergence of hemoglobin concentration within erythrocytes. The RDW provides a numeric assessment of anisocytosis, and the HDW provides a numeric assessment of anisochromasia. Figure 24.9 shows the reference intervals for RDW (%) on the day of birth, according to gestational age in panel A, and RDW (%) over the first 14 days following birth, according to gestational age group.
Fig. 24.9 Reference interval for red blood cell distribution width (RDW%). (a) Shows values on the day of birth as a function of gestational age. (b) Shows values over the first two weeks as related to gestational age at birth. The lower line shows the 5th percentile values, the middle line shows the mean values and the upper line shows the 95th percentile values.
Reticulocyte Count
As the erythroid precursor cells clonally mature within the bone marrow their nucleus becomes pyknotic and is extruded (usually at the orthochromatic normoblast stage), and the cells are thereafter released into the blood. Cytoplasmic organelles, such as ribosomes, mitochondria, and the Golgi complex, generally persist for some time after the erythrocytes have reached the circulation. Supravital stains, such as new methylene blue and brilliant cresyl blue, stain the nucleic acid within these organelles (new methylene blue is a distinct chemical stain; regular methylene blue stains reticulocytes poorly). The circulating erythrocytes that contain organelles and thus have a reticulum of blue stain, are termed reticulocytes [12]. Reticulocytes have generally been in the circulation for 24 hours or less and thereafter they lose organelles and fail to stain as reticulocytes. The quantity of reticulum (i.e., nucleic acid) in an erythrocyte diminishes as it matures, thus in the youngest reticulocytes the reticulum is densely packed while in the oldest ones only a few scattered threads are found. Reticulocytes are on average about 20% larger than mature erythrocytes [13]. Scanning electron microscopy has shown that reticulocytes are not generally bilaterally indented disks like mature erythrocytes, but rather are irregularly shaped and polylobulated.
A neonatologist usually orders a reticulocyte count to assess the level of erythrocyte production, because high reticulocyte counts signify increased erythropoiesis and counts of 0 signify a low level of effective erythropoiesis. Reticulocytes can be reported in at least three different ways, which can sometimes be confusing: (1) as a percentage, (2) as an absolute number, or (3) as a corrected value. The immature reticulocyte fraction (IRF) is also gaining popularity among neonatologists [14].
A reticulocyte percentage is the percentage of erythrocytes that stain as reticulocytes. An obvious limitation of this method is that it fails to account for differences in the absolute number of erythrocytes. For example, each of two neonates may have a reticulocyte count of 5%. The neonatologist may be tempted to conclude that the two patients have similar levels of erythrocyte production. However, the first patient is anemic, with an erythrocyte count of 2 × 10⁶/µL, and the other is not anemic, with an erythrocyte count of 4 × 10⁶/µL. The anemic infant actually has only one-half the number of reticulocytes in the circulation (5% of 2 × 10⁶, or 100,000 reticulocytes/µL of blood) as does the normal infant (5% of 4 × 10⁶, or 200,000 reticulocytes/µL). Failure to recognize this pitfall can give the neonatologist the false impression that the anemic patient is mounting an appropriate increase in erythrocyte production. Reporting the reticulocyte count as an absolute number appears to be gaining popularity in neonatal intensive care units. In reporting the results of clinical trials of recombinant erythropoietin administration to preterm neonates, it has been more common to report a percentage because it gives a clearer comparison of effective erythropoiesis between groups, despite differences in hematocrit.
A third method of reporting reticulocytes is by using one or two corrections. One type of correction is for hematocrit. The reticulocyte percentage is adjusted to a standard hematocrit (hct), usually 45% (0.45 L/L) and the correction is applied as follows:

This correction is usually appropriate for neonatal patients and provides a better framework for assessing the level of effective erythropoiesis, because it normalizes all values to a standard hematocrit.
Another type of correction is sometimes made for “shift” reticulocytes. This correction accounts for the observation that whereas reticulocytes generally survive in the circulation for about 1 day, during increased erythropoiesis even younger reticulocytes can be released from the marrow to the blood (i.e., shifted). These shift reticulocytes, prematurely released from the marrow into the blood, survive longer than 1 day in the blood before losing their organelles, giving the false impression that the reticulocyte count is higher than it actually is. When reticulocytes survive in the circulation for 2 days, rather than 1 day, the correction for shift reticulocytes is made by reducing the percentage reported by half. To apply this correction, the degree of shift is assumed to be related to the intensity of stimulation of the marrow by erythropoietin. The examiner assumes that the maturation time of the reticulocyte in the circulation is 1 day when the hematocrit is normal, 1.5 days when the hematocrit is reduced moderately, and 2.0 days when the hematocrit is reduced markedly. With a hematocrit of 20%, the physician assumes a marked erythropoietic effort, causing a shift in premature reticulocytes that survive 2 days in the circulation:

The shift reticulocyte count correction is rarely used by neonatologists. The correction for shift reticulocytes is only appropriate when the anemia is the result of hemorrhage or hemolysis, because it assumes that erythrocyte production has increased in response to the anemia. If the anemia is the result of hypoproduction of erythrocytes the reticulocyte count correction for shift reticulocytes would not be valid. Because relative hypoproduction of erythrocytes is thought to be a common component of anemia in preterm infants, the use of this correction might be misleading.
On the day of birth, normal term infants have reticulocyte values of 4% to 7% and absolute reticulocyte counts of 200,000 to 400,000/µL [15]. Infants delivered prematurely have somewhat higher reticulocyte counts; values of 6% to 10% and absolute counts of 400,000 to 500,000/µL are common [16]. In healthy neonates, reticulocyte levels fall markedly over the first few days of life. By the fourth day the reticulocytes can be 0% to 1%, with an absolute count of 0 to 50,000/µL.
Immature Reticulocyte Fraction and RET-He
The immature reticulocyte fraction (IRF) is a measure of the proportion of reticulocytes with intense reticulum staining. A threshold is set, and the fraction of reticulocytes staining above that threshold reflects the “young” reticulocytes. Thus, a high IRF is used as a parameter of brisk erythropoiesis. Thus, after erythropoietin treatment, the IRF might increase; contrariwise after an erythrocyte transfusion the IRF might fall.
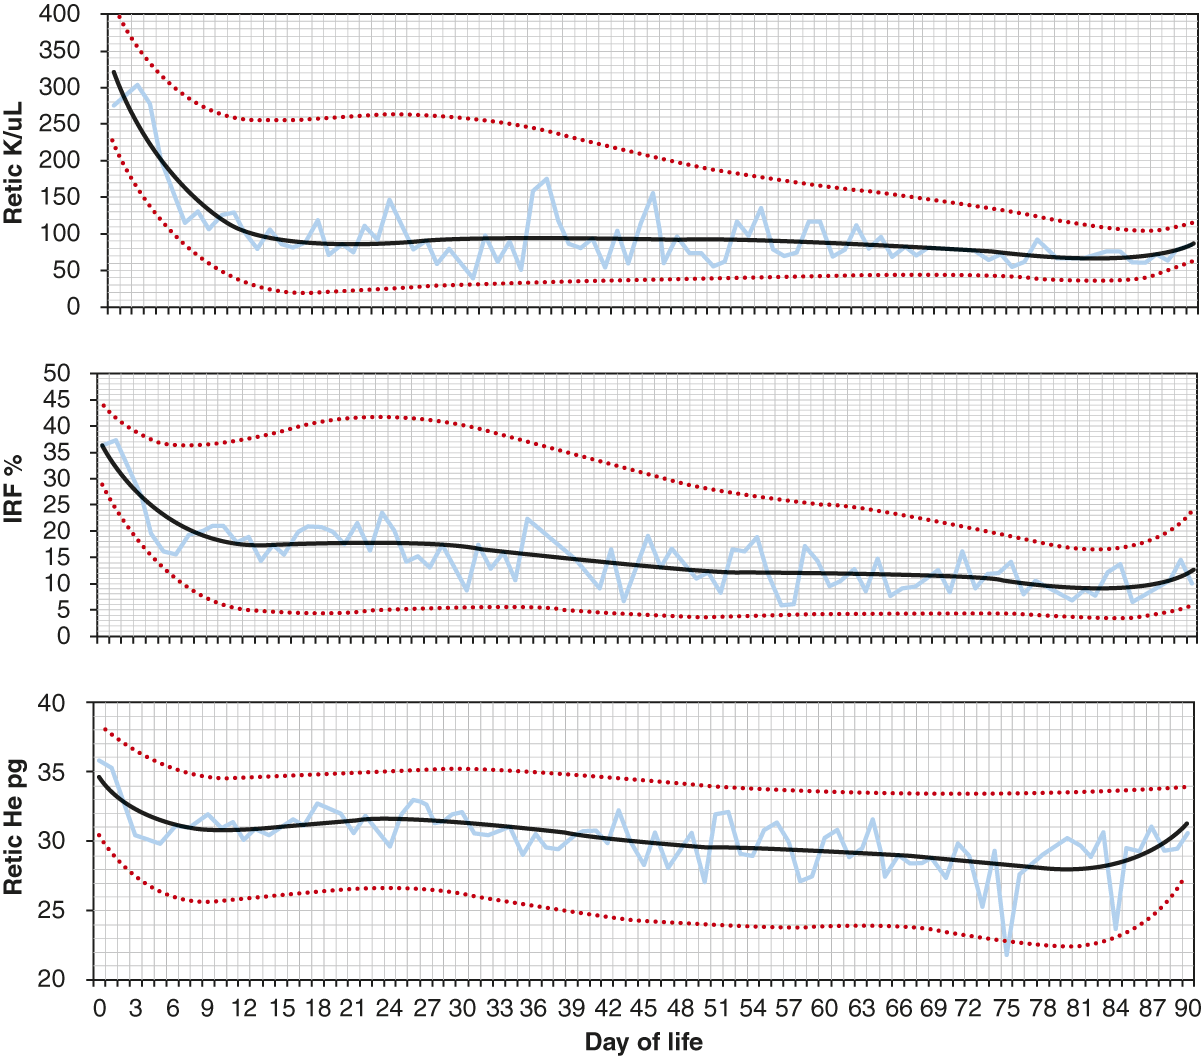
The reticulocyte hemoglobin content (RET-He) is a quantification of the hemoglobin in reticulocytes. This parameter gives information about the availability of iron for hemoglobin synthesis in the days immediately before the specimen was collected [17, 18]. The RET-He has been used in the assessment of iron deficiency. With limited iron stores, subnormal amounts of iron are available to developing erythrocytes in the marrow for incorporation into hemoglobin, and therefore the amount of hemoglobin in reticulocytes, the RET-He parameter, is low. The RET-He remains at the same values in erythrocytes from the time they enter the blood until they are removed from the circulation. Figure 24.10 shows reference intervals for reticulocytes, the IRF, and the RET-He over the first 90 days following birth.
Fig. 24.10 Reference intervals for reticulocytes per microliter blood, immature reticulocyte fraction (IRF) (%), and RET-He (pg) over the first 90 days following birth. The lower line shows the 5th percentile values, the middle line shows the mean values and the upper line shows the 95th percentile values.
Nucleated Red Blood Cells
Nucleated red blood cells (NRBC) are often observed in the blood of term and preterm neonates [19–22]. A high concentration of NRBC at birth has been associated with an increased risk of developing intraventricular hemorrhage and or retinopathy of prematurity [22]. Circulating NRBCs are rarely observed in healthy adults and non-neonatal children, because the nucleus of a developing normoblast is almost always extruded before the cell exits the marrow. Enucleation is so efficient that finding NRBC in the blood of older children raises the suspicion of hematopathology such as a myeloproliferative disorder.
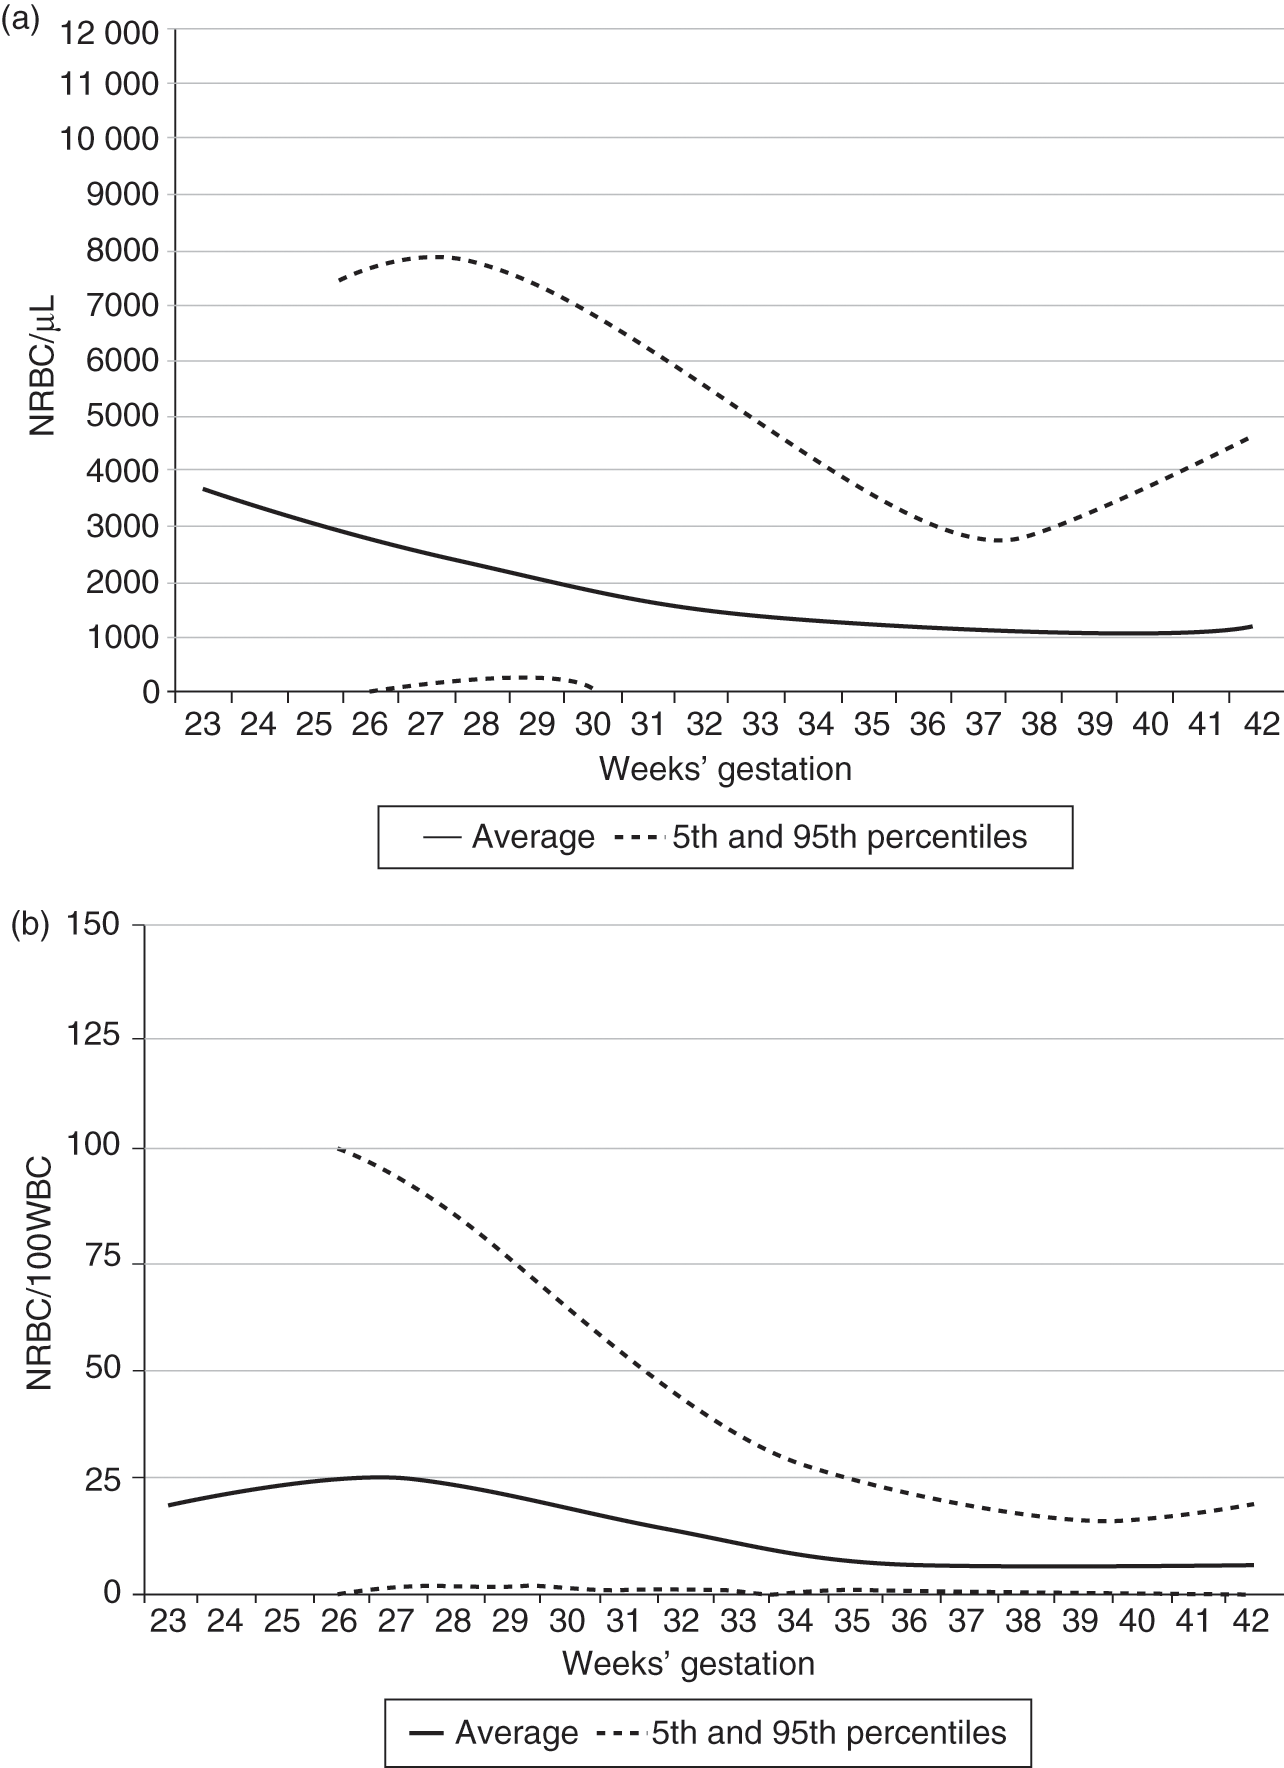
Reference ranges for NRBC using a dataset of over 30,000 neonates, on the day of birth, are shown in Fig. 24.11 as a function of gestational age [19]. In this large study, no relationships were observed between the highest first-day NRBC and the cord pH or the 1 minute or 5 minute Apgar score, but if the NRBC count on the day of birth was above the 95th percentile, the odds of developing severe intraventricular hemorrhage (IVH) were 4.28 (95% CI; 3.17–5.77) and the odds of developing severe retinopathy of prematurity (ROP) were 4.18 (2.74–6.38).
Fig. 24.11 Reference ranges for blood concentrations of NRBC on the day of birth are displayed according to gestational age. The lower and upper lines represent the 5% and 95% limits and the middle line represents the mean value. (a) Shows the data expressed as “NRBC/µL” and (b) shows the data expressed as “NRBC/100WBC.”
Fragmented Red Cells
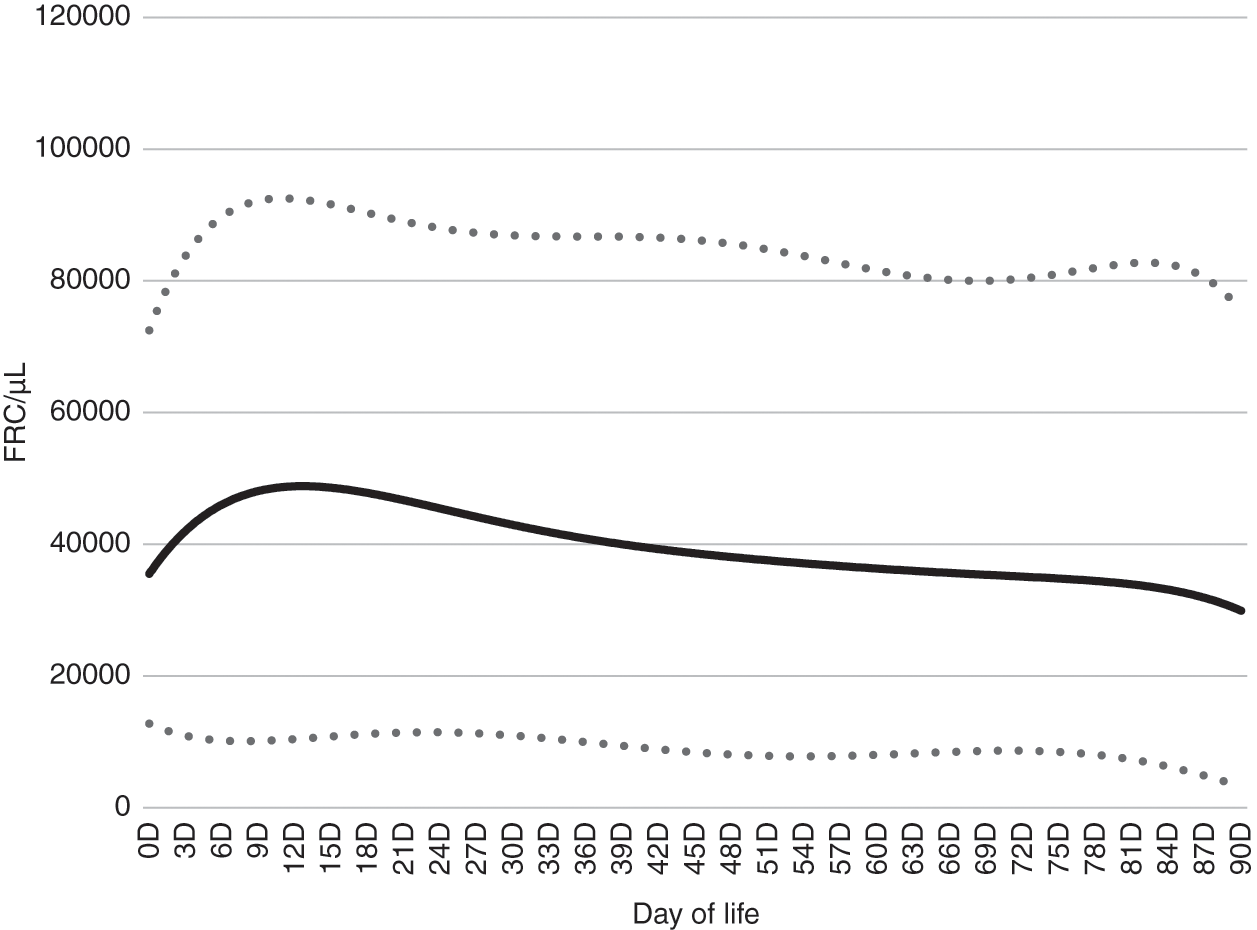
The CBC parameter “fragmented red cells” (FRC) was developed for certain automated cell counters using technology similar to flow cytometry. A “gate” is set to quantify cells just smaller than those in the red blood cell gate. The FRC parameter can be expressed either as a percent (the percent of the red blood cells that fall within the gate, just smaller in size than red blood cells) or as an absolute number of these cells per microliter of blood. In neonates the FRC parameter is generally composed of schistocytes, but cells in this gate also include microcytes and other red blood cell subspecies that are smaller than those within the normal red blood cell gate. Figure 24.12 shows FRC/µL over the first 90 days after birth [23].
Fig. 24.12 Reference intervals for fragmented red cells/µL blood over the first 90 days after birth. The lower and upper lines represent the 5% and 95% limits and the middle line represents the mean value.
were discocytes, only about 40% of the erythrocytes of neonates had this characteristic shape. Morphologic abnormalities of erythrocytes of neonates have also been reported using other methods. For instance, interference-contrast microscopy shows pits or craters on the surface of about 2.6% of erythrocytes of healthy adults. In contrast, about 25% of the erythrocytes of term infants and about one-half of the erythrocytes of preterm infants have pits [25]. It is believed that these pits are cytoplasmic vacuoles and represent hypofunction of the spleen or reticuloendothelial system, but their significance is not clear.
Site of Sampling
The hematocrit, hemoglobin concentration, and erythrocyte concentration of newborn infants vary, somewhat predictably, according to the vascular source from which the sample is obtained (see Table 24.2) [26–34]. In general, erythrocyte values are higher (i.e., more concentrated) when samples are obtained by lancing capillary beds than when drawn from an artery or a vein or obtained from an indwelling arterial or venous catheter. The specific anatomic site of the vein, artery, or capillary bed sampled appears not to affect the results. For instance, values obtained from a femoral vein are equivalent to those obtained from a scalp vein [28, 29], and values from an umbilical artery are equivalent to those from a radial artery. Similarly, values from a capillary bed, such as from a heel, toe, or finger, are also equal if perfusion of those sites is similar [29].
Table 24.2 The effect of site of blood sampling on hematocrit or blood hemoglobin concentrations of neonates
| Anatomic sites of comparison | Average difference | Author | Year |
|---|---|---|---|
| Capillary vs. femoral vein | Capillary 10% higher | Vahlquist [31] | 1941 |
| Great toe vs. internal jugular | Capillary 21% higher | Oettinger & Mills [26] | 1949 |
| Capillary vs. venous | Capillary 5% higher | Mollision [32] | 1951 |
| Heel vs. scalp or femoral vein | Capillary 15% higher* | Oh & Lind [27] | 1966 |
| Patients with erythroblastosis fetalis; heel vs. umbilical vessel | Capillary 25% higher | Moe [28] | 1967 |
| Capillary vs. umbilical vessel | Capillary 10%–21% higher | Linderkamp et al. [29] | 1977 |
| Heel vs. antecubital vein | Capillary 12%–20% higher | Rivera & Rudolph [33] | 1982 |
| Heel vs. UAC | Capillary 15% higher | Thurlbeck & McIntosh [34]** | 1987 |
Notes: UAC, umbilical artery catheter.
* The capillary hematocrit was only 5% higher when the heel was warmed.
** Preterm infants, 24 to 32 weeks’ gestation, with respiratory distress.
As a general rule, capillary blood obtained from a neonate’s poorly perfused extremity is a poor source on which to base clinical decisions. The erythrocyte values from such a source are about 15% (range of 5% to 25%) above those of simultaneously obtained venous or arterial blood. Capillary values obtained from a poorly perfused extremity can erroneously indicate the diagnosis of polycythemia and can erroneously exclude anemia. The amount that a capillary hematocrit is elevated above a venous or arterial hematocrit cannot be accurately predicted in individual cases, but in general it appears to vary with perfusion of the extremity.
When a CBC is obtained from a sick neonate with poor skin perfusion, the neonatologist interpreting the value should realize that a capillary hematocrit is less informative and less reproducible than a venous or an arterial hematocrit. Oh and Lind [27] and Lindercamp and colleagues [29] found that infants of the shortest gestation generally have the largest difference in capillary and venous hematocrits (Table 24.2). Studies by Oh and Lind [27] and by Moe [28] indicate that warming the extremity before lancing the capillary bed can result in a better correlation between capillary and venous hematocrits. However, when a neonatologist feels it important to detect changes in serial hematocrit samples, it should likewise be important to keep a uniform site of sampling (i.e., all venous or all arterial). When comparing serial hematocrits of an ill neonate, it is useful to have the sample site documented.
Stay updated, free articles. Join our Telegram channel

Full access? Get Clinical Tree


