Abstract
Polycythemia of the newborn is first mentioned in the Bible as Esau and Jacob are described at the time of their birth. Esau appears to be the recipient of a twin-to-twin transfusion (Genesis 25:25: “The first one emerged red …”). There is little in the modern medical literature concerning polycythemia in the newborn until the early 1970s [1–5]. During this time, there were a number of case reports and small series of infants with various symptoms that were thought to be secondary to an elevated hematocrit and blood viscosity. It was not until the 1980s that several investigators systematically examined the association between polycythemia, hyperviscosity of the blood, and organ-system dysfunction. These studies have done much to enlighten our understanding of the relationships between abnormalities of the hematocrit, blood viscosity, organ blood flow, and organ function. The dissemination of this knowledge has provided a clinical approach that is based on well-defined data and has clarified the role of polycythemia as an etiologic factor for organ dysfunction in the neonate.
Introduction
Polycythemia of the newborn is first mentioned in the Bible as Esau and Jacob are described at the time of their birth. Esau appears to be the recipient of a twin-to-twin transfusion (Genesis 25:25: “The first one emerged red …”). There is little in the modern medical literature concerning polycythemia in the newborn until the early 1970s [1–5]. During this time, there were a number of case reports and small series of infants with various symptoms that were thought to be secondary to an elevated hematocrit and blood viscosity. It was not until the 1980s that several investigators systematically examined the association between polycythemia, hyperviscosity of the blood, and organ-system dysfunction. These studies have done much to enlighten our understanding of the relationships between abnormalities of the hematocrit, blood viscosity, organ blood flow, and organ function. The dissemination of this knowledge has provided a clinical approach that is based on well-defined data and has clarified the role of polycythemia as an etiologic factor for organ dysfunction in the neonate.
Definitions
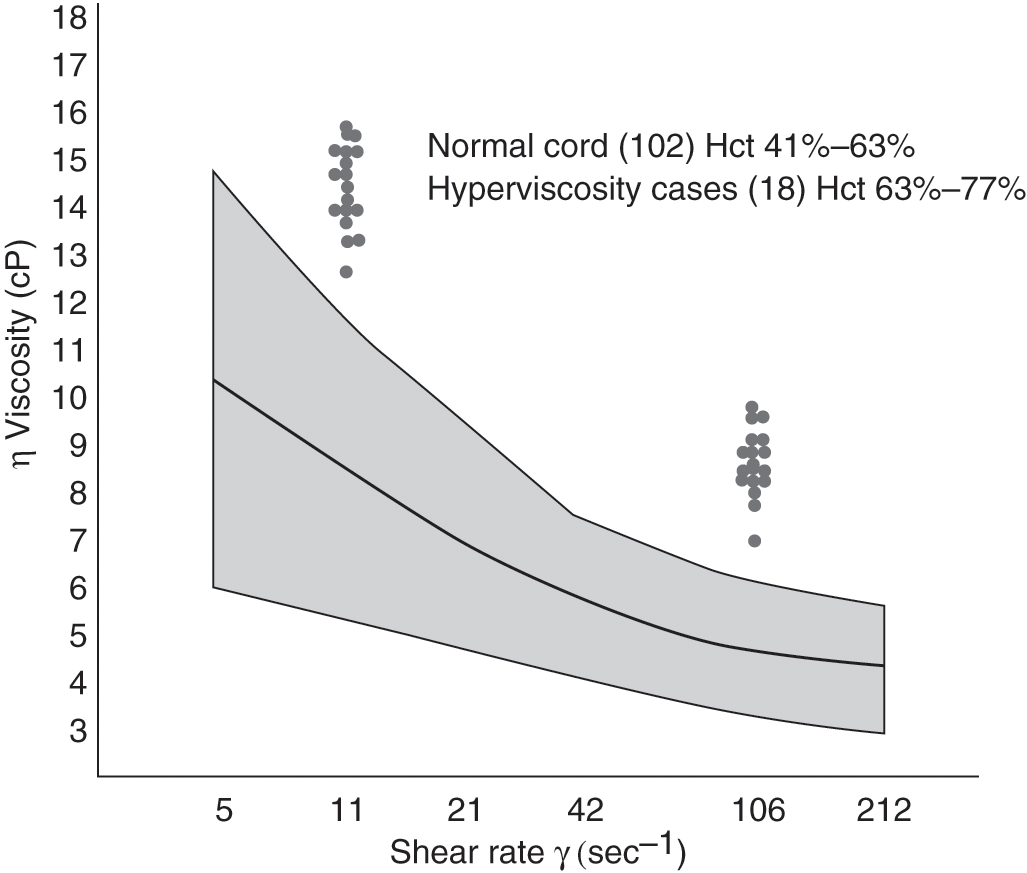
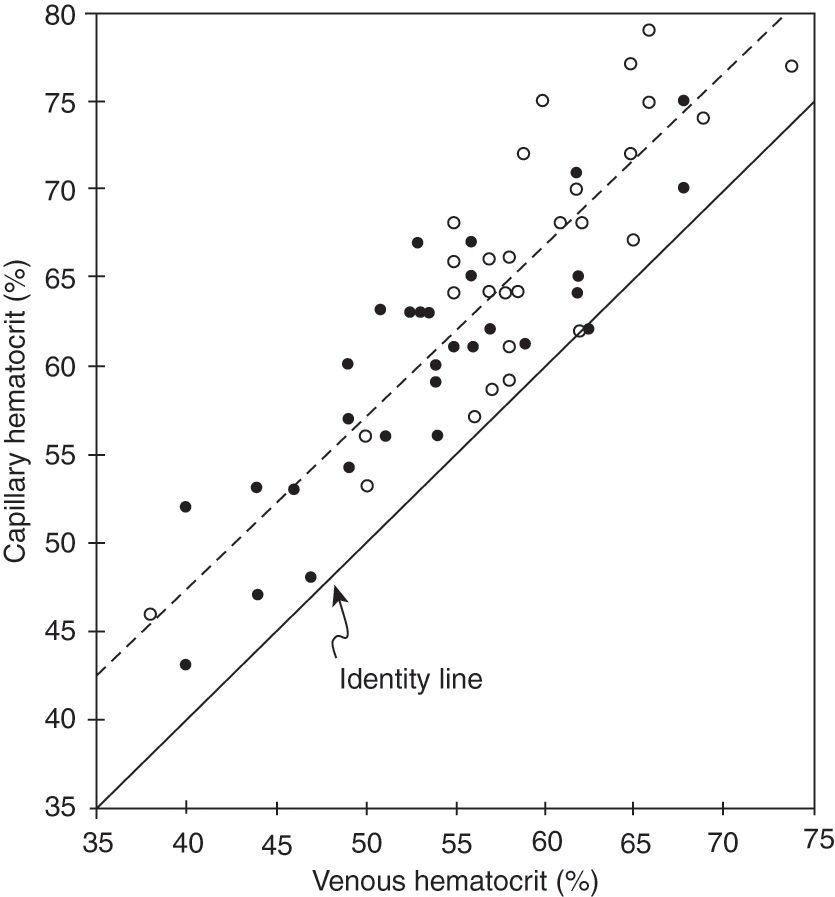
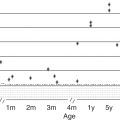
Definitions of polycythemia and hyperviscosity have varied by study and methodology. Common variables have been the source of the blood sample and the age of the infant at the time of measurement [6–11]. In many studies, a hematocrit value of 65% or above has been diagnostic for polycythemia. Using cord blood from appropriate-for-gestational-age (AGA) infants, Gross and colleagues defined hyperviscosity as a value that was two standard deviations greater than the mean (Fig. 11.1) [5]. Using blood samples from three different sites (peripheral vein, umbilical vein, and capillary), Ramamurthy and Brans defined hyperviscosity as a value that was three standard deviations from the mean [6]. This coincided with an umbilical venous hematocrit value of 63% or above. This study also found that capillary samples were higher than those from the peripheral vein, which in turn were greater than those from the umbilical vein. This is consistent with findings published previously by Oh and Lind [7]. In their study, the capillary hematocrit was consistently 10% higher than simultaneously obtained peripheral venous samples. Data from this study have been replotted and shown in Fig. 11.2. Based on population data from many sources, it is now accepted that polycythemia should be defined as a hematocrit value of 65% or above from a large, freely flowing peripheral vein. In a parallel manner, hyperviscosity should be defined as a value of more than two standard deviations from the mean.
Fig. 11.1 The shaded area represents the viscosity of cord blood at shear rates from 2 to 212/s for 102 healthy full-term appropriate-for-gestational-age infants (mean ± 2 SD). Viscosity for 18 “symptomatic” infants is plotted at shear rates of 11/s and 106/s. Hematocrit (Hct) values for each group are indicated.
Fig. 11.2 Correlation between capillary and venous blood hematocrit in newborn infants. (○) 1–6 h; (●) 12–24 h.
Incidence
The incidence of polycythemia is 2%–5% of all infants born at term [6, 8–11]. Factors known to influence the hematocrit at birth are listed in Table 11.1. Delay in clamping of the umbilical cord will result in a significant increase in hematocrit and blood volume [12–15]. A recent Cochrane Review that included 12 trials and 3,139 infants show an increase of 0.49 mg/dL associated with delayed cord clamping and no infants with polycythemia [16]. From birth to 6–12 hours of age, the hematocrit will increase due to shifts in body water [11, 17]. By 24 hours of age, the hematocrit will become similar to the value at birth and will remain relatively stable. Infants who experience fetal distress, with abnormalities in fetal growth, with genetic abnormalities and of mothers with poorly controlled diabetes have an increased incidence of polycythemia. Acute fetal distress results in a shift of blood volume from the placenta to the fetus, leading to an increased blood volume and red-cell mass. Those infants who experience intrauterine growth retardation or fetal hyperglycemia exist in a relatively hypoxic intrauterine environment. This results in increased erythropoietin production, increased red-cell mass, and a greater likelihood of polycythemia. Birth at centers located at higher elevations also is associated with a greater incidence of polycythemia. This was documented in two studies by Wirth and colleagues [8, 9], who noted that the incidence of polycythemia in Denver, Colorado (1,610 m above sea level), was twice that in Norfolk, Virginia (sea level).
Viscosity
It is important to have an understanding of the physics of the flow of fluids to understand how blood viscosity affects blood flow in the newborn infant. It will also allow for the understanding of the clinical symptoms observed in infants with an elevated hematocrit.
Definition
Viscosity, as defined by Poiseuille, is the ratio of shear stress to shear rate, as demonstrated in the formula below [18]:

in which η is blood viscosity (dyn∙s/cm2, or poise), p − p′ is the pressure gradient along the blood vessel, r is the radius, L is the length of the blood vessel, and Q is blood flow. The shear stress that represents the pressure gradient along the blood vessel is expressed in dyne [19]. The shear rate, which represents the velocity between two fluid planes, divided by the distance between them, is expressed as reciprocal seconds, s−1.
As demonstrated in Poiseuille’s original work, the ratio of shear stress to shear rate, or viscosity, of a fluid is constant. However, this is true only for homogeneous or Newtonian fluids. Blood is a suspension of particles in a solution and does not behave as a Newtonian fluid. The viscosity of blood does not remain constant with variations in shear stress and shear rate. This can be demonstrated in vitro using a cone/plate viscometer, such as that described by Wells and colleagues [20]. In this device, shear rate can be varied and the resultant shear stress measured.
Shear rates in large vessels such as the aorta are greater (100–300/s) than those observed in small vessels such as arterioles (11–25/s) [19]. Using the above formula, one would then predict that the viscosity of the blood would be lower in large vessels and higher in small blood vessels (see later in this chapter for exceptions to this rule). While knowing the shear rate in a particular vessel will allow an estimate of the blood viscosity and a microviscometer will allow in vitro measurement of blood viscosity, there are multiple factors that can vary the in vivo viscosity of the blood. These other factors are reviewed below.
Factors That Affect Blood Viscosity
It is pertinent to understand all of the factors that contribute to whole-blood viscosity, although the primary determinant of blood viscosity in the newborn is the red blood cell (RBC) concentration.
Hematocrit
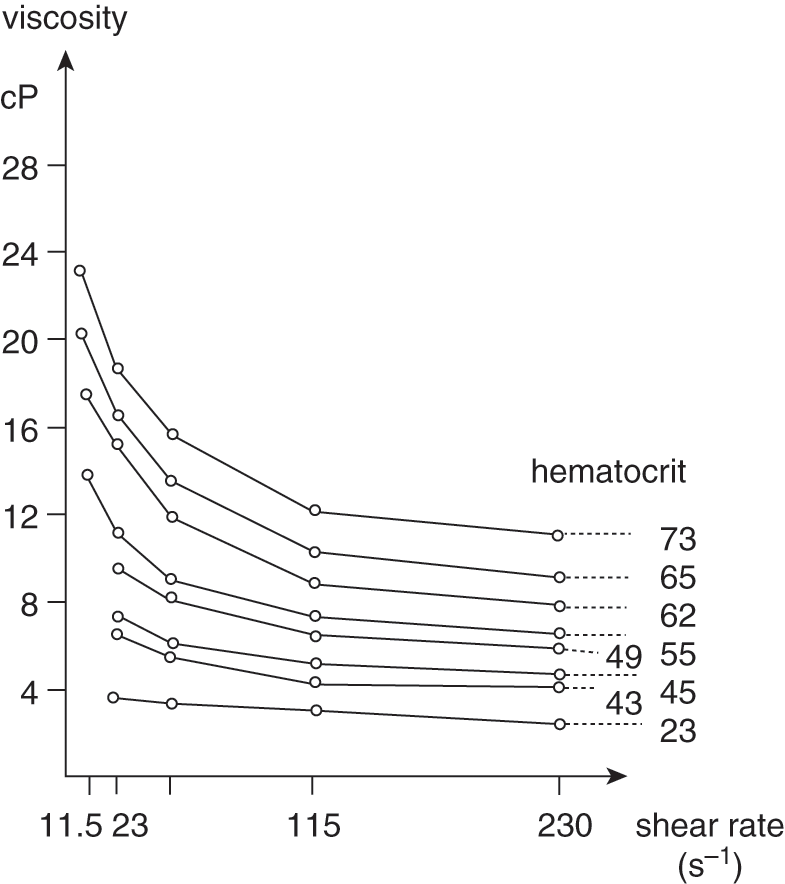
The hematocrit, a reflection of the RBC concentration, has a logarithmic relationship with blood viscosity at shear rates (Fig. 11.3). The greatest changes occur at the lowest shear rates and at hematocrits that exceed 65% [17, 21].
Fig. 11.3 Variation of whole-blood viscosity in eight newborn infants at different hematocrit values and shear rates.
Plasma Proteins
The plasma has a viscosity of 1.0–1.5 centipoise (cP), similar to the viscosity of water [22–24]. Water, with a viscosity of 1 cP, behaves as a Newtonian fluid, as the viscosity is constant at all shear rates. As such, the plasma protein contributes little to blood viscosity under normal conditions. Adult syndromes of hyperviscosity can be attributed to hyperproteinemia in conditions such as diabetes and Waldenstrom’s macroglobulinemia. These are not conditions observed in the newborn [25–27].
Red Blood Cell Deformity
The RBC is the major contributor to whole-blood viscosity, because it is the most prominent particle suspended in the blood and because of its intrinsic properties. The RBC consists of a membrane that moves around a body of internal fluid, making it a dynamic particle [24, 28]. The surrounding membrane is quite deformable, with the RBC of the newborn having a greater degree of deformability than that of the adult [27, 29]. The viscosity of the internal fluid of the RBC will increase with cell age [30]. The internal viscosity also appears to increase with decreasing blood flow and external shear rate.
White Blood Cells
The white blood cell of the newborn is larger and less deformable than the RBC. It has been shown that extremely high concentrations of white blood cells, as observed in congenital leukemia, can increase the whole-blood viscosity [31–33].
Fibrinogen
Due to its low concentration in the blood of the newborn, fibrinogen contributes little to whole-blood viscosity [23].
Platelets
Although they are relatively inflexible particles, platelets do not appear to affect blood viscosity in the normal state. In adults with vaso-occlusive disease, platelet aggregates may affect the viscosity of the blood in narrowed vascular areas [22]. Platelet aggregates do not appear to be a factor in the blood viscosity of newborn infants with normal hematocrits or polycythemia.
Blood pH
Whole-blood viscosity increases with pH below 7.00 [22, 34]. This is due to a shift of the fluid into the RBCs with acidosis. This may be one of the factors responsible for an increase in blood viscosity in asphyxia, along with the associated placental transfusion that also increases the blood volume of the infant.
Vessel Size
In large blood vessels, such as the aorta, blood flow and shear rate (100–300/s) are high. Therefore, the apparent viscosity of the blood is low. The opposite is true in small blood vessels. Blood flow and shear rate are low (11–25/s) and viscosity is high. As shown in Fig. 11.3, changes in hematocrit cause the greatest changes in viscosity in the small blood vessels.
While blood behaves as a non-Newtonian fluid in large and small blood vessels, the opposite is true in the capillaries of most organs. The diameter of capillaries is in the range of 3–5 μm while the RBC has a diameter of 8.5 μm. As shown by Fahraeus and Lindqvist, viscosity actually decreases with diminishing size of the capillary (see Fig. 11.4) [35]. This phenomenon has been confirmed in vivo in capillaries as narrow as 3 μm [24]. The term “bolus flow” has been given to this phenomenon. It reflects high hemodynamic efficiency. Measurements of the viscosity in the capillary are in the range of 1.3 cP, similar to those of plasma and water. As observed in Fig. 11.4, the hematocrit of the blood does not affect the viscosity in the capillary. Thus, it is important to keep in mind that in vitro measurements of blood viscosity may not reflect the in vivo viscosity of the blood in the capillary. Dintenfass has suggested that viscosity may increase again as the capillary size decreases below 4 µm [22]. The variation in capillary size in different organs may therefore explain why changes in hematocrit and viscosity seem to have an effect on flow in some organs but no effect in others.
Hemodynamics
Many of the clinical problems observed in infants with polycythemia and hyperviscosity have been ascribed to disturbances in organ blood flow. Therefore, it is essential to understand how changes in hematocrit and blood viscosity affect the blood flow of the different organs of the newborn infant.
Cardiopulmonary Blood Flow and Function
The primary change in cardiac function is decreased output, which is associated with an increase in arterial oxygen content, no change in oxygen transport/delivery or consumption in the myocardium or whole body, and increased pulmonary and, to a lesser extent, systemic resistance [36–44]. These findings have been observed in both appropriate animal models and human newborn infants.
The decrease in cardiac output appears to be the result of a reduction in stroke volume and heart rate, or both [44]. In our own studies of polycythemic infants, we found that heart rate increased following a partial exchange transfusion (PET) with Plasmanate® to decrease the hematocrit and maintain blood volume [40]. Swetnam and colleagues found that following PET, there was an increase in heart rate, stroke volume, and cardiac output as well as systemic oxygen transport [44]. Studies of myocardial oxygenation have shown that polycythemia and changes in blood viscosity do affect blood flow but do not adversely affect oxygen transport and consumption [38].
The changes in systemic and pulmonary circulation with changes in hematocrit have been demonstrated in both newborn animal and human studies [39, 41]. Fouron and Hebert have shown in the newborn lamb model that pulmonary resistance increases to a greater extent than systemic resistance with increases in hematocrit [41]. At hematocrit values of 70%, pulmonary vascular resistance was equal to systemic resistance. The change in pulmonary resistance will also change the direction in blood flow through the ductus arteriosus if it is still patent. These findings are similar to those found in a study of human infants [45]. The change in pulmonary resistance with elevation of the hematocrit is thought to explain, in part, the cardiopulmonary symptoms that have been reported by Gatti and colleagues as well as the plethoric or cyanotic appearance observed by many clinicians [42].
Gastrointestinal Blood Flow and Oxygenation
Gastrointestinal blood flow has been studied in animal models [36, 43]. In the newborn piglet, polycythemia is associated with a decrease in blood flow but normal oxygen transport. However, oxygen extraction and uptake are reduced, suggesting abnormalities in local regulation of oxygen uptake that are not related to oxygen availability. The underlying etiology is unclear.
Liver and pancreatic function have been reported in the term newborn with polycythemia [46]. Compared with infants with normal hematocrit, the study found an elevated bile concentration in the serum and a low lipase and trypsin activity in duodenal juice on the first day of life. PET tended to normalize the bile acid and lipase concentrations. These findings suggest that polycythemia affects the enterohepatic circulation of bile acids and the exocrine pancreatic function during the first days of life. However, it should be noted that there were no clinical symptoms associated with these findings. Therefore, the implications for short- and long-term management as well as nutritional consequences are not clear.
Renal Blood Flow and Function
Kotagal and Kleinman studied renal function in a puppy model of normovolemic polycythemia [47]. Renal blood flow was unaffected by the elevation in hematocrit. However, the decrease in plasma volume resulted in a lower plasma flow and glomerular filtration rate (GFR). The urine output was also lower, as was the Na+ and K+ excretion. There was no change in systemic blood pressure or renal blood flow. Therefore, the calculated renal vascular resistance was not increased by the change in hematocrit. This suggests that the Fahraeus–Lindqvist effect (decreased viscosity as vessel size decreases) is present in the kidney.
In a study of renal function in normovolemic and hypervolemic newborn infants, Oh and colleagues found that renal function was affected by blood volume [12]. One group of infants had late cord clamping and a mean hematocrit of 62%, while those with immediate cord clamping had hematocrit of 50%. The group with late cord clamping had higher blood and RBC volume, mean arterial blood pressure, and renal blood flow as well as a greater GFR and urine output compared with the group with immediate cord clamping and normal blood volumes.
The apparent discrepancy between these two studies can be explained by the methodology. In the puppy model, blood volume was held constant so that plasma volume and flow were reduced in subjects with polycythemia. In the human study, the expanded blood volume was accompanied by a normal plasma volume and flow. Therefore, renal function in infants is a function of not only hematocrit but also blood volume. Infants with normovolemic polycythemia would be expected to have a reduction in renal function, while those with an increased blood volume should have normal renal function.
Carcass Blood Flow
Studies of isolated muscle in calf and dog models have shown that despite changes in blood flow associated with polycythemia, oxygen transport, and uptake are normal in resting and working muscle [48–51]. Studies of peripheral blood flow in newborn infants show an increase in blood flow following PET [44]. Transcutaneous oxygen measurements are normal in polycythemia [51]. These studies suggest that polycythemia and hyperviscosity do not adversely affect oxygenation of the carcass.
Brain Blood Flow and Oxygenation
In 1982, we published the first study to document changes in the cerebral circulation of polycythemic newborn infants using Doppler techniques [40]. Polycythemic infants were found to have a significant reduction in cerebral blood flow (CBF) velocity compared with similar term infants with normal hematocrit and blood viscosity values. Following PET to lower the hematocrit and blood viscosity, the CBF velocity measurements increased and were similar to those of the control infants.
Jones and colleagues demonstrated in newborn lambs that CBF was correlated inversely with the arterial oxygen content of the blood in studies in which hematocrit and oxygen levels were varied independently [52]. Viscosity, which was not measured, presumably varied with the changes in hematocrit. Since the blood viscosity was not measured, Jones and colleagues could not state conclusively that it played a role in the observed changes in blood flow. However, the study concluded that arterial oxygen content was the primary determinate of CBF when other variables, such as cerebral metabolic rate, are constant.
To answer the question about the role that blood viscosity might play in the cerebral circulation, we designed a study in newborn lambs in which arterial oxygen content and blood viscosity were varied independently [53]. Using isovolemic exchange transfusion of newborn lamb RBCs, we increased the hematocrit, arterial oxygen content, and blood viscosity. This was associated with a decrease in the CBF. Sodium nitrite was then infused to cause methemoglobin formation and to decrease the arterial oxygen content while maintaining the increased blood viscosity. The CBF values increased to control levels. Cerebral oxygen delivery was constant throughout the study. From this, we concluded that the decreased CBF observed with polycythemia and hyperviscosity is due to the associated increase in arterial oxygen content.
Following these studies, Goldstein and colleagues varied blood viscosity by increasing the concentration of fibrinogen in the blood to see whether this would affect CBF in a newborn-lamb model [54]. Again, it was found that CBF varied with the arterial oxygen content, and not with the blood viscosity. Lastly, we found in a study of newborn lambs that polycythemia does not affect the uptake of oxygen or the metabolic rate of the brain, as long as usual brain substrates are available [55].
In conclusion, brain blood flow is decreased in infants with polycythemia. Blood viscosity is not responsible for this reduction in blood flow. Therefore, it would appear that the Fahraeus–Lindqvist effect is functional in the vasculature of the brain. That is, classic cerebral autoregulation is intact in infants with polycythemia and who have not suffered from some type of brain injury such as brain hypoxia or trauma.
Fetal Blood Flow and Oxygenation
There is little information on the in utero effects of polycythemia and hyperviscosity on the fetus. Tenenbaum and colleagues performed isovolemic packed red cell transfusion on fetal lambs using adult sheep RBCs [56]. This resulted in an increase in hematocrit and viscosity, no change in venous oxygen content, and a decrease in umbilical blood flow and oxygen delivery. However, there was an increase in oxygen extraction, so that fetal oxygen uptake was not affected by the polycythemia. It should be noted that it is not clear what the effects of hypervolemic polycythemia might have on the fetus. This is an important point, as shifts in placental–fetal blood volume distribution are not uncommon (e.g., fetal hypoxia). In addition, there are no data on polycythemia and hyperviscosity and regional blood flow and oxygenation in the fetus.
Etiologies
There are three major categories of etiologies or clinical scenarios in which polycythemia and hyperviscosity may be observed. As outlined in Table 11.2, these include chronic fetal hypoxia, acute fetal hypoxia/asphyxia, and delayed clamping of the umbilical cord at delivery. Other less common causes and associations include maternal–fetal hemorrhage, fetofetal transfusion, and chromosomal abnormalities, including trisomy 21 and Beckwith–Wiedemann syndrome [2, 9, 13–15, 57–59].
|
Notes: IUGR, intrauterine growth retardation; SGA, small for gestational age
In the past, the most common cause of polycythemia was placental–fetal transfusion via delayed clamping of the umbilical cord. To avoid this problem, the cord should be clamped within 60 seconds of delivery of the body [15].
As discussed earlier in this chapter, altitude of the external maternal environment and intrinsic oxygen concentration are important but uncontrollable causes of polycythemia [8, 9].
Perinatal asphyxia and fetal hypoxia remain significant causes of polycythemia. Philip and colleagues examined placental residual volumes and neonatal outcomes [60]. Small placental residual blood volume was associated with fetal distress and low Apgar scores. Similar observations were made by Flod and Ackerman and Yao and Lind [61, 62]. Oh and colleagues demonstrated that intrauterine hypoxia resulted in a shift of blood from the placental compartment to the fetus [63]. There was a correlation between the length of the hypoxic event and the shift in blood volume. The data suggested that fetal vasodilatation associated with fetal hypoxia was part of the mechanism.
Fetuses with abnormal growth (small (SGA) or large (LGA) for gestational age) are at high risk for polycythemia [64]. This would appear to be secondary to chronic fetal hypoxia, which leads to increased erythropoietin levels, which in turn cause an increase in RBC production [65]. Over time, the red cell mass increases to increase the oxygen-carrying capacity and maintain a normal oxygen content in the face of a low PaO2. Clinical examples include pregnancies complicated by placental insufficiency and increased fetal metabolism. Placental insufficiency frequently exists in pregnancy-induced hypertension, HELLP (hemolysis, elevated liver enzymes, and low platelets) syndrome, post-term pregnancy, and maternal cigarette smoking. Poorly controlled diabetes during pregnancy is associated with an increased fetal metabolic rate, as is fetal hyperthyroidism [66]. Hod and colleagues have documented that fetal hypoxia and polycythemia can be prevented by good glycemic control in the pregnant woman [67].
Symptoms
This section will attempt to sort the clinical symptoms associated with polycythemia by organ system and to provide a physiologic explanation for the symptomatology. Table 11.3 lists symptoms that have been observed in populations of newborn infants with polycythemia and their frequency, as reported in several different series [68]. In addition, Gatti and colleagues reported prospectively on a population of 629 infants; 25 were polycythemic but none had any symptoms [42].
Table 11.3 Frequency of clinical symptoms observed in association with polycythemia
| Clinical symptoms | Gross et al. [5] (n = 18) (%) | Ramamurthy and Brans [6] (n = 54) (%) | Black et al. [100] (n = 111) (%) | Goldberg et al. [98] (n = 20) (%) |
|---|---|---|---|---|
| Cyanosis | 89 | 17 | 7 | nr |
| Plethora | 83 | 63 | nr | nr |
| Tremulous/jittery | 67 | 13 | nr | nr |
| Abnormal EEG | 33 | nr | nr | nr |
| Seizures | 28 | 0 | 0 | nr |
| Respiratory distress | 44 | 4 | 10 | 15 |
| Cardiomegaly | 17 | nr | nr | 85 |
| Lethargy/poor feeding | nr | 50 | + | 55 |
| Hyperbilirubinemia | 50 | 6 | nr | 5 |
| Abnormal blood smear | 50 | nr | nr | nr |
| Thrombocytopenia | 39 | nr | nr | 25 |
| Hypoglycemia | 33 | nr | 27 | 40 |
| Hypocalcemia | 6 | nr | nr | 0 |
Notes: EEG, electroencephalogram; nr, not reported or examined; +, greater incidence compared with control group
Investigators have noted an increased incidence of polycythemia in the SGA population of infants. While some have attributed observed abnormalities to polycythemia, Hakanson and Oh found the incidence of abnormalities in SGA infants with a normal hematocrit to be similar to that in those with polycythemia [69]. This observation serves as an important point. Many of the symptoms observed in infants with polycythemia are attributable to other perinatal problems associated with polycythemia, such as asphyxia and chronic hypoxia, and are not related directly to the polycythemia and hyperviscosity.
Abnormalities of Blood Volume
When the population of all polycythemic infants is studied, blood volume is increased for body weight at all gestational ages [12, 70, 71]. However, there is a fair amount of variability from infant to infant due to the multiple etiologies for the polycythemia. Saigal and Usher showed a significant relationship between infants with increased blood volume and infants with cardiorespiratory problems [57]. Brans and colleagues and Thorton and colleagues demonstrated that polycythemic infants do not differ from infants with normal hematocrits when total body water, mean extracellular water, mean intracellular water, and mean interstitial water are compared [71, 72]. Plasma volumes also appear to be normal.
Stay updated, free articles. Join our Telegram channel

Full access? Get Clinical Tree


