Cellular and Molecular Biology
Matthew J. Allen
The Cell Cycle
The transformation from a fertilized egg to a complex multi-cellular organism, be it a mouse or a human, depends on the complex and exquisitely regulated control pathways that govern the proliferation and subsequent differentiation of cells. The critical nature of the pathways that control cellular proliferation and growth is perhaps best illustrated by the fact that most cancers are the result of either inherited or induced defects in these control systems.
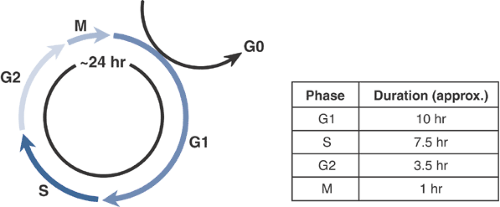
The cell cycle provides a mechanistic framework for explaining the temporal pattern of cellular activity that is required for one cell to divide (i.e., produce two identical daughter cells). The cell cycle is divided into four active phases and one inactive (quiescent) phase that may be more accurately considered outside of the cell cycle (Fig. 13-1, Table 13-1), since it is not involved in the production of a daughter cell. Although cells from different tissues may show vastly different proliferation rates, the length of the cell cycle is fairly constant, approximately 24 hours; the difference in proliferation rate is the result of differences in the length of time that cells remain in the quiescent phase.
Checkpoints in the Cell Cycle
Given the critical nature of accuracy in cellular proliferation, it should not be surprising to find that the cell cycle contains a number of “checks and balances” through which the integrity of DNA replication, spindle formation, and chromosome separation can be ensured. The feedback pathways by which these checks are made are known as checkpoints.
G1 Checkpoint
Passage is necessary before DNA synthesis can be initiated.
Failure to progress leads to accumulation of cells in G1.
G2/M Checkpoint
Passage is necessary for the tetraploid cell to split into daughter cells via the process of mitosis.
Failure to progress leads to accumulation of cells in G2.
Radiation therapy and chemotherapy can cause blockade of the G2/M checkpoint.
Cyclins and Cyclin-Dependent Kinases (Cdk)
Central effectors of cell cycle control at the molecular level
Disturbances in cyclin—Cdk interactions have been implicated in loss of cell cycle control in neoplastic conditions:
p53, a tumor suppressor gene, modulates the activation of cyclin D.
Mutations in p53 are present in a very large proportion of cancers.
Techniques for Studying the Cell Cycle
Labeling with Bromodeoxyuridine (BrdU)
Basis of the Technique
Synthetic analog of thymidine that is incorporated into newly formed DNA
Incorporation provides information on both magnitude and timing of DNA synthesis within a cell population.
Detection of BrdU Incorporation
Autoradiography
Location of radiolabeled BrdU is visualized by exposing the cells or tissues to x-ray film.
Immunohistochemistry
Detection within cells or histological specimens using antibodies.
Enzyme-linked immunoabsorbent assay (ELISA)
Detection and quantification using antibodies for in-vitro specimens
Flow Cytometry
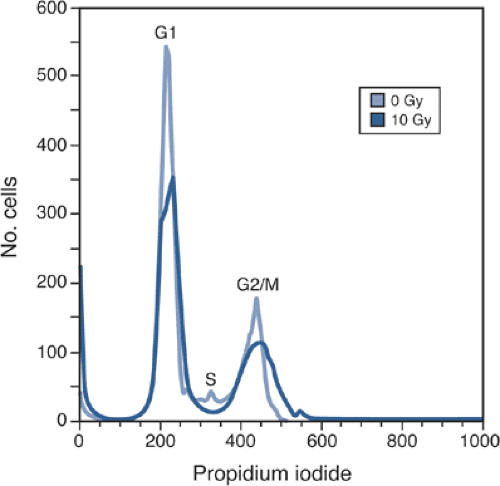
A DNA-binding dye (such as propidium iodide) is used to label the DNA.
Cells flow past a laser light source; scattering of beam provides measures of both cell number and size.
By combining information on cell size, number, and intensity of propidium iodide, it is possible to quantify the proportion of cells in the G1, S, and G2/M phases (Fig. 13-2).
Flow cytometry is also a useful technique for documenting programmed cell death (see later).
Flow cytometry can also be used to quantify BrdU incorporation (see earlier).
Table 13-1 Phases of the Cell Cycle | ||||||||||||||||||||||||
|---|---|---|---|---|---|---|---|---|---|---|---|---|---|---|---|---|---|---|---|---|---|---|---|---|
|
Cell Death
Apoptosis Versus Necrosis
Two forms of cell death are recognized in vitro and in vivo: apoptosis, or programmed cell death, and necrosis. While the net effect of each mechanism is death of the cell, the fundamental morphological and molecular features of apoptosis and necrosis are vastly different.
Apoptosis
Death from the inside out
Definition
Organized cascade of intracellular processes
Ultimately leads to digestion of the cellular DNA and fragmentation of the cell into apoptotic bodies
Importance
Critical role in the regulation of tissue structure and function
Important during growth and differentiation
Stimuli that promote or inhibit apoptosis have the capacity to deregulate normal growth and differentiation, leading to an increased risk of neoplasia.
Necrosis
Cell dies from the outside in.
Definition
Most often the result of direct injury to the plasma membrane
Once the membrane is damaged, the stability of the cell’s internal milieu is lost and cellular components may be released directly into the extracellular space.
Inflammatory Component
Release of cytosolic and organellar components into surrounding tissues has an important secondary effect.
Typically induces a local inflammatory response in vivo
This effect is not seen in vitro, since a cell culture environment cannot replicate the innate immune response that is seen in vivo.
Morphologic Features of Apoptosis
Nuclear condensation, blebbing, and fragmentation
Recognized best by labeling nuclei with fluorescent dyes (e.g., Hoechst 33258; Fig. 13-3)
Depending on the type of tissue, apoptotic cells may be removed by phagocytes.
Inflammatory changes are not a feature of apoptosis.
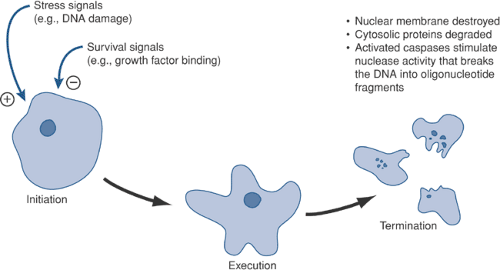
Key Steps in Apoptosis (Fig. 13-4)
Initiation
Although the plasma membrane remains intact during
the early stages of apoptosis, there is redistribution of a glycolipid, phosphatidyl serine (PS), from the inner layer to the outer layer. As a result, PS becomes “visible” on the outside of the cell.

Figure 13-3 Morphological signs of apotosis. Radiation causes a dose-dependent increase in the incidence of cells with nuclear blebbing (arrows). Hoechst stain, 100 × original magnification.
Execution/activation
As a result of changes in mitochondrial membrane permeability, cytochrome c migrates from the inside of the mitochondria into the cytosol.
Caspase activation then ensues, leading to further changes in the permeability of intracellular organelles such as the mitochondria.
Termination
The nuclear membrane is destroyed.
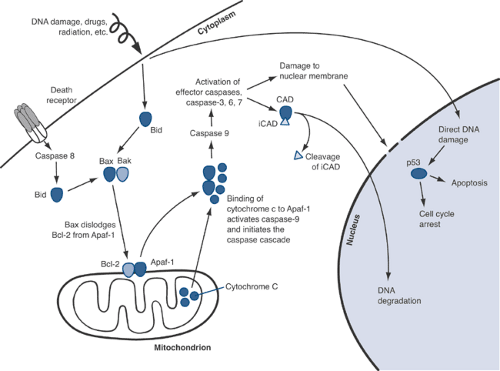
DNA damage is mediated via caspase-activated DNase (CAD).
CAD activity is usually controlled by an inhibitor, iCAD, but this is cleaved via the effector caspases (Fig. 13-5).
Cytosolic proteins are cleaved and organelles break up.
Molecular Pathways of Apoptosis
Apoptogenic Signals (Stimulators of Apoptosis Caspase Activity)
DNA damage from irradiation (UV or x-ray) or chemotherapy
DNA damage activates p53 pathways, leading to the transcription of p21.
p21 blocks the ability of cyclin D/Cdk to phosphorylate the retinoblastoma (Rb) gene product; this blocks the movement of cells through the G1/S transition.
p53 activation also stimulates apoptosis via a direct effect on Bax (see later).
Loss of key trophic factors (e.g. serum withdrawal in cultured cells)
Growth factors are critical “survival signals” for cells; their loss will tip the balance towards programmed cell death.
Fas ligand
Signals via the Fas (or Apo2) receptor (CD 95)
Receptor activation enables FADD (Fas-associated death domain) binding, which in turn activates cas-pase-8.
Tumor necrosis factor-α
Signals via TNF receptor-1 (TNFR1)
Binding can have both pro- and anti-apoptotic effects:
Pro-apoptotic effects are mediated via FADD binding to the death domain on the activated receptor (see above).
Alternatively, the death domain can bind a protein known as RIP (receptor interacting protein); in this case, binding leads to activation of the nuclear factor kappa B (NF-κB) or the Jun kinase pathway, both of which inhibit apoptosis.
“Cellular stress,” including free radicals
Caspases
Cysteine-dependent aspartate-specific proteases, or CASPases, are the central component of the normal cell’s machinery for programmed cell death.
Not all of the caspase family members are involved in apoptosis; caspase 1, for example, is a key regulator of IL-1 activity. However, caspases 3, 6, 7, 8, and 9 are
situated at pivotal control points in apoptotic signaling pathways.
Based on their structure and function, caspases can be considered either activators or effectors:
Activators such as caspases 8 and 9 amplify the initial signal and activate downstream effector caspases.
Effectors such as caspases 3, 6 and 7 mediate direct effects on cellular processes and structures.
Bcl-2 Family Members
Intracellular control of apoptosis is determined by the balance between pro- and anti-apoptotic signaling molecules in the Bcl-2 family.
Anti-apoptotic molecules include Bcl-2 and Bcl-XL.
Stay updated, free articles. Join our Telegram channel

Full access? Get Clinical Tree


