GENETIC CHANGES IDENTIFIED IN Ta BLADDER TUMORS
CDKN2A (9p21) encodes the two cell-cycle regulators, p16 and p14ARF, which share coding region in exons 2 and 3 but have distinct exons 1. The protein products are translated in different reading frames to generate two entirely different proteins. p16 is a negative regulator of the Rb pathway and p14ARF, a negative regulator of the p53 pathway (Fig. 21.1). Inactivation of this locus in UC is commonly by homozygous deletion (HD). There are conflicting reports on association of 9p21 deletion with clinical parameters but HD appears to be associated with high tumor grade and stage.34 Reduced copy number of 9p21 is present in approximately 45% of UC, indicating that, as suggested by knockout mice and in vitro experiments.35,36 p16 and/or p14ARF may be haploinsufficient.34
On 9q, three genes are implicated. PTCH, the Gorlin syndrome gene (9q22) shows infrequent mutation,26 but many tumors have reduced mRNA expression.25 DBC1 (9q33) shows HD in a few tumors29,37 and no mutations, but is commonly silenced by hypermethylation.27,38 LOH of 9q34 and mutation of the retained copy of TSC1 is found in approximately 13% of UC.39 The protein acts in complex with the TSC2 protein to negatively regulate mTOR, a central molecule in the control of protein synthesis and cell growth (Fig. 21.2).
FGFR3
Since the initial identification of FGFR3 mutations in UC,40 11 different mutations have been identified.41–54 These are in hot-spot codons in exons 7, 10, and 15 (Fig. 21.3A) and are all predicted to constitutively activate the receptor.55 Mutation is associated with low tumor grade and stage, with up to 80% of low-grade Ta tumors showing mutation.42 Mutations are also found in urothelial papilloma, a likely precursor of superficial UC.50 Mutation is not associated with tumor recurrence or progression in Ta tumors overall,43,54,56 but there is evidence that mutant Ta grade 1 tumors show a higher risk of recurrence.43 Tumors with FGFR3 mutation show increased FGFR3 protein expression, as do a significant number of tumors without mutation.57
Mutant FGFR3 proteins are oncogenic in rodent mesenchymal cells.58,59 In cultured normal urothelial cells, mutant FGFR3 activates the RAS-MAPK pathway, induces increased cell survival and stimulates continued proliferation to high cell density at confluence.59 This in vitro phenotype suggests that FGFR3 mutation could contribute to clonal expansion or the development of hyperplasia within the urothelium in vivo. RAS gene and FGFR3 mutations are mutually exclusive events. Mutation of either a RAS gene or FGFR3 was found in 82% of low-grade tumors, indicating that virtually all superficial UCs may share activation of the RAS-MAPK pathway.60 Mutations of FGFR3 and TP53 are also somewhat mutually exclusive.41,61 However, as TP53 mutation is found predominantly in high-grade/stage UCs, which are thought to represent a distinct pathogenic pathway (see following discussion), it is predicted that these events are not biologically equivalent.
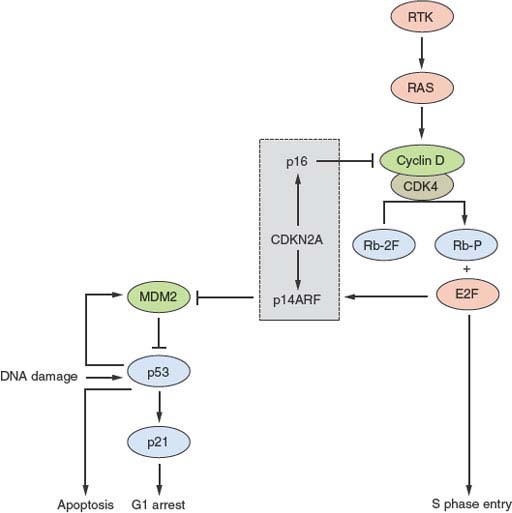
FIGURE 21.1 Key interactions in the Rb and p53 pathways. The CDKN2A locus encodes p16 and p14ARF that act as negative regulators of the Rb and p53 pathways, respectively. This interrelated signaling network is central to tumor suppression via the mechanisms of cell-cycle arrest and apoptosis. Stimulation by mitogens induces cyclin D1 expression. Phosphorylation of Rb by CDK4-cyclin D1 complexes releases E2F family members to induce expression of genes required for progression into S phase. The cyclin D-CDK4 complexes also sequester p27 and p21 (not shown). This allows formation of cyclin E-CDK2, which reinforces the inactivation of Rb. p16 negatively regulates this process by interacting with CDK4. The p53 pathway responds to stress signals (e.g., DNA damage). p21 expression is induced and this leads to cell-cycle arrest. MDM2 is a ubiquitin ligase responsible for inactivation of p53. In turn p53 regulates MDM2 expression providing a negative feedback loop. The p53 and Rb pathways are connected by p14ARF, which sequesters (inactivates) MDM2 in the nucleus and is up-regulated by E2Fs and in response to mitogenic signaling. Overexpression of E2Fs and oncogenes such as MYC can both result in p53-triggered cell-cycle arrest via p14ARF.
FGFR3 is considered a good therapeutic target in superficial UC.62 Several studies indicate that inhibition of mutant FGFR3 by knockdown or inhibition using small molecules or antibodies has a profound effect of UC cell phenotype including inhibition of xenograft growth in vivo.58,63–68

FIGURE 21.2 Oncogenic signaling via the RAS-MAPK and PI3K pathways. Growth factor-mediated signaling or mutational activation of Ras oncogenes can activate both of these pathways. Signaling via the RAS/RAF/MEK/ERK cascade leads to phosphorylation of many substrates that can have multiple cellular effects depending on the intensity and duration of signaling. In many situations proliferation is induced. Activated receptor tyrosine kinases bind p85, the regulatory subunit of PI3K, and recruit the enzyme to the membrane where it phosphorylates phosphatidyinositol-4, 5-bisphosphate (PIP2) to generate PIP3, which in turn recruits PDK1 and AKT to the membrane where AKT is activated by phosphorylation to regulate a wide range of target proteins (not all shown). Among these are cyclin D1 and MDM2, which are up-regulated either directly or indirectly, resulting in a positive stimulus via the Rb or p53 pathways, respectively. AKT also phosphorylates and inactivates tuberin the TSC2 gene product, leading to activation of mTOR complex 1 (TORC1), which controls protein synthesis. The TSC1 product hamartin forms an active complex with tuberin, and loss of function of either protein leads to dysregulated mTOR signaling. MYC expression is induced as a consequence of both by ERK and AKT signaling.

FIGURE 21.3 A: FGFR3 mutations identified in bladder cancer. Positions of hot-spot mutations in exons 7, 10, and 15 that are found in bladder cancer are shown in relation to protein structure. The relative frequency of the more common mutations is given as a percentage. IgI, IgII, IgIII, immunoglobulinlike domains; TM, transmembrane domain; TK, tyrosine kinase domain. B: PIK3CA mutations identified in bladder cancer in relation to protein structure.
PIK3CA
PI3K plays a pivotal role in signaling from receptor tyrosine kinases (Fig. 21.2). Activating mutations of the p110α catalytic subunit (PIK3CA) are found in UC. One study identified mutations in 13%, with a significant association with low tumor grade and stage69 and a second reported a frequency of 27%.39 The development of a low-cost, high-throughput assay to detect the common variants should facilitate studies to clarify the exact frequency and clinical associations of these mutations.70 The PIK3CA mutation spectrum (Fig. 21.3B) differs significantly from that in other cancers. Mutations E542K and E545K in the helical domain are most common (24% and 52%, respectively) and the kinase domain mutation H1047R, which is the most common mutation in other cancers, is less frequent (13% compared with 46% reported for other cancers in COSMIC, Catalogue of Somatic Mutations in Cancer [www.sanger.ac.uk/genetics/CGP/cosmic/]). The selective pressure for helical domain mutation in UC is not yet understood, although recent studies of the structure of p110α and the effect of the common activating mutations reveal different mechanisms of activation by helical domain and kinase domain mutations.71
Cyclin D1
CCND1 (11q13) is amplified in some superficial and invasive UCs72 and the protein is overexpressed in an even larger number.73–76 Overexpression in many cases may be the consequence of other alterations, such as activation of the MAPK or PI3K pathways (Fig. 21.2). There is no consensus on the clinical significance of overexpression, but up-regulation is more common in Ta tumors.75,76
MicroRNA Expression
There are several reports of altered miRNA expression in UC. Changes in apparently “normal” urothelium from UC patients indicate that such alterations may occur early in disease development.77 Comparison of superficial and advanced UC indicates significant differences in profile.77 Predominantly down-regulation of miRNAs was found in Ta tumors compared with normal urothelium. Interestingly, two of the down-regulated miRNAs, miR-99a and miR-100, were found to regulate FGFR3.77 Low levels of miR-7 have also been reported to be associated with FGFR3 mutation.78
CARCINOMA IN SITU
CIS is the predicted precursor of muscle-invasive UC.79 It is usually recognized only retrospectively in paraffin-embedded samples, and few studies have assessed genetic changes. Alterations include TP53 mutation, chromosome 9 loss, up-regulated ERBB2 expression, and a range of alterations similar to those found in muscle-invasive UC.80–83 Array-based studies have revealed significant genomic instability. Gains of 5p, 6p22.3, 10p15.1, and losses of 5q and 13q13-q14 were common. The genomic profile was similar to that of high-risk Ta and T1 tumors with associated CIS and lacking FGFR3 mutation.84 FGFR3 mutation has not been found in CIS. One study reported that chromosome 9 loss was infrequent in primary CIS but common in CIS associated with synchronous carcinoma,84 indicating two forms of CIS with different developmental pathways.
MOLECULAR ALTERATIONS IN INVASIVE UROTHELIAL CARCINOMA
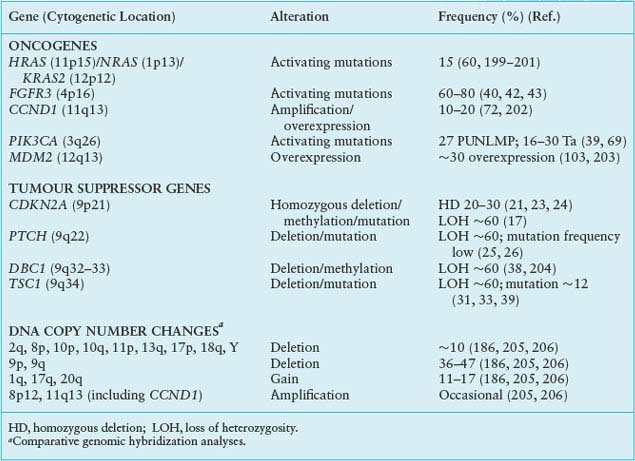
Many genetic alterations are found in muscle-invasive UC, including alterations to known genes and genomic alterations for which the target genes are currently unknown (Table 21.2).
Oncogenes
ERBB2 (17q23), a receptor tyrosine kinase of the EGFR gene family, is amplified in 10% to 20% and overexpressed in 10% to 50% of invasive UC.85–89 The prognostic significance of these alterations is controversial.90–94 As this receptor cannot bind ligand and relies on heterodimerization with ERBB3, it is likely that ERBB3 status and/or ligand expression may have significant influence.95,96 Up to 70% of invasive tumors overexpress EGFR, and this is associated with poor prognosis.97,98 Both ERBB2 and EGFR represent potential therapeutic targets in advanced UC.99 These changes may activate the RAS-MAPK and/or the PI3K pathways (Fig. 21.2).
RAS gene mutation is not associated with either invasive or superficial disease.60 In vitro experiments in tumor cells indicate that HRAS can induce an invasive phenotype.100 In mice expressing mutant H-ras in the urothelium, superficial papillary tumors develop rather than muscle-invasive tumors.101 Thus, RAS mutation may contribute to development of both forms of UC. FGFR3 is mutated less frequently than in superficial UC. Approximately 15% of T2 tumors show mutation.42,57,61 However, protein expression is up-regulated in 40% to 50% of nonmutant-invasive UC.57,67 FGFR1 is also overexpressed in many of these cancers,102 indicating that FGFR-targeted therapies may be applicable to both noninvasive and invasive UC.
Some UCs (4% to 6%) show amplification of MDM2 (12q14).103,104 MDM2 regulates p53 levels, and overexpression provides an alternative mechanism to inactivate p53 function (Fig. 21.1). There is no consensus on the relationship of up-regulated MDM2 to tumor grade, stage, or prognosis. MYC is up-regulated in many bladder tumors, although the mechanism for this is unclear.105 Although amplifications of 8q are found in some invasive UC, MYC is not the major target. However, additional copies of the whole of 8q are common and may lead to overexpression.106,107 MYC may also be up-regulated in response to other molecular events (e.g., MAPK pathway stimulation). An amplicon on 6p in 14% of muscle-invasive UC and cell lines108–110 contains E2F3, and functional studies indicate that E3F3 can drive urothelial cell proliferation (Fig. 21.1).111,112 E2F transcription factors interact with and are regulated by Rb and tumors with E2F3 amplification have Rb inactivated.
TABLE 21.2
GENETIC CHANGES FOUND IN INVASIVE (<T2) BLADDER TUMORS

Tumor Suppressor Genes
As in other aggressive cancers, the tumor suppressor genes TP53, RB1, CDKN2A, and PTEN are implicated in invasive UC. The pathways controlled by p53 and Rb regulate cell-cycle progression and responses to stress (Fig. 21.1). TP53 mutation is common in invasive UC (mutations are listed in the International Agency for Research on Cancer TP53 database).113 Although immunohistochemical detection of p53 protein with increased half-life identifies many mutant p53 proteins and is commonly used as a surrogate marker for mutation, many TP53 mutations (∼20%) yield unstable or truncated proteins that cannot be detected in this way. Thus, p53 protein accumulation is not a useful prognostic marker. Two meta-analyses indicate only a small association between p53 positivity and poor prognosis.114,115 A recent study that examined both protein expression and mutation of TP53 confirmed limited concordance of these measurements but found that the combined measurements provided useful prognostic information.116
The Rb pathway regulates cell-cycle progression from G1 to S phase (Fig. 21.1). RB1 has not been screened for mutations in UC but homozygous deletions, LOH of 13q14, and loss of Rb protein expression are detected in tumors of high grade and stage.117–120 Altered Rb protein expression including both loss of expression, and the up-regulation which is associated with loss of p16 expression,121 has been found in about 54% of cystectomy tumor samples.122 CDKN2A (encoding p16 and p14ARF) is hemizygously deleted in more than 50% of UCs of all grades and stages, and homozygous deletion is associated with invasion.34 These proteins link the Rb and p53 pathways (Fig. 21.1), and due to multiple regulatory feedback mechanisms, inactivation of both pathways together is predicted to have greater impact than inactivation of either pathway alone.123 Assessment of Rb, p53, and p21 bear this out.124 More recent studies indicate that broad analysis of changes that deregulate the G1 checkpoint achieves greater predictive power.122,125–127 It is also reported that alterations of p53 and loss of p16 expression predict progression in Ta tumors.128
PTEN (phosphatase and tensin homologue deleted on chromosome 10) (10q23), a negative regulator of the PI3K pathway by virtue of its lipid phosphatase activity toward PtIns(3,4,5)P3 (Fig. 21.2), is deleted in 24% to 58% of invasive UCs.129–131 Mutations of the retained copy are infrequent but HD has been detected in tumor cell lines.39,132–134 Reduced expression is common39,135 and is associated with p53 alteration. Many tumors (41%) with altered p53 show down-regulation of PTEN, and this combined alteration is associated with poor outcome.136 As PTEN is haploinsufficient in mouse models,137 loss of function of one allele in UC may lead to altered phenotype. In mice, conditional deletion of Pten in the urothelium led to early urothelial hyperplasia135,138 and late development of tumors resembling human papillary superficial tumors. A study that induced stochastic deletion of p53 and/or Pten in mice showed that deletion of either gene alone did not lead to tumor formation but dual deletion led to early development of aggressive UC, with frequent metastases.136 PTEN loss may affect proliferation, apoptosis, and migration. Re-expression in PTEN-null UC cells has revealed effects on cell chemotaxis, anchorage independent growth, and tumor growth in vivo.139–141 UC cell invasion can be inhibited by the protein phosphatase activity of PTEN alone.141 Thus, loss of both lipid and protein phosphatase activities of PTEN may contribute in different ways to urothelial tumorigenesis. The TSC1 product hamartin acts in the PI3K pathway downstream of PTEN (Fig. 21.2), providing an alternative mechanism of pathway activation in 13% of invasive UC.31,39
The Rho family GDP dissociation inhibitor RhoGDI2 has been implicated as a tumor suppressor in UC. Expression is reduced in an isogenic cell line model of metastasis142 and low expression is associated with reduced survival in UC patients.143 Phosphorylation by SRC appears to enhance the suppressive action of RhoGDI2 and down-regulation of SRC and RHOGDI2 are mutually exclusive in UC,144 suggesting that SRC may play an important role in some cases.145
Other Genomic Changes in Invasive Urothelial Carcinoma
Large numbers of genomic changes have been detected in invasive UC. These include numerous losses and gains in DNA copy number and several regions of high-level amplification that may contain novel oncogenes (Table 21.2). To date the target genes within most of these regions have not been identified.
Invasive UC displays genetic instability with rapid genetic divergence of related tumors from the same patient. This is commonly chromosomal instability rather than microsatellite instability. No significant differences have yet been found between minimally invasive (T1) and deeply invasive tumors (T2 or greater), suggesting that T1 tumors with the ability to break through the basement membrane are aggressive lesions. Although T1 tumors often have good outcome, this may reflect complete resection rather than lack of tumor aggression. Some alterations, including gains of 3p22–25 and 5p and losses of 4p11–15, 5q15–23, 6q22–23, and 10q24–26, are associated with T1 tumor progression.146 In one comparative genomic hybridization (CGH) study, muscle-invasive tumor samples and paired metastatic samples were compared, but no significant metastasis-associated markers were identified.147
MicroRNA Expression
Many miRNAs show altered expression in invasive UC.78 In comparison with normal urothelium, invasive tumors are reported to show predominantly up-regulation of miRNAs rather than down-regulation.77 Two studies have directly compared invasive and noninvasive samples77 and several have shown association of specific changes with either poor outcome or the invasive phenotype.78,148,149 Functional studies indicate potential roles for miR-145 and miR-221 in regulating urothelial cell survival,150,151 miR-200 in regulating epithelial-mesenchymal transition,152 miR-145 and miR-133a in regulating the cytoskeletal gene FSCN1,153 and miR-101 in modulation of expression of the Polycomb Repressive Complex 2 gene EZH1.154
INFORMATION FROM EXPRESSION AND GENOMIC MICROARRAY PROFILING
Microarray analysis provides extensive information that is contributing to improved tumor classification and understanding of UC pathogenesis.155 Molecular signatures for the known histopathologic subtypes (grade and stage), for CIS, the presence of metastases, and treatment response have been reported and some have been validated or are being validated in multicenter studies with the aim of introduction into clinical practice. Several reports have generated expression signatures for diagnostic classification.156–161 Profiles of superficial tumors showed that the presence of FGFR3 mutation has a major impact on expression profile.162 One study163 examined differences between normal urothelium, PUNLMP or low-grade Ta and high-grade Ta tumors.164 Cytoskeletal genes differed most between normal urothelium and low-grade tumors, and changes in high-grade tumors were related to the cell cycle.
Signatures for prediction of recurrence in Ta grade 2 tumors and the presence of CIS in patients with Ta tumors have been generated.165–168 Interestingly “normal” mucosa from cystectomy specimens with adjacent CIS contained the CIS signature, indicating that in such bladders there may be widespread urothelial alteration.167 This CIS signature has been validated in a large multicenter study.165 In another study a “no CIS” classification was correlated with FGFR3 mutation.54 Progression of superficial tumors has been predicted with relatively high sensitivity and specificity159,169 and one of the signatures169 validated in a multicenter study.165 A recent study using large training and validation sets identified signatures for recurrence and progression in superficial and muscle-invasive tumors.170 Real-time polymerase chain reaction confirmed an eight-gene predictor of progression in noninvasive disease. The other signatures were not confirmed, emphasizing the need for validation using an independent technique in a large sample set. The application of two forms of artificial intelligence to expression data from the study of Wild et al.159 has also resulted in the identification of 11 genes associated with progression of noninvasive UC.171 A panel of antibodies to six of these genes was predictive of outcome.
Muscle-invasive UC with known outcome have not been studied in large numbers, but in one study, tumors with good (survival <18 months) or bad (survival <18 months) prognosis were classified with 78% success.158 Two other studies showed less ability to identify poor survival,161,172 but one protein identified (synuclein) showed significant association with outcome.172 Signatures for the presence of lymph node metastases have been presented161,172 but robust predictors have not emerged.
Profiles of muscle-invasive UC reveal enrichment for markers of an epithelial-mesenchymal transition,173 indicating that this may be an important feature of CIS->invasive UC progression. Immunohistochemistry results support this.174,175 UC cell lines with epithelial-mesenchymal transition show resistance to EGFR inhibitors.176,177 Tumor molecular profile may have profound effects not only on response to targeted therapies but to radiotherapy and conventional chemotherapy. Two studies have examined response to neoadjuvant M-VAC (methotrexate, vinblastine, doxorubicin, and cisplatin) chemotherapy. Profiles from responders and nonresponders were used to generate a gene signature that correctly predicted response in eight of nine test cases.178 In a second study, expression profiles from 30 patients yielded 55 genes that correlated with postchemotherapy survival, 2 of which (emmprin and survivin) were validated by immunohistochemistry and had significant correlation with therapeutic response and overall outcome in patients with no metastases.179 Prediction models for response to both chemotherapy and targeted agents have also been developed using profiles of UC cell lines.180,181 The same group developed a bioinformatics approach to predict drug sensitivity (COXEN), using expression profiles and known response of the NCI-60 panel of cell lines to predict response of cell lines based on expression profile. This predicted sensitivity of UC cell lines to several agents that was confirmed by in vitro testing182 and has been shown to predict patients’ response to chemotherapy.183
Genomic profiling has used array-based CGH (aCGH) and single nucleotide polymorphism (SNP) array analysis. aCGH provides high-resolution copy number profiles and has precisely defined regions of high-level amplification.109,184–187 Used in concert with expression analysis, candidate “drivers” of these amplicons have been identified.187 SNP array analysis has allowed novel chromosomal regions of allelic imbalance to be identified.83,188 More regions of both copy number alteration and allelic imbalance have been found with increasing tumor stage. Despite a large body of data, no robust genetic markers to predict Ta tumor recurrence or progression of high-risk Ta tumors have been identified to date.
SIGNALING PATHWAYS IN UROTHELIAL CARCINOMA
There is overwhelming evidence for activation of the RAS-MAPK and PI3K pathways. In superficial UC, FGFR3 and RAS mutation in almost all cases suggests dependence on RAS-MAPK pathway activation. As FGFR3 activation does not activate the PI3K pathway in cultured normal urothelial cells,59 the presence of PIK3CA mutations in superficial UC, including those with FGFR3 mutation, implies that additional activation of the PI3K pathway is required. RAS mutation may activate both pathways. Inactivation of TSC1 and activating mutations of AKT1 in superficial and invasive UC, and PTEN inactivation in invasive UC, may also activate the PI3K pathway. Upstream activators of the pathway, including ERBB receptors, may also contribute. It is noteworthy that alterations in three of the key genes in the pathway (PIK3CA, TSC1, and PTEN) are not mutually exclusive,39 implying that combined mutations have additive or synergistic effects and that noncanonical effects may be critical. This may be particularly important for TSC1. The widely studied functions of TSC1 and TSC2 are attributed to the TSC1/TSC2 complex that regulates mTOR activity. Although independent functions have been ascribed to TSC2, independent function of TSC1 is not clear. The finding of TSC1 mutations in bladder but not other cancers and the lack of mutual exclusivity with PIK3CA and PTEN alterations may indicate an independent TSC1 function in the urothelium. The known cross-talk between the MAPK and PI3K pathways via RAS and ERK (Fig. 21.2) could place the PI3K pathway at center stage and indicate utility of inhibitors of this pathway in treatment of both groups of UC. As targeted agents for inhibition of these pathways are now available or in development, it will be important to confirm these predictions by direct measurement of pathway activation in tumor samples.
UROTHELIAL TUMOR-INITIATING CELLS
There is evidence for the existence within heterogeneous urothelial tumor cell populations of a highly tumorigenic subpopulation with stem cell–like characteristics. As cancer stem cells in other tumor types show resistance to chemotherapy agents and are predicted to be the cause of posttreatment disease relapse, there is great interest in characterizing these stem cells and identifying markers that may allow specific targeting. Two recent studies provide clear evidence for such a population within urothelial cancers.189,190 He et al.190 identified a population of tumor cells with urothelial basal cell-like characteristics that reside at the tumor-stromal interface in tumors and xenografts and possess most of the tumor-forming ability of the parental tumor. A second study identified a CD44+ population of cells in primary tumors that expressed the basal cell marker CK5 and was enriched for tumor-initiating cells.189 Expression profiling in both studies provides the basis for future attempts to identify tumor-initiating cells and examine relationships to therapeutic response and outcome.191
MOLECULAR PATHOGENESIS AND TUMOR CLONALITY
UC are commonly multifocal and show frequent recurrence. In many cases, the macroscopically “normal” urothelium shows areas of microscopic dysplasia or CIS, and it is easy to envisage how new lesions may develop following resection of a primary tumor. The issue of clonality of UC has received much attention, and most studies have found only monoclonal tumors with shared genetic changes in multiple tumors resected from the same patient. However, there are some examples of more than one unrelated monoclonal tumor in the same bladder (oligoclonality) (reviewed in ref 192).
Macroscopically normal urothelium from tumor-bearing bladders has shown LOH in several genomic regions. Detailed mapping identified candidate genes whose involvement is predicted to be at a very early stage in tumor development. These have been termed “forerunner” genes and functional studies suggest that some regulate key cellular functions.193,194
Based on molecular and histopathological observations, a model for the molecular pathogenesis of UC has been developed (Fig. 21.4). FGFR3 and TP53 mutation are predominantly confined to one of the two major subgroups of UC and currently are the best molecular markers for these groups. It is not yet clear how often T1 tumors develop directly from flat dysplasia or from papillary Ta tumors. Similarly, the pathogenesis of high-grade papillary tumors and their relationship to flat dysplastic lesions is not well understood and is therefore represented as a potential third pathway in Figure 21.4.. Further work is required to examine T1 tumors in more detail, to determine whether these are invasive tumors caught in their journey toward muscle, whether any develop from papillary Ta tumors or whether they represent a third distinct group. More detailed examination of differences between primary and UC-associated dysplasia/CIS may confirm the existence of a third pathway to urothelial neoplasia. To date, no molecular alterations can differentiate muscle invasive UC from their metastases. This may reflect early migration of cells to distant sites without requirement for additional changes, or that determinants of progression and metastasis are yet to be identified. Additional alterations may also remain to be identified in Ta tumors that show only one or two molecular events.

FIGURE 21.4 Potential pathways of urothelial tumorigenesis. Low-grade papillary tumors (left) may arise via simple hyperplasia and minimal dysplasia and are characterized at the molecular level by deletions of chromosome 9 and activating mutations of FGFR3 and PIK3CA. Invasive carcinoma (right) is believed to arise via the flat high-grade lesion carcinoma in situ (CIS), and in this case TP53 mutation occurs early, chromosome 9 deletions (9q) are less common, and FGFR3 mutations are infrequent. These genetically unstable tumors accumulate genomic alterations, including RB1 inactivation, 8p deletions, and many other genetic events. The finding of dysplasia in association with high-grade papillary tumors that lack TP53 mutation but have frequent chromosome 9 losses suggests that an independent route to high-grade papillary tumors may exist (center).
Attempts have been made to apply bioinformatic modeling to define possible genetic pathways of UC development. Two potential cytogenetic pathways, one initiated by −9, followed by −11p and 1q+ and a second initiated by +7 followed by 8p− and +8q were identified, the latter group containing more aggressive tumors (T1–T3) and the former, Ta–T2 tumors.195 A Bayesian network model using LOH data for 17 chromosomes in papillary UC (all grades) showed 9p and 9q loss as the most probable primary event with 8p− and 17− as major subsequent events196 and a subsequent analysis based on cytogenetic data confirmed several of these associations and predicted two distinct pathways that ultimately converge, one initiated by +7 and the other by −9.197
Undoubtedly, application of array-based genomic and expression approaches in combination with high throughput mutation scanning will answer some of the outstanding questions relating to pathogenesis. Key to this will be appropriate selection of tissues for study, and there will be great advantages if archival samples from clinical trials can be used. It will be essential to test the effects of key molecular alterations on human urothelial cell phenotype. The recent development of immortal normal human urothelial cell lines will facilitate this.198
Selected References
The full list of references for this chapter appears in the online version.
1. Knowles MA. Molecular subtypes of bladder cancer: Jekyll and Hyde or chalk and cheese? Carcinogenesis 2006;27(3):361–373.
4. Cordon-Cardo C. Molecular alterations associated with bladder cancer initiation and progression. Scand J Urol Nephrol Suppl 2008:154–165.
7. Kiemeney LA, Grotenhuis AJ, Vermeulen SH, et al. Genome-wide association studies in bladder cancer: first results and potential relevance. Curr Opin Urol 2009; 19:540–546.
9. Wu X, Hildebrandt MAT, Chang DW. Genome-wide association studies of bladder cancer risk: a field synopsis of progress and potential applications. Cancer Metastasis Rev 2009;28:269–280.
10. Cairns P. Gene methylation and early detection of genitourinary cancer: the road ahead. Nat Rev Cancer 2007;7:531–543.
14. Takahashi T, Habuchi T, Kakehi Y, et al. Clonal and chronological genetic analysis of multifocal cancers of the bladder and upper urinary tract. Cancer Res 1998;58:5835–5841.
30. Pymar LS, Platt FM, Askham JM, et al. Bladder tumour-derived somatic TSC1 missense mutations cause loss of function via distinct mechanisms. Hum Mol Genet 2008;17:2006–2017.
34. Chapman EJ, Harnden P, Chambers P, et al. Comprehensive analysis of CDKN2A status in microdissected urothelial cell carcinoma reveals potential haploinsufficiency, a high frequency of homozygous co-deletion and associations with clinical phenotype. Clin Cancer Res 2005;11:5740–5747.
39. Platt FM, Hurst CD, Taylor CF, et al. Spectrum of phosphatidylinositol 3-kinase pathway gene alterations in bladder cancer. Clin Cancer Res 2009;15:6008–6017.
40. Cappellen D, De Oliveira C, Ricol D, et al. Frequent activating mutations of FGFR3 in human bladder and cervix carcinomas. Nat Genet 1999;23:18.
42. Billerey C, Chopin D, Aubriot-Lorton MH, et al. Frequent FGFR3 mutations in papillary non-invasive bladder (pTa) tumors. Am J Pathol 2001; 158:1955–1959.
54. Zieger K, Dyrskjot L, Wiuf C, et al. Role of activating fibroblast growth factor receptor 3 mutations in the development of bladder tumors. Clin Cancer Res 2005;11:7709–7719.
57. Tomlinson DC, Baldo O, Harnden P, et al. FGFR3 protein expression and its relationship to mutation status and prognostic variables in bladder cancer. J Pathol 2007;213:91–98.
58. Bernard-Pierrot I, Brams A, Dunois-Larde C, et al. Oncogenic properties of the mutated forms of fibroblast growth factor receptor 3b. Carcinogenesis 2006;27:740–747.
59. di Martino E, L’Hôte CG, Kennedy W, et al. Mutant fibroblast growth factor receptor 3 induces intracellular signaling and cellular transformation in a cell type- and mutation-specific manner. Oncogene 2009;28:4306–4316.
60. Jebar AH, Hurst CD, Tomlinson DC, et al. FGFR3 and Ras gene mutations are mutually exclusive genetic events in urothelial cell carcinoma. Oncogene 2005; 24:5218–5225.
61. van Rhijn BW, van der Kwast TH, Vis AN, et al. FGFR3 and P53 characterize alternative genetic pathways in the pathogenesis of urothelial cell carcinoma. Cancer Res 2004; 64:1911–1914.
63. Tomlinson DC, Hurst CD, Knowles MA. Knockdown by shRNA identifies S249C mutant FGFR3 as a potential therapeutic target in bladder cancer. Oncogene 2007;26:5889–5899.
65. Qing J, Du X, Chen Y, et al. Antibody-based targeting of FGFR3 in bladder carcinoma and t(4;14)-positive multiple myeloma in mice. J Clin Invest 2009;119:1216–1229.
68. Martinez-Torrecuadrada JL, Cheung LH, Lopez-Serra P, et al. Antitumor activity of fibroblast growth factor receptor 3-specific immunotoxins in a xenograft mouse model of bladder carcinoma is mediated by apoptosis. Mol Cancer Ther 2008;7:862–873.
69. Lopez-Knowles E, Hernandez S, Malats N, et al. PIK3CA mutations are an early genetic alteration associated with FGFR3 mutations in superficial papillary bladder tumors. Cancer Res 2006;66:7401–7404.
77. Catto JWF, Miah S, Owen HC, et al. Distinct microRNA alterations characterize high- and low-grade bladder cancer. Cancer Res 2009;69:8472–8481.
78. Veerla S, Lindgren D, Kvist A, et al. MiRNA expression in urothelial carcinomas: important roles of miR-10a, miR-222, miR-125b, miR-7 and miR-452 for tumor stage and metastasis, and frequent homozygous losses of miR-31. Int J Cancer 2009;124:2236–2242.
95. Memon AA, Sorensen BS, Meldgaard P, et al. The relation between survival and expression of HER1 and HER2 depends on the expression of HER3 and HER4: a study in bladder cancer patients. Br J Cancer 2006;94:1703–1709.
96. Amsellem-Ouazana D, Bieche I, Tozlu S, et al. Gene expression profiling of ERBB receptors and ligands in human transitional cell carcinoma of the bladder. J Urol 2006;175:1127–1132.
99. Dovedi SJ, Davies BR. Emerging targeted therapies for bladder cancer: a disease waiting for a drug. Cancer Metastasis Rev 2009;28:355–367.
102. Tomlinson DC, Lamont FR, Shnyder SD, et al. Fibroblast growth factor receptor 1 promotes proliferation and survival via activation of the mitogen-activated protein kinase pathway in bladder cancer. Cancer Res 2009;69:4613–4620.
108. Oeggerli M, Tomovska S, Schraml P, et al. E2F3 amplification and overexpression is associated with invasive tumor growth and rapid tumor cell proliferation in urinary bladder cancer. Oncogene 2004;23:5616–5623.
109. Hurst CD, Fiegler H, Carr P, et al. High-resolution analysis of genomic copy number alterations in bladder cancer by microarray-based comparative genomic hybridization. Oncogene 2004;23:2250–2263.
111. Hurst CD, Tomlinson DC, Williams SV, et al. Inactivation of the Rb pathway and overexpression of both isoforms of E2F3 are obligate events in bladder tumours with 6p22 amplification. Oncogene 2008;27:2716–2727.
112. Olsson AY, Feber A, Edwards S, et al. Role of E2F3 expression in modulating cellular proliferation rate in human bladder and prostate cancer cells. Oncogene 2007;26:1028–1037.
116. George B, Datar RH, Wu L, et al. p53 gene and protein status: the role of p53 alterations in predicting outcome in patients with bladder cancer. J Clin Oncol 2007;25:5352–5358.
123. Mitra AP, Birkhahn M, Cote RJ. p53 and retinoblastoma pathways in bladder cancer. World J Urol 2007;25:563–571.
136. Puzio-Kuter AM, Castillo-Martin M, Kinkade CW, et al. Inactivation of p53 and Pten promotes invasive bladder cancer. Genes Dev 2009;23:675–689.
145. Said N, Theodorescu D. Pathways of metastasis suppression in bladder cancer. Cancer Metastasis Rev 2009; 28:327–333.
148. Dyrskjot L, Ostenfeld MS, Bramsen JB, et al. Genomic profiling of microRNAs in bladder cancer: miR-129 is associated with poor outcome and promotes cell death in vitro. Cancer Res 2009;69:4851–4860.
152. Adam L, Zhong M, Choi W, et al. miR-200 expression regulates epithelial-to-mesenchymal transition in bladder cancer cells and reverses resistance to epidermal growth factor receptor therapy. Clin Cancer Res 2009;15:5060–5072.
155. Orntoft TF, Dyrskjot L. Gene signatures for risk-adapted treatment of bladder cancer. Scand J Urol Nephrol Suppl 2008;(218):166–174.
162. Lindgren D, Liedberg F, Andersson A, et al. Molecular characterization of early-stage bladder carcinomas by expression profiles, FGFR3 mutation status, and loss of 9q. Oncogene 2006;25:2685–2696.
167. Dyrskjot L, Kruhoffer M, Thykjaer T, et al. Gene expression in the urinary bladder: a common carcinoma in situ gene expression signature exists disregarding histopathological classification. Cancer Res 2004;64:4040–4048.
169. Dyrskjot L, Zieger K, Kruhoffer M, et al. A molecular signature in superficial bladder carcinoma predicts clinical outcome. Clin Cancer Res 2005;11:4029–4036.
172. Sanchez-Carbayo M, Socci ND, Lozano J, et al. Defining molecular profiles of poor outcome in patients with invasive bladder cancer using oligonucleotide microarrays. J Clin Oncol 2006;24:778–789.
173. McConkey DJ, Choi W, Marquis L, et al. Role of epithelial-to-mesenchymal transition (EMT) in drug sensitivity and metastasis in bladder cancer. Cancer Metastasis Rev 2009; 28:335–344.
179. Als AB, Dyrskjøt L, von der Maase H, et al. Emmprin and survivin predict response and survival following cisplatin-containing chemotherapy in patients with advanced bladder cancer. Clin Cancer Res 2007;13:4407–4414.
186. Blaveri E, Brewer JL, Roydasgupta R, et al. Bladder cancer stage and outcome by array-based comparative genomic hybridization. Clin Cancer Res 2005;11:7012–7022.
192. Hafner C, Knuechel R, Stoehr R, et al. Clonality of multifocal urothelial carcinomas: 10 years of molecular genetic studies. Int J Cancer 2002;101:1–6.
Related posts:

Stay updated, free articles. Join our Telegram channel

Full access? Get Clinical Tree


