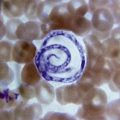
In healthy adults and older children, the majority of circulating lymphocytes in the blood are T cells (approximately 70% of lymphocytes) with fewer B cells (25%) and natural killer (NK) cells (5%). However, at birth this proportion is reversed, with B cells outnumbering T cells by a ratio of 2:1. The normal absolute lymphocyte count and normal relative percentage of lymphocytes also vary with age. In adults the lymphocyte count is typically 1.0–4.0 × 10 9 /L, whereas children often have much higher absolute lymphocyte counts. For example, the normal lymphocyte count for infants younger than 6 months ranges from approximately 2.0–17.0 × 10 9 /L. In healthy adults, lymphocytes typically comprise approximately 35% of all leukocytes, whereas children between the ages of 1 month and 1 year commonly exhibit a much higher relative percentage, with lymphocytes normally comprising approximately 60% of leukocytes.
Lymphocytosis is defined as an absolute lymphocyte count that exceeds the upper limit of the age-appropriate reference range, usually >4.0 × 10 9 /L for adults, and may be due to either reactive or neoplastic conditions. Reliable distinction between reactive and neoplastic etiologies can often be achieved by carefully reviewing a blood smear to evaluate the appearance of the lymphocytes in the context of the clinical findings and other laboratory data. If a neoplastic etiology is suspected, then additional techniques, most commonly flow cytometry (FC), are often used.
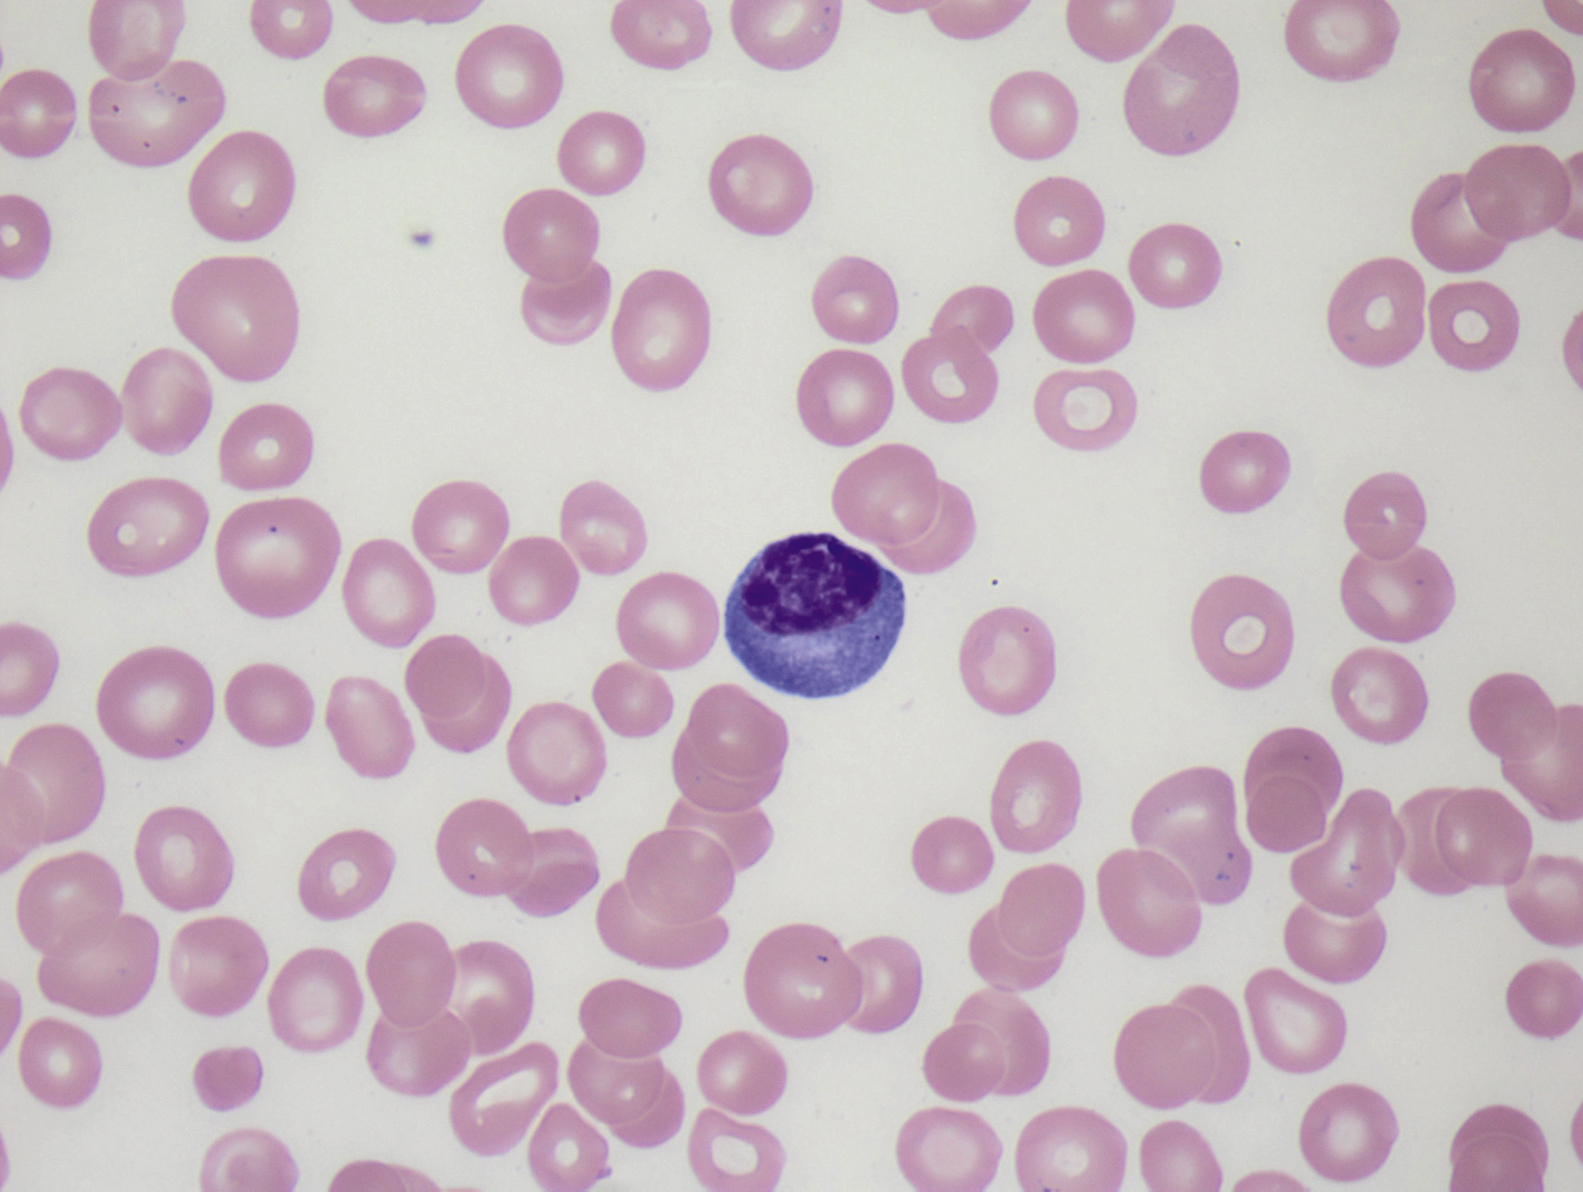
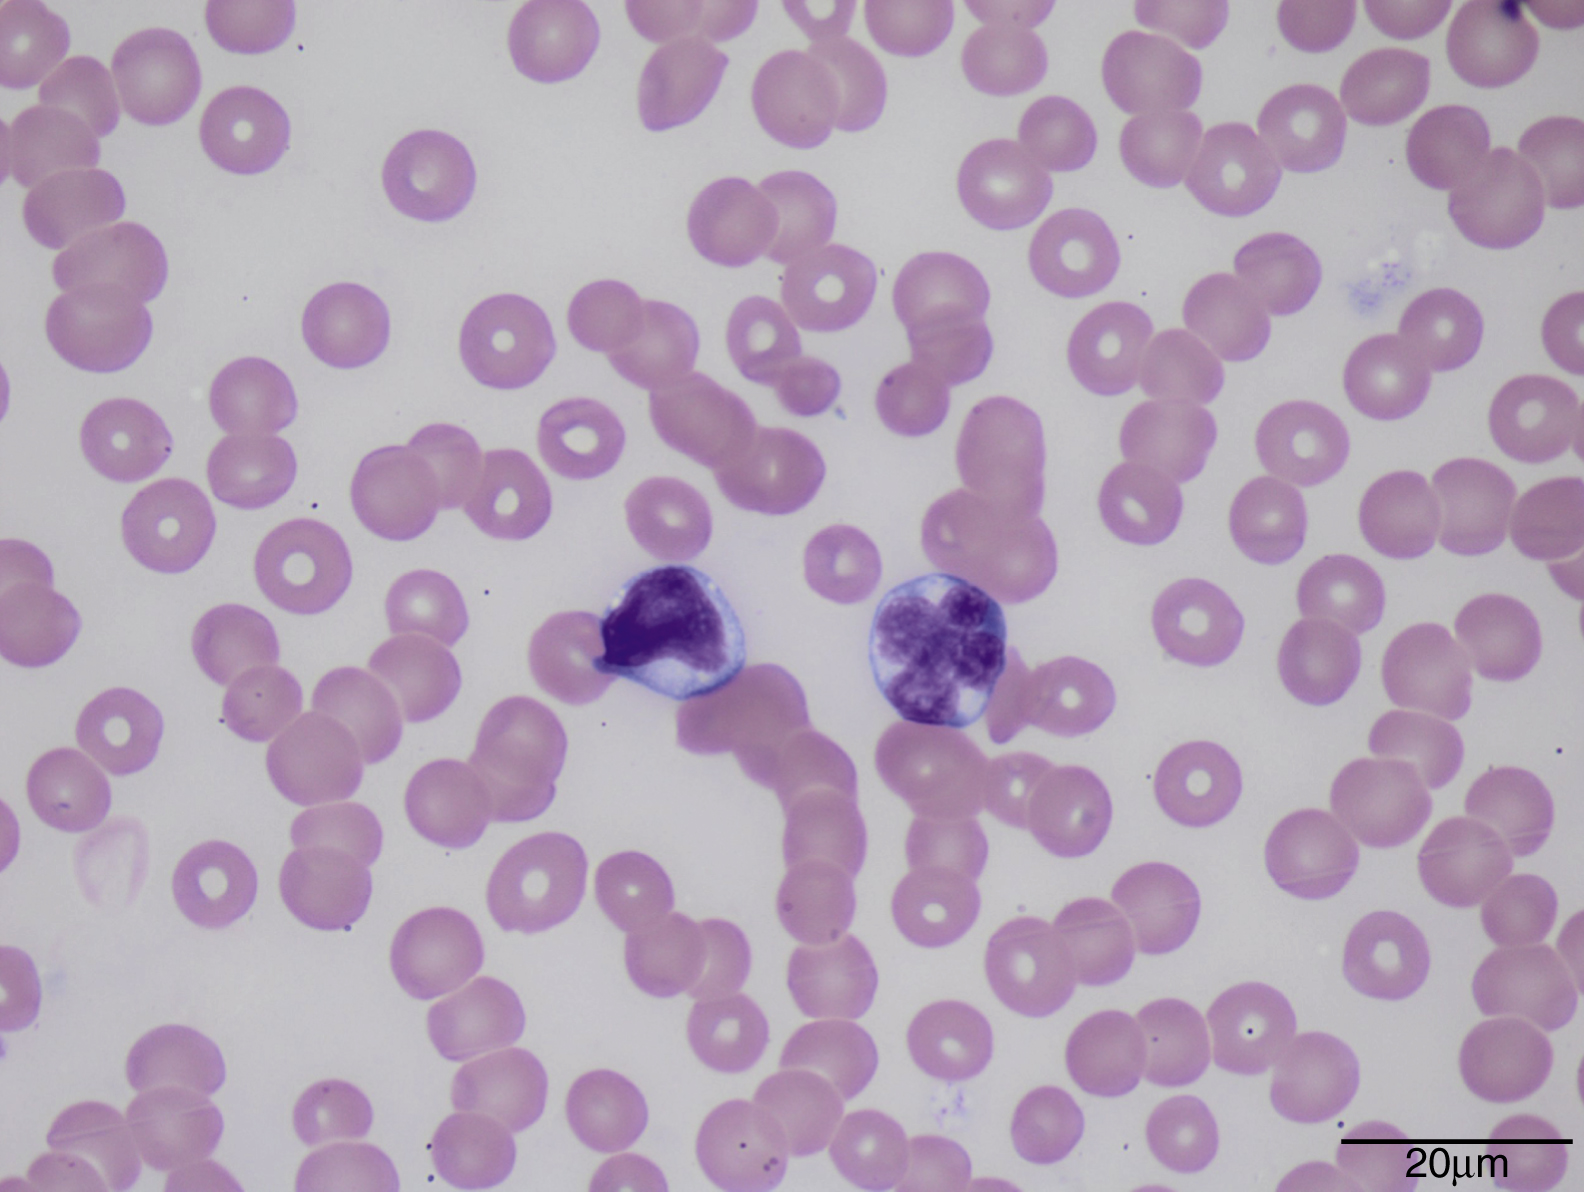
Normal lymphocytes are generally small cells with round nuclei, condensed (mature) chromatin, and scant cytoplasm ( Fig. 10.1 ). In contrast, reactive lymphocytosis (e.g., due to a viral infection) is typically characterized by a wide range of cell morphologies within a given blood smear, with a proportion of the lymphocytes appearing large owing to the presence of abundant cytoplasm, often with increased cytoplasmic basophilia, particularly where the cytoplasm contacts adjacent red blood cells ( Fig. 10.2 ). Some cells may appear plasmacytoid, with moderately abundant cytoplasm and an eccentrically located nucleus ( Fig. 10.3 ). Reactive lymphocytes may occasionally exhibit significant nuclear atypia, which may raise concern for a neoplastic process ( Fig. 10.4 ). Neoplastic lymphocytes often show abnormal morphologic features, particularly nuclear abnormalities. In contrast to the wide range of morphologic variability characteristic of a reactive lymphocytosis, neoplastic lymphoid cells usually appear distinctly monomorphic ( Fig. 10.5 ). Table 10.1 summarizes the morphologic features of normal, reactive, and neoplastic lymphocytes.



| Morphology | Normal Lymphocytes | Reactive Lymphocytes | Neoplastic Lymphocytes |
|---|---|---|---|
| General features | Limited spectrum of cell shapes and sizes | Marked variability in size and shape of cells; occasional immunoblasts or plasmacytoid forms may be seen | Often a monomorphic population showing similar atypical morphologic features from cell to cell |
| Cell size | 7–15 μm | 10–25 μm | 8–30 μm |
| Nuclear-to-cytoplasmic ratio | 5:1 to 2:1 | 3:1 to 1:2 | 7:1 to 3:1 |
| Nucleus | Dense chromatin; no distinct nucleoli (subtle chromocenters may be seen) | Variably condensed chromatin; occasional cells have nucleoli (e.g., immunoblasts) | Nuclei may be cleaved or have irregular contours; chromatin varies from dense to fine and reticulated; nucleoli are variably prominent |
| Cytoplasm | Scant, pale blue | Abundant, pale blue; often stains darker blue at contact points with adjacent red blood cells | Often scant, but sometimes moderately abundant; some leukemia types have cytoplasmic projections; some high-grade lymphomas have deeply basophilic cytoplasm with vacuoles |
The remainder of this chapter provides an overview of the B-cell chronic leukemias, including some B-cell lymphoproliferative disorders that precede overt B-cell chronic leukemias ( Box 10.1 ). Chronic leukemias of T-cell or NK-cell type are discussed in Chapter 13 .
Chronic lymphocytic leukemia/small lymphocytic lymphoma
Monoclonal B-cell lymphocytosis
B-cell prolymphocytic leukemia
Splenic marginal zone lymphoma
Hairy cell leukemia
Splenic B-cell lymphoma/leukemia, unclassifiable
Splenic diffuse red pulp small B-cell lymphoma
Hairy cell leukemia variant
Lymphoplasmacytic lymphoma
Plasma cell neoplasms
Extranodal marginal zone lymphoma of mucosa-associated lymphoid tissue (MALT lymphoma)
Nodal marginal zone lymphoma
Follicular lymphoma
Mantle cell lymphoma
Diffuse large B-cell lymphoma and related subtypes
Burkitt lymphoma
High grade B-cell lymphoma
Chronic Lymphocytic Leukemia/Small Lymphocytic Lymphoma
Chronic lymphocytic leukemia (CLL) is the most common leukemia of adults in Western countries. The incidence rate ranges from 5 to 20 cases per 100,000 population, with higher rates in individuals older than 70 years. The median age at diagnosis is 72 years, and there is a male predominance (male-to-female ratio of approximately 2:1). CLL has the highest genetic predisposition among all hematologic malignancies; 5% to 10% of patients have a family history of CLL at the time of diagnosis.
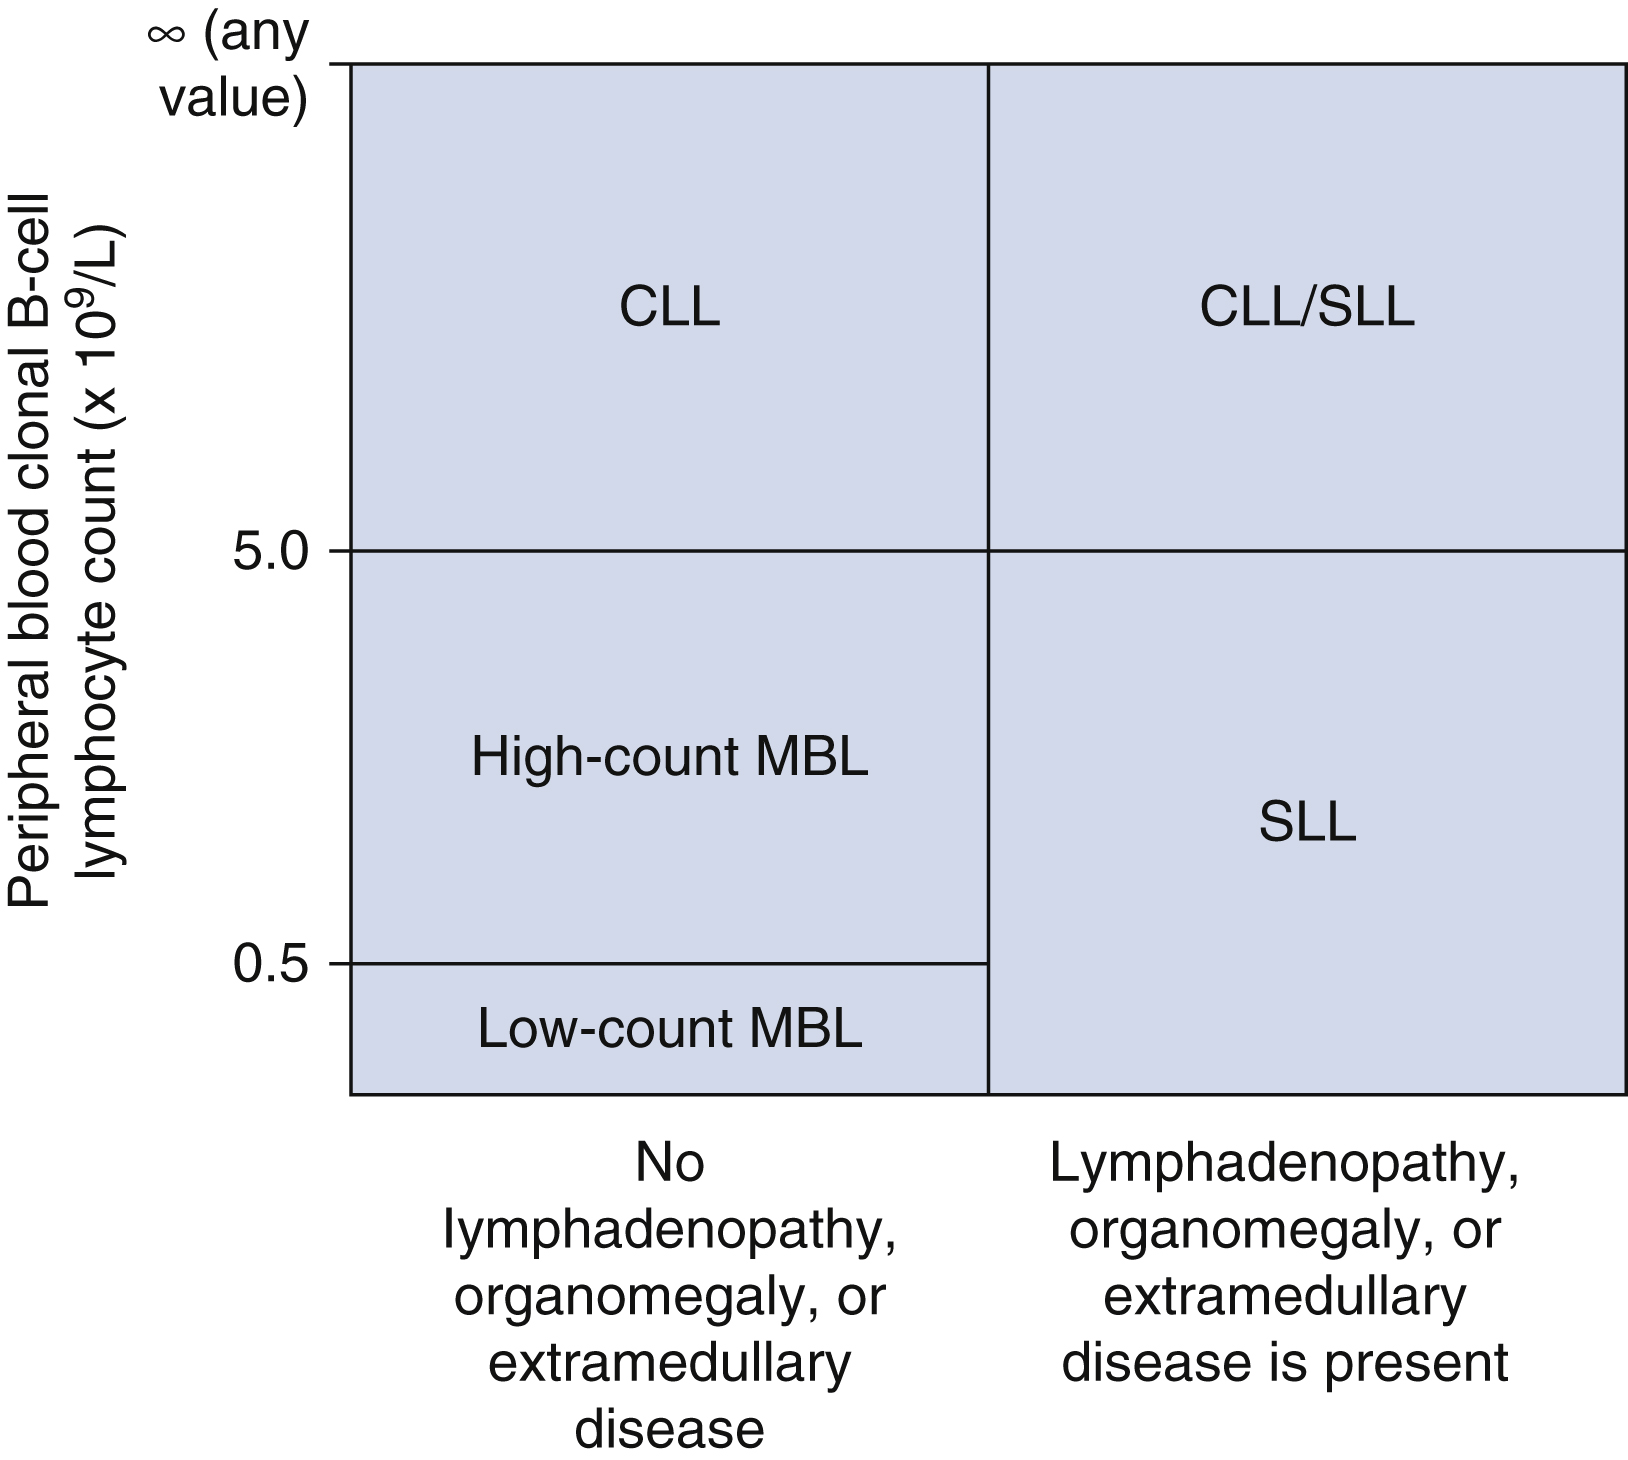
CLL is morphologically and phenotypically indistinguishable from small lymphocytic lymphoma (SLL), differing only in the degree of peripheral blood lymphocytosis and involvement of secondary lymphoid tissues. CLL is diagnosed when there is a peripheral blood clonal lymphocyte count of 5.0 × 10 9 /L or higher with a CLL-like phenotype demonstrated by FC. SLL is diagnosed when there is evidence of nodal, splenic, or extramedullary involvement and the clonal, CLL-like lymphocyte count in the blood is less than 5.0 × 10 9 /L. Patients present as either CLL or CLL/SLL in 80% to 90% of cases. Only 10% to 20% of patients lack significant blood involvement and are classified as SLL. Clonal, CLL-like proliferations less than 5.0 × 10 9 /L without lymphadenopathy, organomegaly, or other features of a B-cell lymphoproliferative disorder are classified as monoclonal B-cell lymphocytosis (MBL) ( Fig. 10.6 ).
Patients with CLL are often asymptomatic and the disease is identified incidentally when a complete blood cell count is performed for an unrelated reason. Some patients present with lymphadenopathy or splenomegaly, leading to a diagnosis of CLL/SLL or SLL. Uncommonly, the disease is identified during evaluation for an immune-mediated cytopenia such as a hemolytic anemia or immune thrombocytopenia. A small paraprotein, usually of the immunoglobulin M(IgM) type, can be identified in approximately 10% of patients.
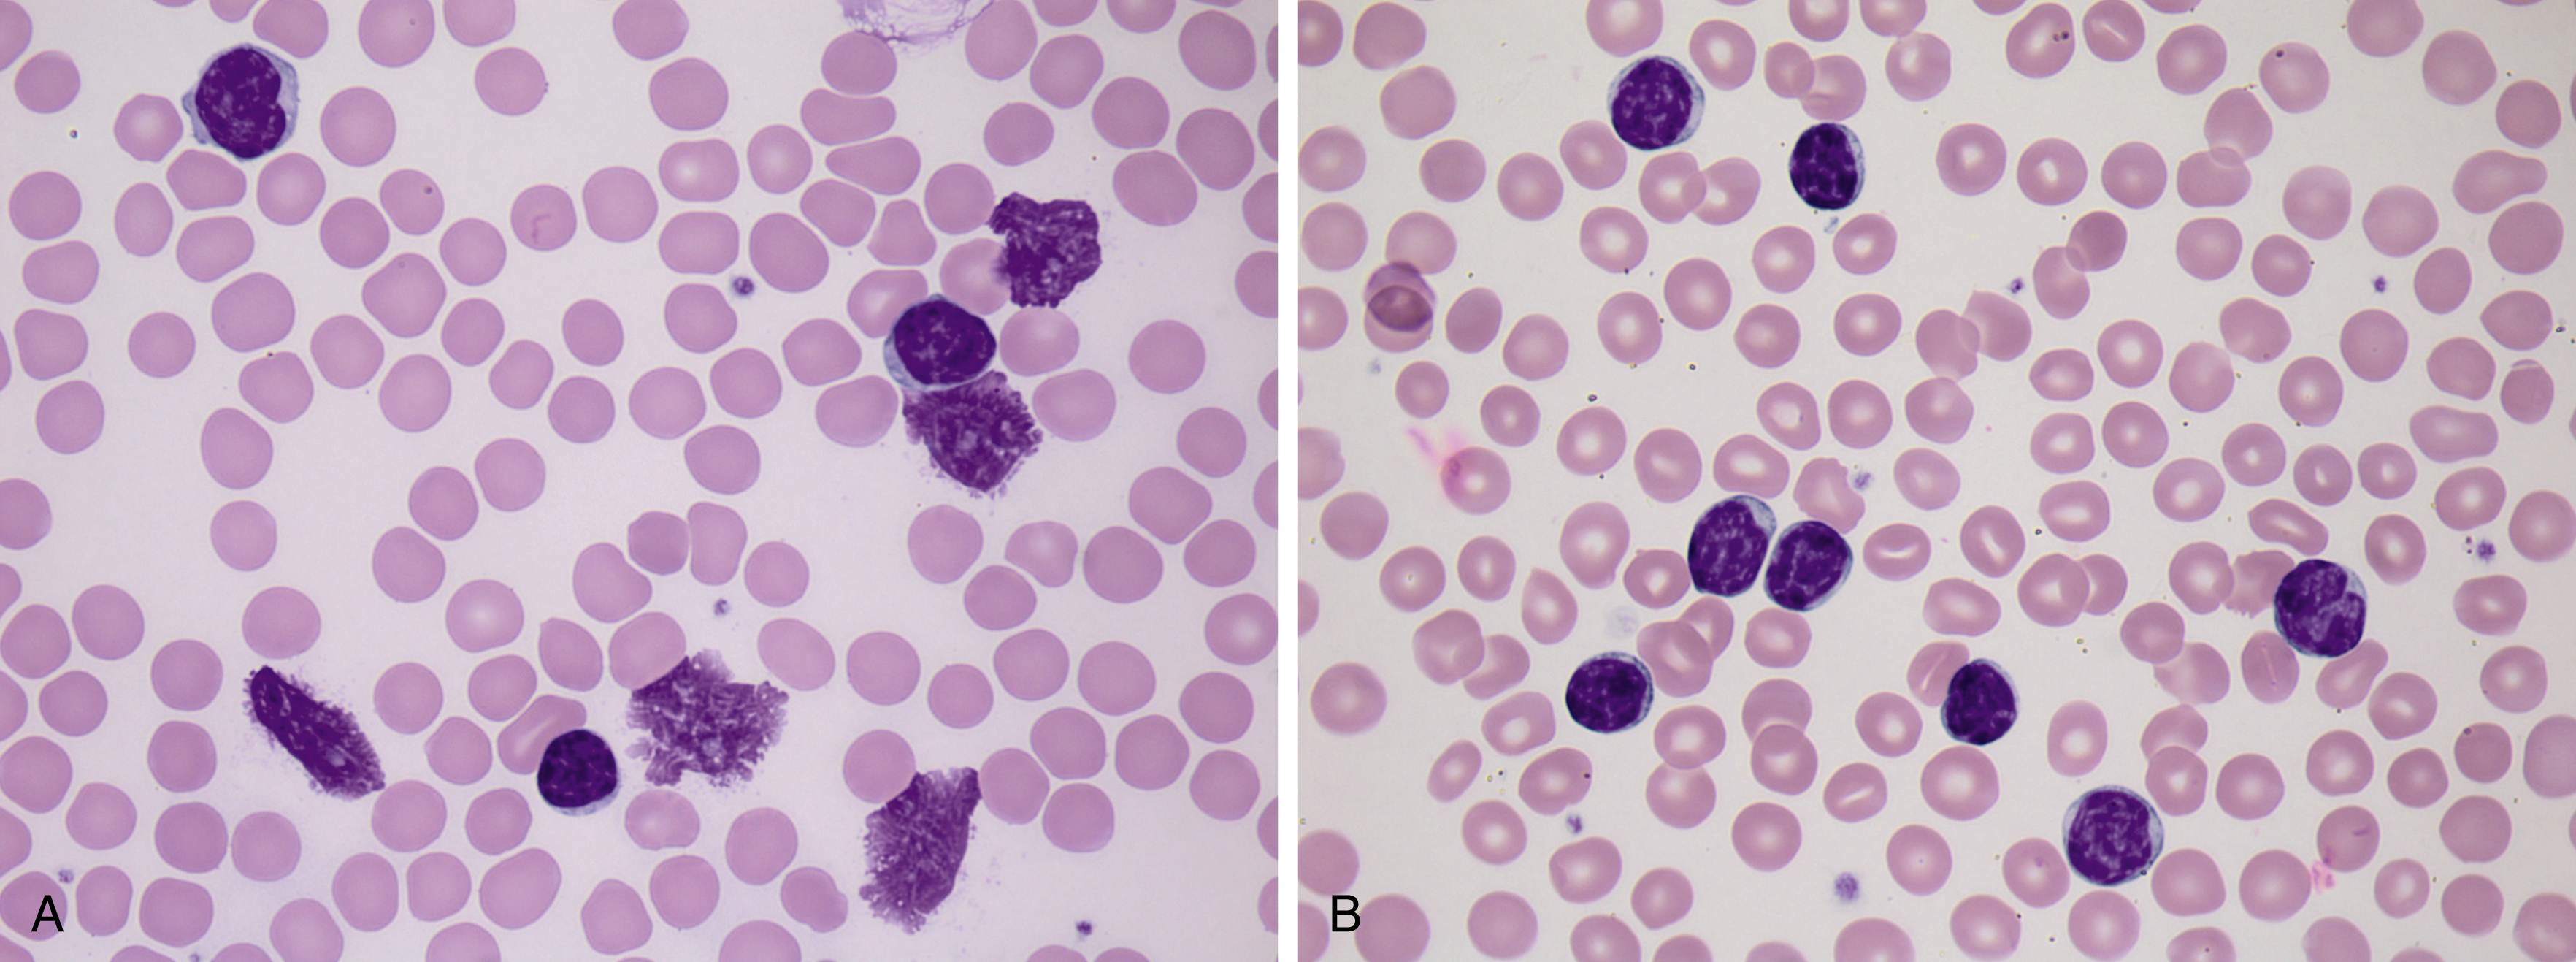
The lymphocytes of CLL/SLL are generally small and have round nuclei, condensed chromatin, and scant cytoplasm. Individual CLL cells may be difficult to distinguish from normal lymphocytes. Morphologic clues suggestive of CLL include a marked lymphocytosis, the presence of many smudge cells, and subtle cytologic abnormalities such as a cracked appearance to the chromatin ( Fig. 10.7A ). A smudge cell represents a disrupted lymphocyte nucleus that has been stripped of cytoplasm and occurs as an artifact of blood smear preparation owing to the fragility of the CLL cells. Smudge cells can be reduced by adding a drop of serum albumin to four or five drops of blood before making the blood smear ( Fig. 10.7B ). Note that smudge cells are not specific to CLL/SLL and may be seen in other lymphoproliferative disorders or in reactive lymphocytes.
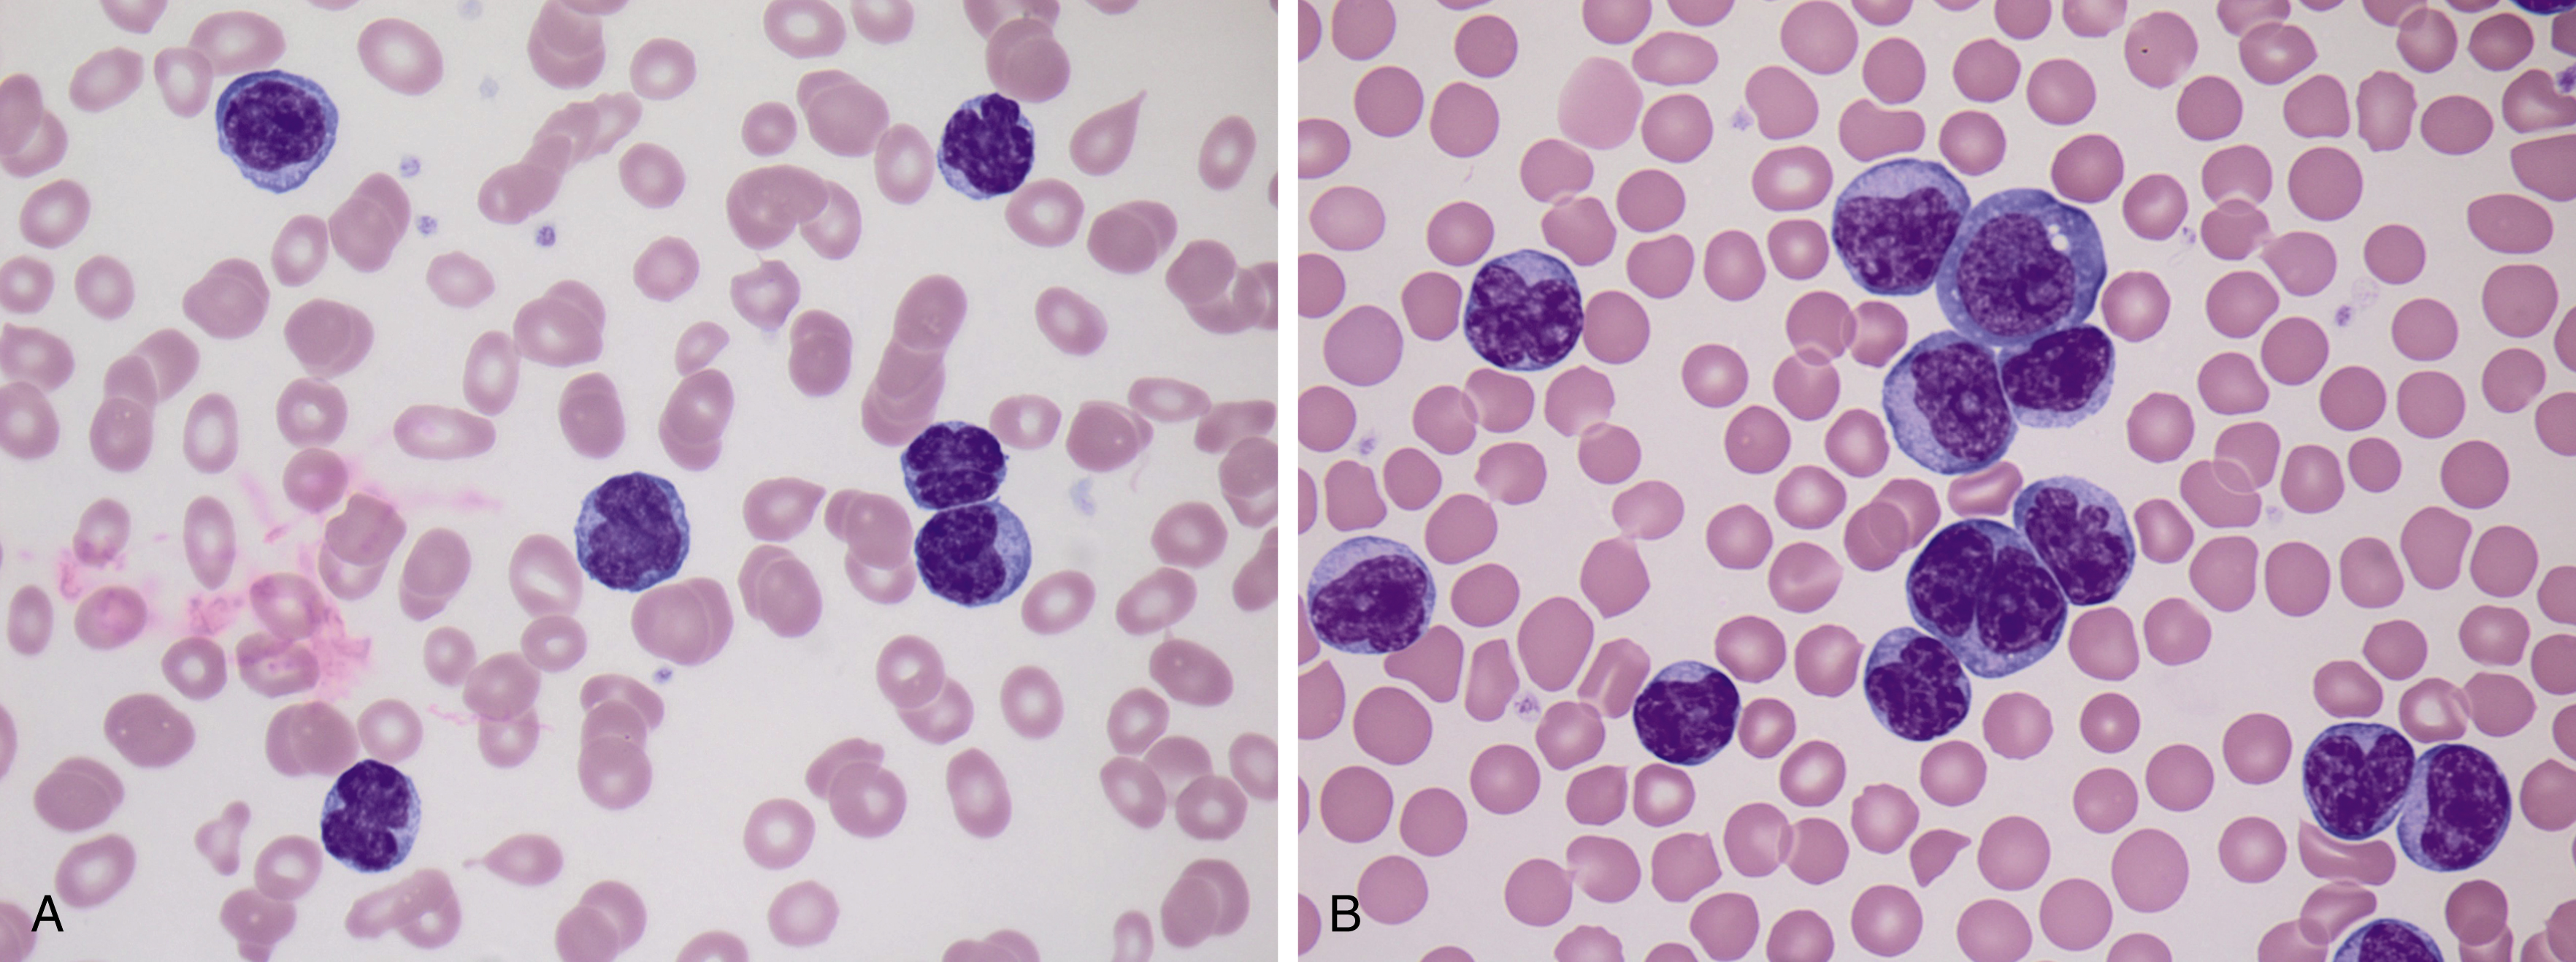
Some cases of CLL/SLL show atypical morphologic features such as larger cell size or a greater degree of nuclear atypia ( Fig. 10.8 ). Prolymphocytes, which are larger lymphoid cells with more dispersed chromatin and a characteristic prominent nucleolus, are often present in low numbers in cases of CLL/SLL (often <5% of lymphocytes). CLL/SLL cases with more than 15% prolymphocytes suggest disease progression and may be associated with worsening clinical symptomatology ( Fig. 10.9 ).

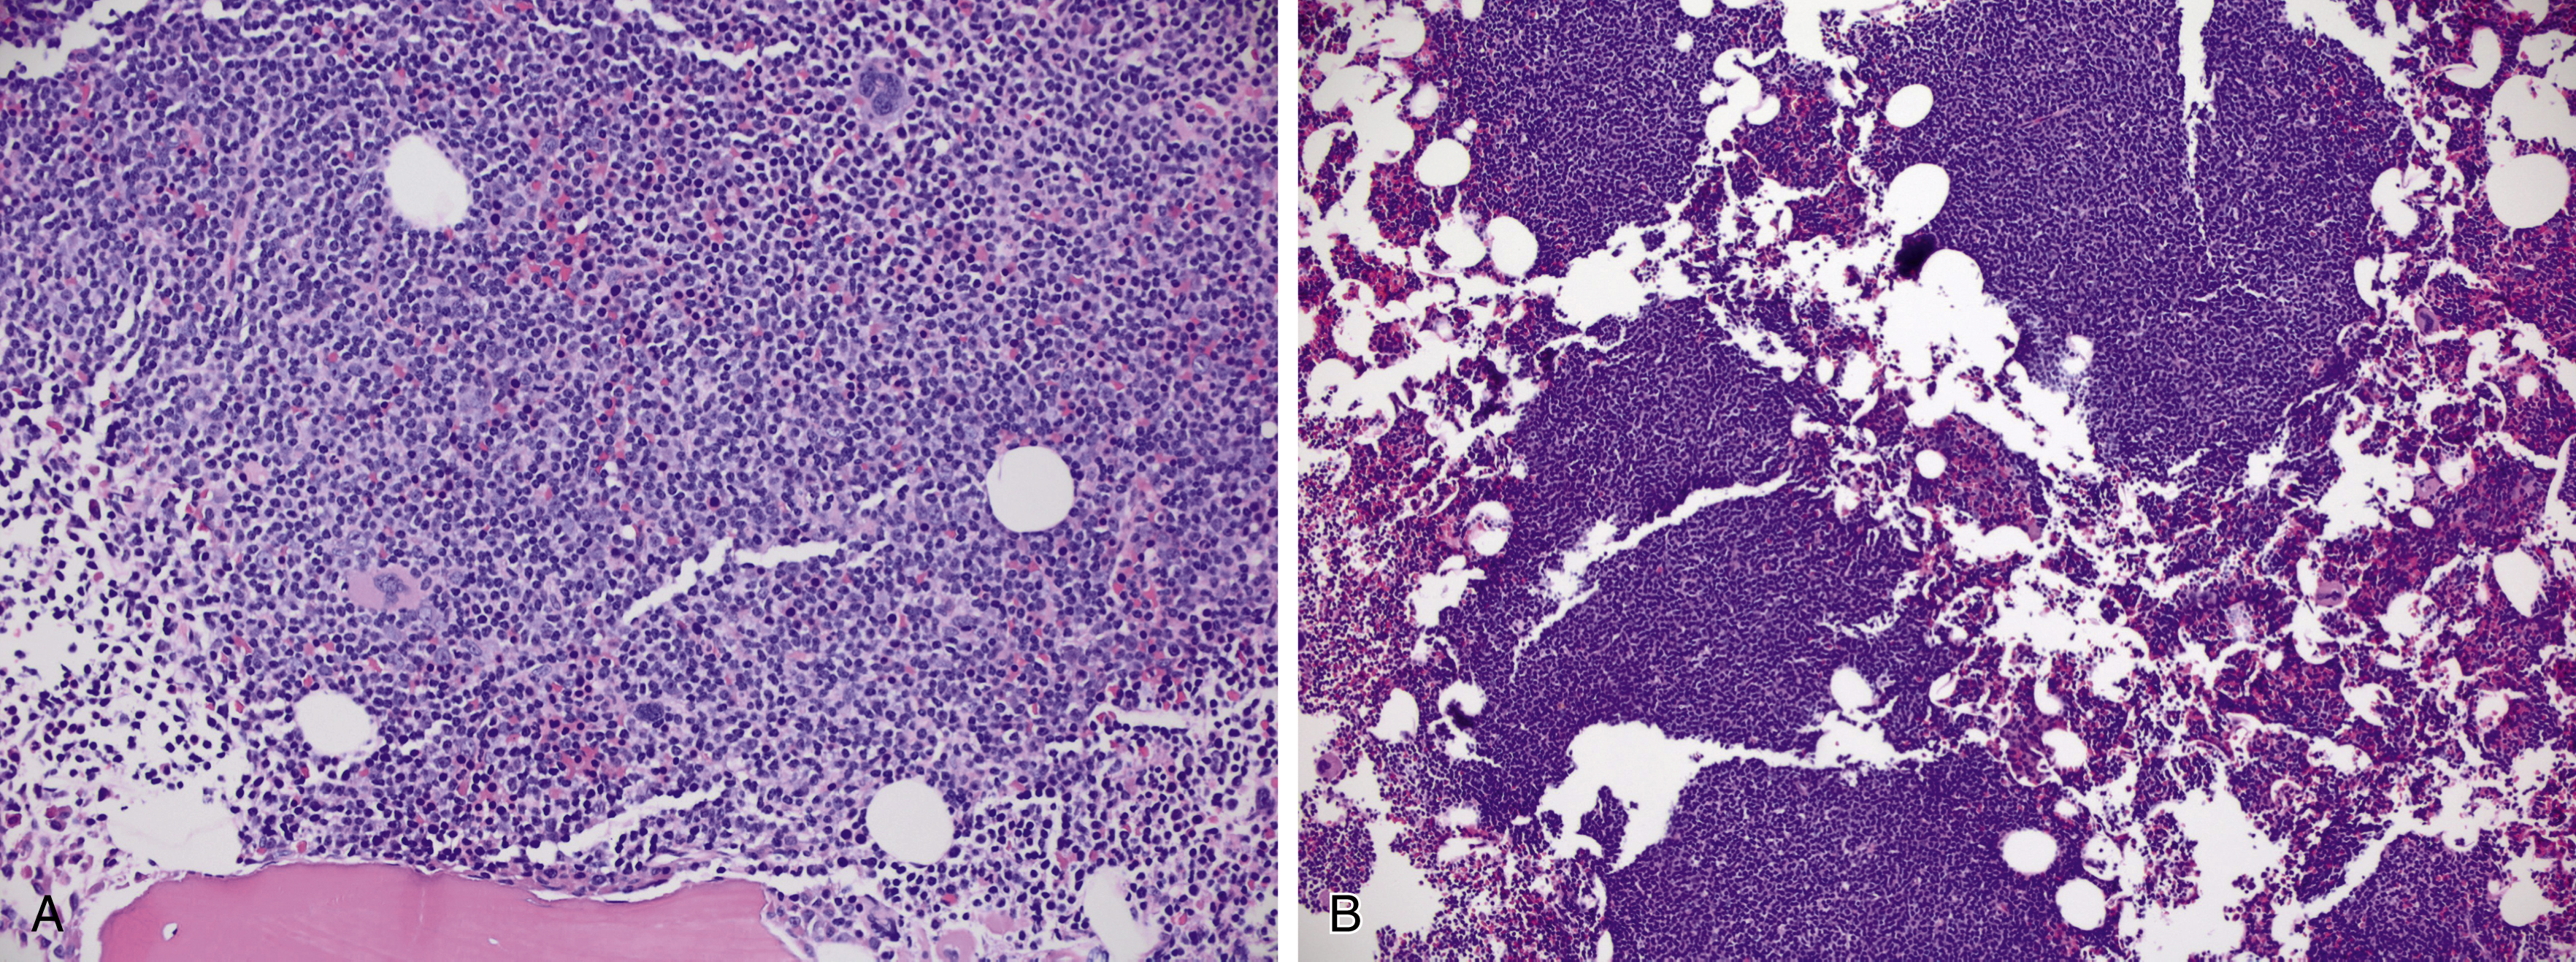
Bone marrow (BM) involvement is present in the vast majority of CLL cases and usually occurs in an interstitial (nonparatrabecular) distribution. The lymphoid infiltrate may appear diffuse, nodular, or as a combination of these patterns ( Fig. 10.10 ).
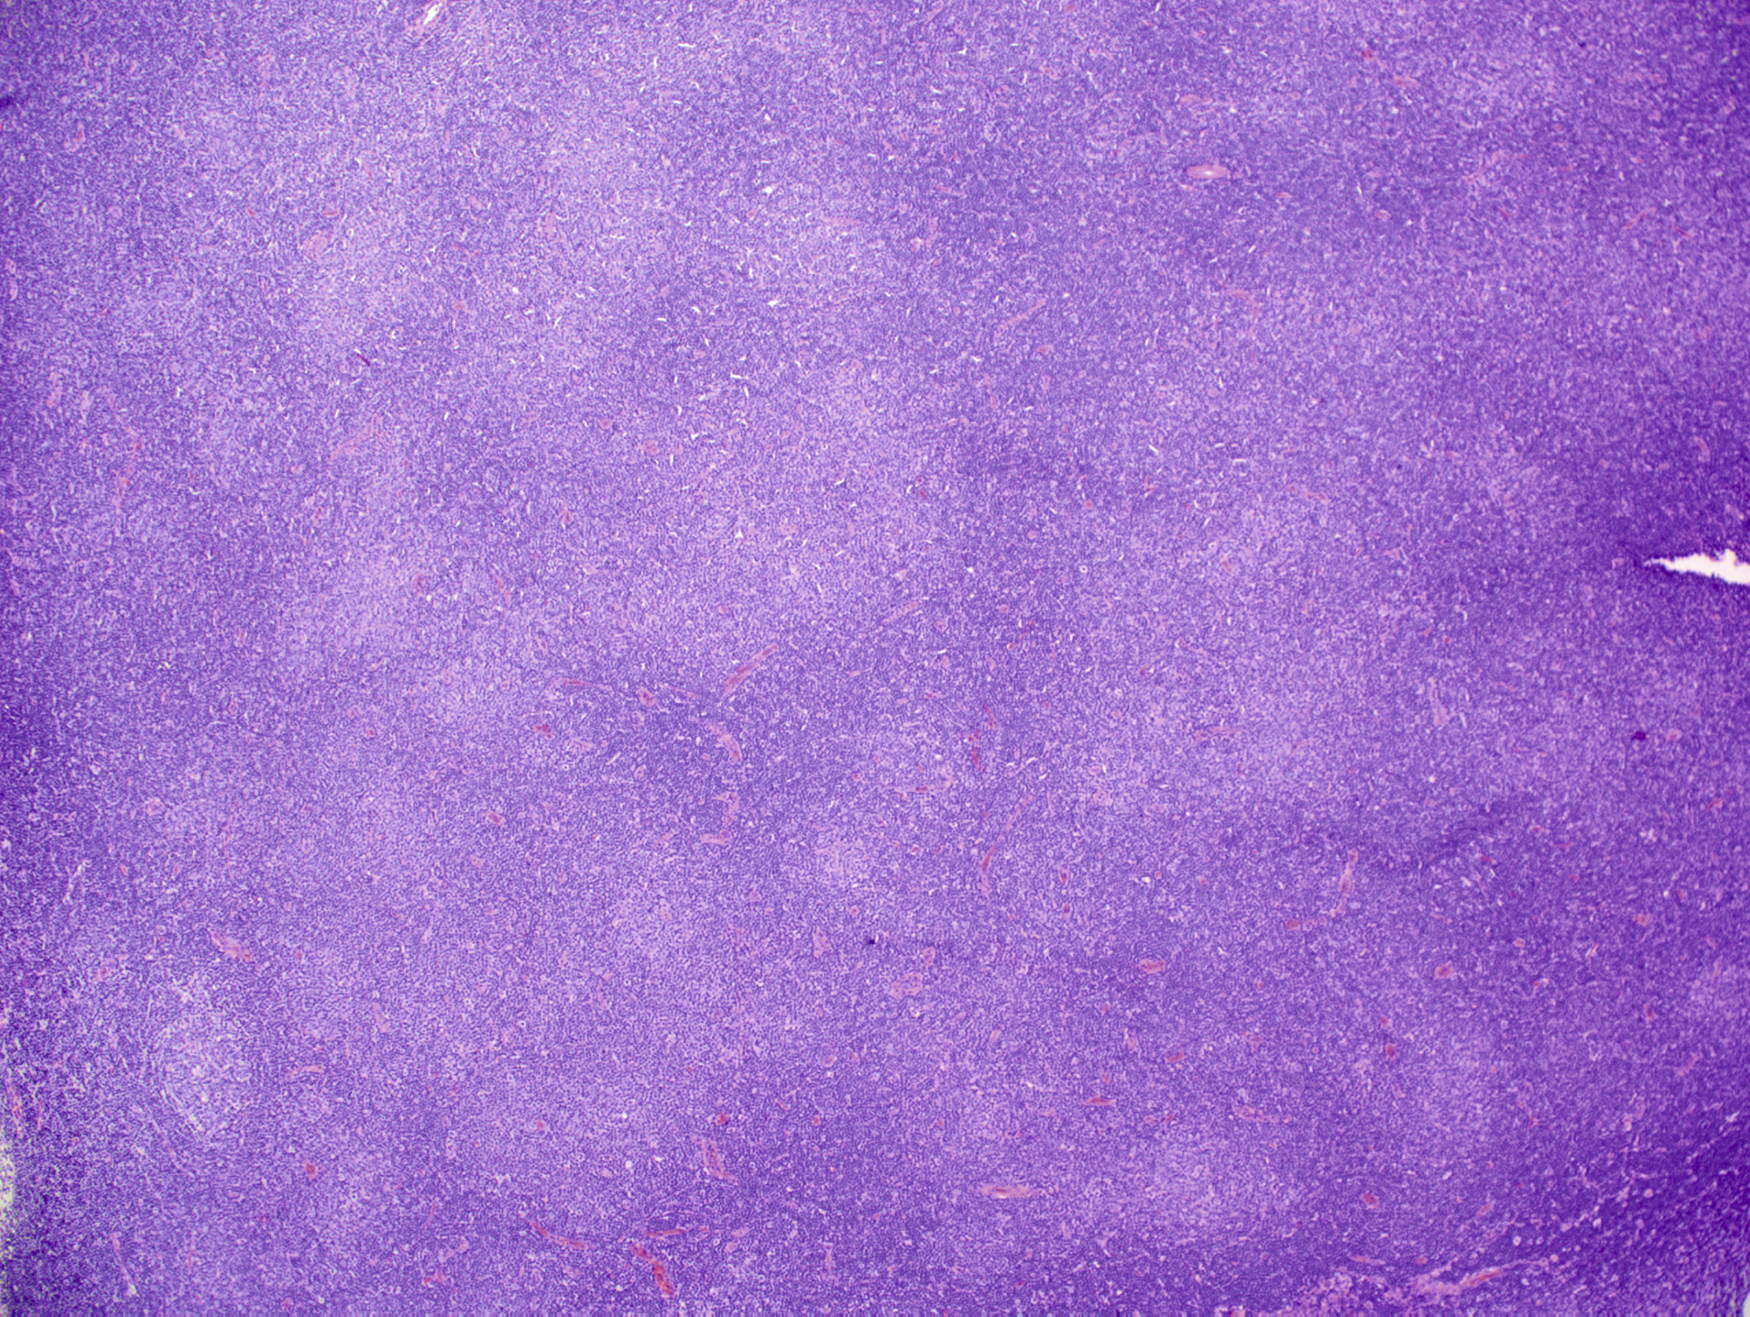
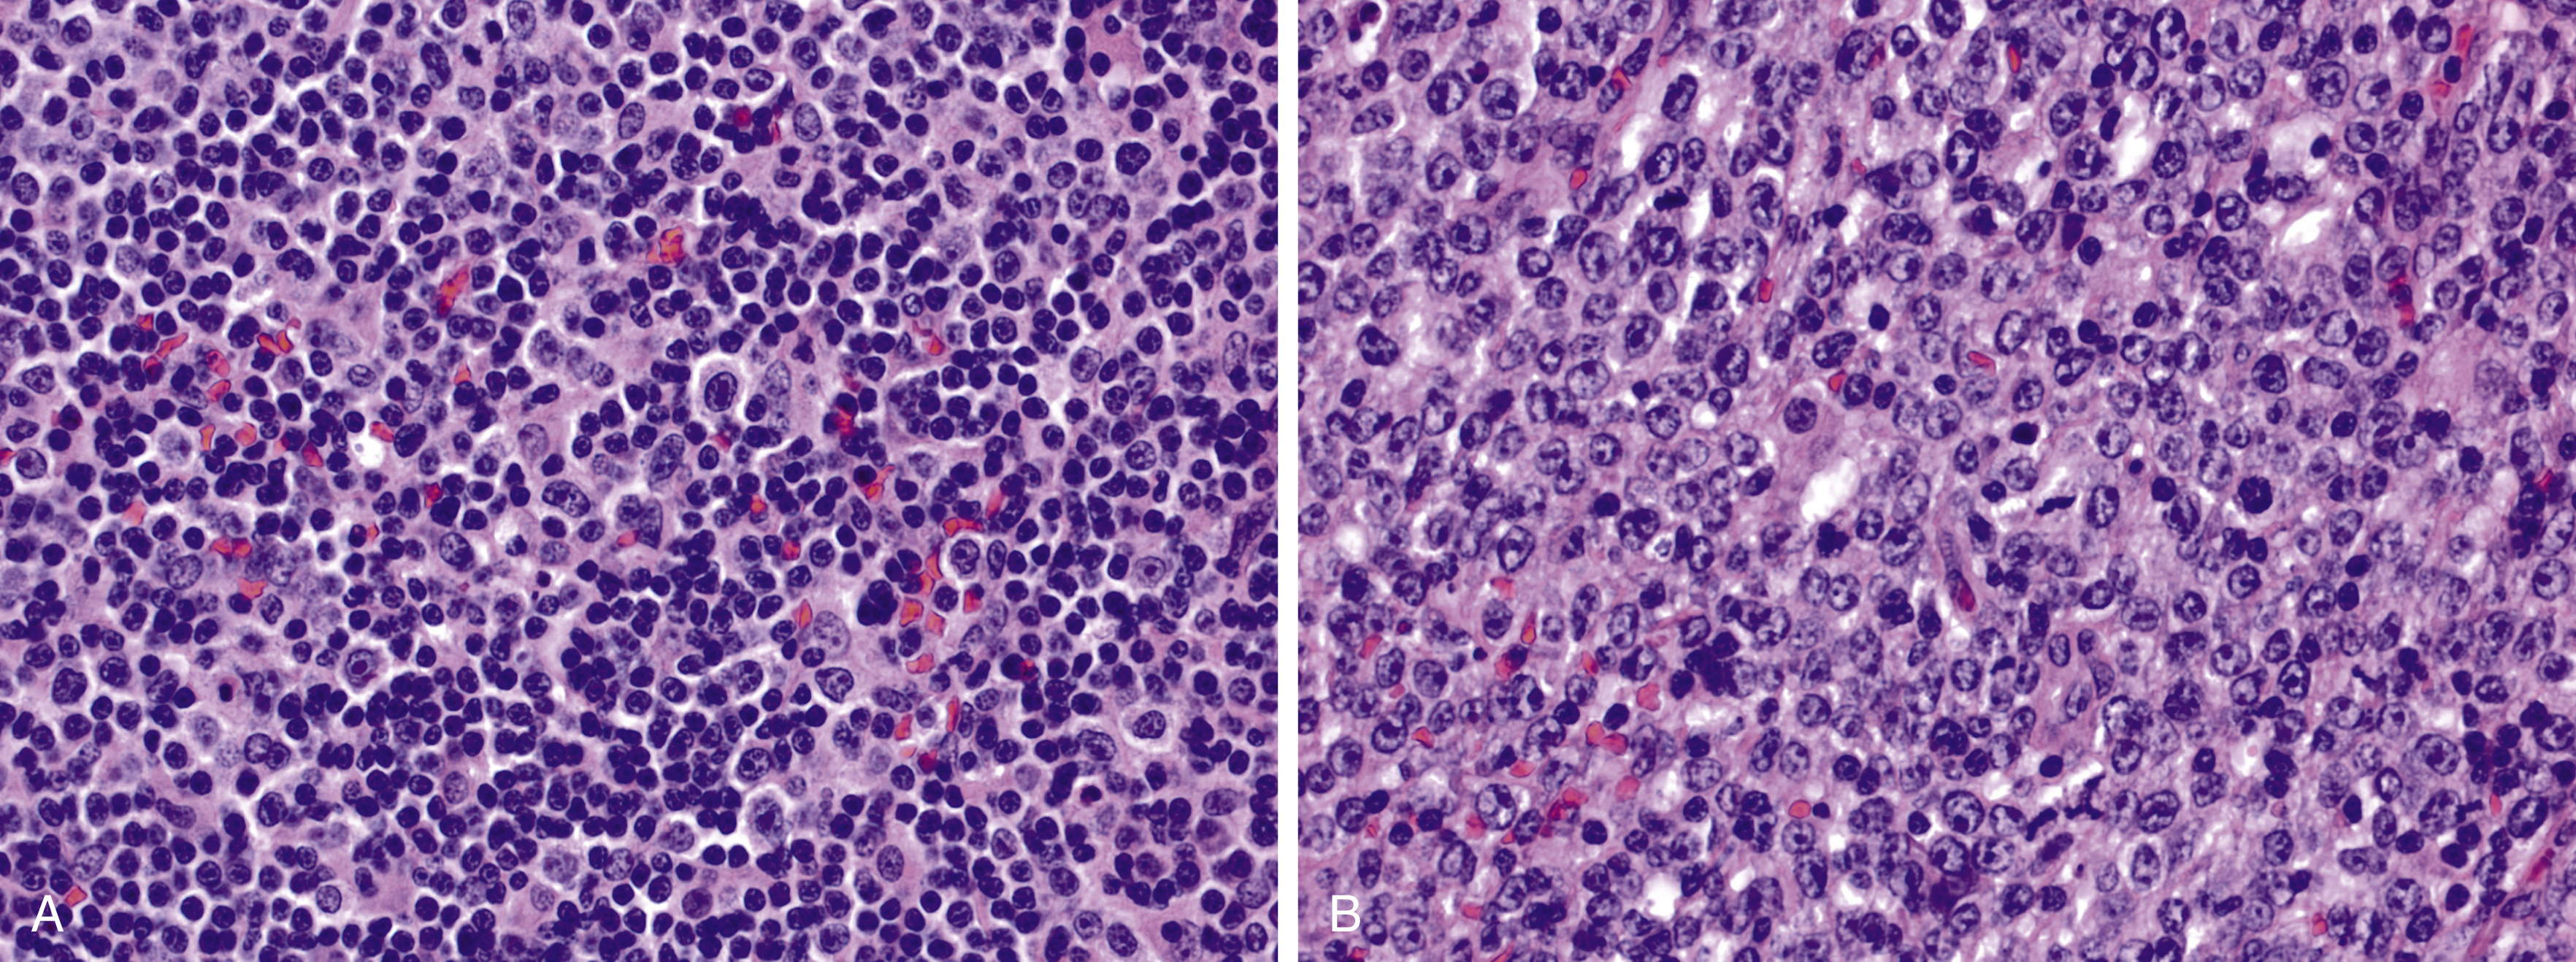
Lymph node involvement in SLL or CLL/SLL is characterized by effacement of the normal nodal architecture by a diffuse infiltrate of small lymphocytes. At low power, there are characteristic subtle pale areas referred to as proliferation centers that contain increased numbers of larger lymphoid cells and impart a pseudo-nodular appearance ( Fig. 10.11 ). Larger lymphoid cells in the proliferation centers include prolymphocytes and slightly larger paraimmunoblasts ( Fig. 10.12A ). Transformation to diffuse large B-cell lymphoma, referred to as Richter transformation, occurs in 2% to 8% of patients with CLL/SLL and portends a very poor prognosis ( Fig. 10.12B ).
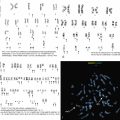
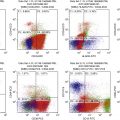
FC is essential for the diagnosis of CLL/SLL because the disease has a characteristic phenotype ( Table 10.2 ). CLL/SLL cells express pan–B-cell antigens such as CD19 and CD20, with CD20 expression often dimmer than normal B cells. The vast majority of cases express CD5, CD23, and CD200 and show dim monotypic κ or λ surface light chain expression. Approximately 80% to 90% of cases have cytogenetic abnormalities detectable by fluorescence in situ hybridization (FISH). Particular cytogenetic abnormalities, as well as molecular assays and other established prognostic features such as ZAP70 and CD38, are useful in determining an individual’s prognosis and can help guide therapy ( Table 10.3 , Fig. 10.13 ).
| Disease | CD5 | CD10 | CD11c | CD20 | CD22 | CD23 | CD25 | CD103 | CD123 | CD200 | FMC7 |
|---|---|---|---|---|---|---|---|---|---|---|---|
| CLL/SLL | + | − | −/+ | +(d) | + | + | − | − | − | + | − |
| B-PLL | −/+ | − | − | + | + | −/+ | − | − | − | −/+ | + |
| HCL | − | − | +(b) | +(b) | +(b) | − | + | + | + | +(b) | + |
| HCL-v | − | − | + | +(b) | + | v | − | + | − | −/+ | + |
| SMZL | − | − | +/− | + | + | − | −/+ | − | − | +/− | + |
| LPL | − | − | − | + | + | −/+ | +/− | − | − | +/− | + |
| FL | − | + | − | + | + | − | − | − | − | −/+ | + |
| MCL | + | − | − | + | + | − | − | − | − | − | + |
| Type of Testing | Abnormality | Frequency | Better Prognosis | Worse Prognosis |
|---|---|---|---|---|
| FISH | No FISH abnormality | 10%–20% | + | |
| del(13q14) | 50% | + | ||
| +12 | 20% | + | ||
| del(11q22-23) ATM , BIRC3 | 10%–15% | + | ||
| del(17p) TP53 | 5%–10% | + | ||
| del(6q21) MYB | 5% | + | ||
| Molecular | Mutated IGHV genes | 50%–70% | + | |
| Unmutated IGHV genes | 30%–50% | + | ||
| TP53 mutation | 5%–10% | + | ||
| Flow cytometry | ZAP70 + | 25%–45% | + | |
| CD38 + | 30%–40% | + |

For many years, clinical staging has been based on either the Rai or Binet system, and these systems are still widely used ( Table 10.4 ). In 2016, an international prognostic index for CLL/SLL was published, which includes the Rai or Binet stage but also incorporates the powerful negative prognostic impact of certain molecular genetic abnormalities, particularly del(17p) or TP53 mutation ( Table 10.5 ).
| System | Stage | Definition | Median Survival |
|---|---|---|---|
| Rai staging system | 0 (low risk) | Lymphocytosis only | 11.5 years |
| I (intermediate risk) | Lymphocytosis and lymphadenopathy | 11.0 years | |
| II (intermediate risk) | Lymphocytosis in blood and marrow with splenomegaly and/or hepatomegaly (with or without lymphadenopathy) | 7.8 years | |
| III (high risk) | Lymphocytosis and anemia (hemoglobin <11 g/dL or hematocrit <33%) | 5.3 years | |
| IV (high risk) | Lymphocytosis and thrombocytopenia (platelet count <100,000/mm 3 ) | 7.0 years | |
| Binet staging system | A | Enlargement of <3 lymphoid areas (cervical, axillary, inguinal, spleen, liver); no anemia or thrombocytopenia | 11.5 years |
| B | Enlargement of ≥3 lymphoid areas | 8.6 years | |
| C | Anemia (hemoglobin <10 g/dL or thrombocytopenia platelet count <100,000/mm 3 ), or both | 7.0 years |
| Prognostic Feature | Adverse Factor | Grade |
|---|---|---|
| Age | >65 years | 1 |
| Clinical stage | Rai I–V or Binet B–C | 1 |
| β 2 -microglobulin level | >3.5 mg/L | 2 |
| IGHV mutation status | Unmutated (>98% homology with germline) | 2 |
| Del(17p) and/or TP53 mutation | Present | 4 |
Stay updated, free articles. Join our Telegram channel

Full access? Get Clinical Tree


