Age Related Changes in Thyroid Function
Laura Boucai
Martin I. Surks
Introduction
Life span is increasing in many countries and, as a consequence, attention has focused on the impact that changes in thyroid function may have on the aging process. Many changes that occur during healthy aging mimic those of hypothyroidism; e.g. fatigue, dry skin, cold intolerance, and constipation, and the evaluation of thyroid function in the elderly is often complicated by an increased prevalence of chronic illnesses and use of medications, both of which can affect the concentration of thyroid hormones. Distinguishing between changes in thyroid hormone and thyrotropin (TSH) concentrations related to normal aging and changes that reflect thyroid disease can be challenging. Several controversies remain unresolved regarding diagnosis and treatment of thyroid disease in elderly people. First, thyroid dysfunction is difficult to diagnose clinically in the elderly because symptoms and signs characteristic of young people may not occur in older populations. Physicians must therefore rely on laboratory measurements, particularly serum TSH, as this is the most sensitive test of thyroid function. During the last decade, opinions regarding the upper limit of the TSH reference range have varied widely, affecting the classification of large numbers of people, particularly the elderly, with hypothyroidism. Second, levothyroxine treatment deserves special attention in older patients because of a significant incidence of iatrogenic hyperthyroidism and its associated risks of atrial fibrillation and bone loss. Finally, prospective studies of beneficial effects of levothyroxine treatment on objective health outcomes have not been conducted to date, complicating the ability of clinicians to make informed treatment decisions in the elderly population.
In this chapter, we will discuss changes in free thyroid hormones that occur with aging, but focus primarily on TSH because of new findings that substantially change the interpretation of the traditional TSH distribution curve which are particularly relevant to the elderly. We will discuss new concepts of changes in TSH distribution and reference limits that occur as a function of age and ethnicity, and relate these changes to population-specific criteria for diagnosis of hyperthyroidism and hypothyroidism. Finally, we will mention several new studies that raise the intriguing possibility that shifts in TSH distribution to higher concentrations with age may be genetically determined and contribute to longevity.
Changes in Thyroid Function Tests with Age
Free T4 and Free T3
Most studies have shown either no change or a minimal decrease in free thyroxine (T4) concentrations with age (1,2,3,4,5,6). The combination of unchanged T4 concentration and decreased T4 metabolic clearance rate with age (7) suggests an age-related decrease in thyroid hormone secretion by the thyroid gland. This is supported by the fact that the levothyroxine replacement dosage in hypothyroid elderly patients is less than that in younger patients (8,9). T4 secretion and degradation appears to be decreased with age, but serum free T4 concentrations are unchanged or only minimally decreased.
Since there is less T4 secreted in older persons, the serum concentration of triiodothyronine (T3) might also be lower because most circulating T3 derives from monodeiodination of T4. The recognition that acute and chronic illness could cause a decrease in serum T3 complicates the interpretation of these levels in elderly individuals. Data on healthy centenarians, however, was most recently employed to examine this issue. While some studies suggest that free T3 concentrations decrease with age (10,11), these lower concentrations remain within the reference range for T3. Others have not found a decrease in T3 even in very old individuals (12). Overall, there is likely a slight fall in serum free T3 with increasing age, but the T3 concentration remains within the reference range. Clearly low levels of T3 might occur either in hypothyroidism or as a consequence of a non-thyroidal illness.
Serum TSH
Studies of TSH concentrations in groups of older patients have produced variable results, some suggesting increased TSH (2,3,4,5,6,13), and some decreased TSH (10,11,14,15,16,17) in comparison to young subjects. Differences between studies may be related to lack of homogeneity in the study populations, exclusion of people with TSH outside of locally established reference limits, or studies done in areas of variable iodine deficiency.
Despite these differences, TSH concentrations have been reported to change with age, so particular attention has focused on attempting to define precise TSH reference limits, above which patients would be classified as having primary
hypothyroidism. The traditional TSH distribution curve, which is the basis for calculating reference limits, uses measurements from people of all ages, ethnicities, and gender that have been weighted to represent the population of the United States. The third National Health and Nutrition Examination Survey (NHANES III) provides national normative estimates of the health and nutritional status of people in the United States, and serves as the major database to establish TSH reference limits. In NHANES III, conducted from 1988 through 1994, three populations were defined to analyze TSH distribution and determine TSH reference limits. The total population consisted of 17,353 subjects 12 years of age and older who had TSH, total T4, and thyroid antibodies (ABs) (thyroperoxidase and thyroglobulin) determined. A disease-free population (n = 16,533) excluded people from the total population who reported thyroid disease, goiter, or who were taking thyroid medications. A reference population (n = 13,344) was established from the disease-free population after exclusion of subjects with thyroid ABs, or who had laboratory evidence of hypothyroidism or hyperthyroidism, and other risk factors for thyroid dysfunction such as pregnancy, or subjects taking estrogens, androgens, or lithium (18). The 97.5th percentile of the TSH distribution in the reference population was 4.12 mIU/L, and a TSH concentration of 4.5 mIU/L was arbitrarily defined as the upper reference limit.
hypothyroidism. The traditional TSH distribution curve, which is the basis for calculating reference limits, uses measurements from people of all ages, ethnicities, and gender that have been weighted to represent the population of the United States. The third National Health and Nutrition Examination Survey (NHANES III) provides national normative estimates of the health and nutritional status of people in the United States, and serves as the major database to establish TSH reference limits. In NHANES III, conducted from 1988 through 1994, three populations were defined to analyze TSH distribution and determine TSH reference limits. The total population consisted of 17,353 subjects 12 years of age and older who had TSH, total T4, and thyroid antibodies (ABs) (thyroperoxidase and thyroglobulin) determined. A disease-free population (n = 16,533) excluded people from the total population who reported thyroid disease, goiter, or who were taking thyroid medications. A reference population (n = 13,344) was established from the disease-free population after exclusion of subjects with thyroid ABs, or who had laboratory evidence of hypothyroidism or hyperthyroidism, and other risk factors for thyroid dysfunction such as pregnancy, or subjects taking estrogens, androgens, or lithium (18). The 97.5th percentile of the TSH distribution in the reference population was 4.12 mIU/L, and a TSH concentration of 4.5 mIU/L was arbitrarily defined as the upper reference limit.
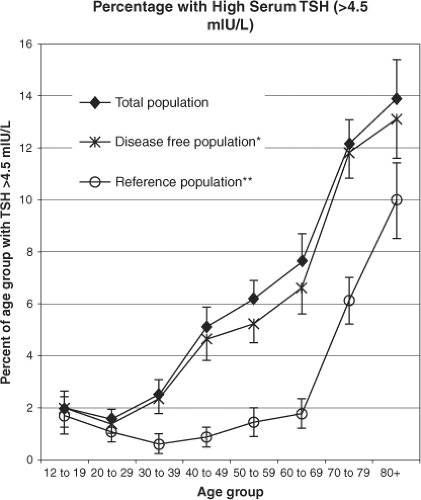
A detailed analysis of TSH, T4, and antithyroid ABs in these populations showed a dramatic and progressive increase in the prevalence of raised TSH above 4.5 mIU/L with age to up to 15% of individuals more than 70 years old. This occurred in the total population as well as in the disease-free and the reference populations (those without antithyroid ABs) (Fig. 11A.1). Since about 35 million Americans are currently older than 70 years of age, 5.25 million would be predicted to have raised TSH and therefore be designated hypothyroid by that analysis; 85% of those with TSH higher than 4.5 mIU/L had normal serum T4 and would therefore be diagnosed with subclinical hypothyroidism. Despite small but statistically significant differences in median TSH and reference limits in different age groups, gender, and races, the authors suggested that TSH reference intervals need not be individually adjusted for these subpopulations (18).
The significant increase in TSH concentrations that occurs with age is based on the traditional interpretation of the TSH distribution curve and the calculated upper limit, which is assumed to apply to people of all ages and ethnicities. Such reference limits have been used by all endocrinologists since TSH measurements became available. In 2002, the National Academy of Clinical Biochemistry (NACB) published consensus guidelines that provided methodology and criteria for optimal TSH determination, including determination of reference limits (19). They suggested that reference limits be established from TSH concentrations of at least 120 individuals who do not have thyroid disease. Such individuals should not have visible goiter, family or personal history of thyroid disease, take medications that can affect thyroid function, or have antithyroid ABs. The TSH distribution curve of such individuals is not Gaussian but is right-skewed toward higher TSH concentrations, even after log transformation (19).
Stay updated, free articles. Join our Telegram channel

Full access? Get Clinical Tree


