Figure 2.1: Liver function
In Figure 2.1 (above), we could review LFT jaundice as follows:
Table 2.1: Sample LFT jaundice results

Part 3 – Production
In this example we will look in detail at how the blood results change in response to increased or decreased production. Typical pathologies here include ‘inflammation’, ‘infection’, ‘clotting’, ‘bleeds’ and patterns of ‘anaemia’.

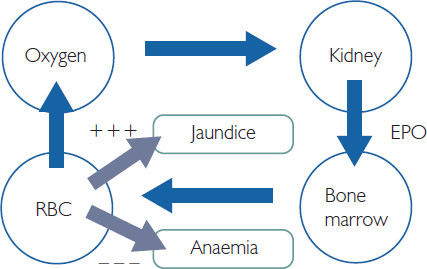
Figure 2.2: EPO production
Red cell production
Red blood cells are produced by the bone marrow and spleen under the action of a hormone called erythropoietin (EPO), which is produced by the kidney. If the kidney is not working properly, it may not be able to produce EPO and red cell production may therefore be compromised. This is called renal anaemia.
Looking at Figure 2.2 (above), the kidney produces EPO, which acts on the bone marrow to produce more red blood cells. If the patient produces too many red blood cells, they may make too much bilirubin and this may lead to a pre-hepatic jaundice, as discussed earlier. If the kidney is unable to make EPO, the patient may make fewer red blood cells and develop anaemia. This process is often called ‘IN/OUT’. For example:
•Kidney: Oxygen/CO2 levels IN – EPO OUT
•Bone marrow: EPO IN leads to RBC OUT
•Liver: Indirect bilirubin IN – direct bilirubin OUT
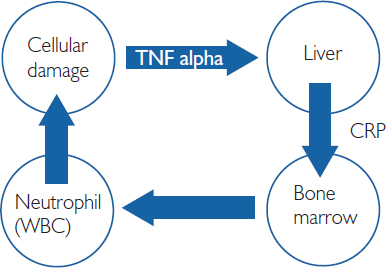
You may find it helpful to draw a network diagram with the key organs and connect them with IN/OUT arrows, as in Figure 2.3 (below). You can then run scenarios by switching off the kidney and seeing which IN/OUT arrows would be changed. This can help you map interconnected symptoms to the blood tests.
White cell production
We have a similar IN/OUT diagram for white cell production. In Figure 2.3 (below) cell damage releases a chemical called TNF, which goes to the liver. This in turn produces CRP, which induces the liver to make more neutrophils and thus more white blood cells.
Liver – IN (TNF) and OUT (CRP)
Bone marrow – IN (CRP) and OUT (Neutrophils/WBC)

Figure 2.3: White cell production
Stay updated, free articles. Join our Telegram channel

Full access? Get Clinical Tree


