Clinical Utility of Single Nucleotide Polymorphism Arrays
Cytogenetics Laboratory, Laboratory Corporation of America, 1904 Alexander Drive, Research Triangle Park, NC 27709, USA
Keywords
• Single nucleotide polymorphism microarray • Prenatal arrays • Oncology arrays • Uniparental disomy • Runs of homozygosity • Consanguinity
Since Tjio and Levan1 first eloquently demonstrated in 1956 that the true chromosome number in humans was 46, cytogeneticists have striven to optimize resolution used in the analysis of chromosomes and detection of chromosomal analysis. Initial resolution of unbanded chromosomes was limited, and only abnormalities involving genomic material greater than about 20 to 25 megabase (Mb) could be detected. The resolution improved to about 10 Mb with the advent of banding and the routine analysis of chromosomes at the 500 to 550 band level. In 1976, Yunis2 initially introduced methodology for the examination of prophase/prometaphase chromosomes (at higher resolution), where abnormalities as small as 3 to 5 Mb could be detected. However, the greatest breakthrough came over 2 decades ago in 1988, when it was demonstrated that fluorescence in situ hybridization (FISH) could be used to detect small abnormalities.3 FISH can routinely detect changes as small as 150 kilobase (kb) in size; however, it is a directed analysis. An abnormality must first be suspected so that the appropriate probe(s) may be used to see if there is an alteration within the region of question. Initial FISH studies involved commercially developed probes and were limited in scope; however, with the sequencing of the human genome, probes are now available for any region. The combination of FISH technology, comparative genomic hybridization (CGH) involving chromosomes, and the Human Genome Project led to the development of array technology and to the detection of 50 to 150 kb alterations anywhere in the genome. Array technology allows a combination of the routine banding (which gives a whole-genome perspective) together with FISH (giving a resolution of 50–150 kb).
Single Nucleotide Polymorphism Methodology
There are several different types of genomic arrays using different DNA probes, including bacterial artificial chromosome (BAC), oligonucleotide and single nucleotide polymorphism (SNP) arrays. Both BAC and oligonucleotide arrays are CGH arrays.4 These arrays combine high throughput technology with genomic studies, using sequence data produced during the Human Genome Project. CGH arrays use a two-color system, in which the patient DNA is labeled in one color (eg, green), and normal control DNA is labeled using a second color (eg, red). Both patient and control DNA are hybridized together onto the probes spotted onto a glass slide, and the alterations can be detected based on the fluorescence of the probes (ie, color; yellow: normal, red: deletion, green: duplication). BAC probes are approximately 150 kb in size and in comparison with oligonucleotide probes are less sensitive and provide less coverage. Oligonucleotide probes are 60 mer in size, providing more sensitivity than BAC technology. The coverage from oligonucleotide probes is much greater than BACs and can range from 44 K (44,000 probes) to 400 K (400,000 probes), allowing for much greater resolution. Companies that initially started with and provided oligonucleotide-only arrays have recently begun to add SNPs to their array for the detection of uniparental disomy (UPD) and consanguinity (see later discussion).5
As with the oligonucleotide arrays, there are numerous types of SNP arrays, all containing different numbers of probes. These arrays consist of two types of probes: nonpolymorphic copy number probes (CNP), used only for assessing copy number changes, and SNP probes, used for assessing both genotype and copy number changes. A SNP has a single base pair substitution (A, T, C, or G) of one nucleotide for another; however, this substitution is not considered a mutation.6 To be considered a SNP, the substitution must be found in the population at a frequency of greater than 1.0%, although the closer the frequency to 50% the more useful the SNP is in this analysis. SNPs may occur within the coding sequence of a gene, the noncoding regions of genes, or the intergenic regions between genes. The alleles corresponding to the nucleotide base changes are arbitrarily given the designation allele A and allele B. Both the SNP and nonpolymorphic probes (CNP) are approximately 25 base pairs. Two high-resolution SNP arrays are the Affymetrix 6.0 array and the Illumina HumanOmni 2.5 array.
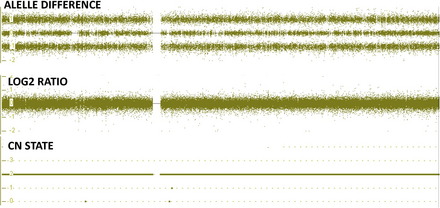
The SNP array analysis can be used to detect both copy number changes as well as copy neutral changes. This analysis is not a CGH technique, and a concurrent control DNA sample is not used. Patient DNA is labeled with a fluorochrome, and the intensity is compared with a set of reference DNA in silico to derive the intensity ratio of each SNP and CNP in the patient DNA, which will provide a relative copy number, the log2 ratio (Fig. 1). This ratio can be determined for both the CNPs and SNPs. Determination of this ratio will indicate if there is a gain or loss of genetic material.
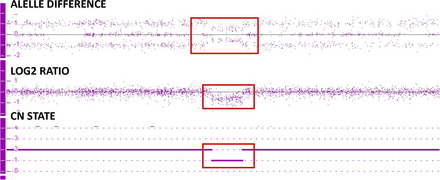
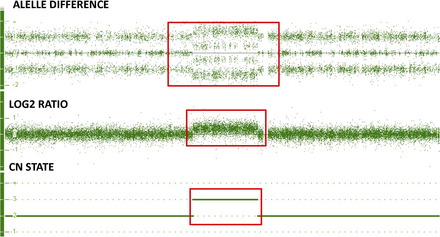
A second way to determine if there is a gain or loss of genetic material is by examining the genotype of the alleles of each SNP. See Fig. 1 showing the copy number state (CN state = 2), log2 ratio (= 0) and allele difference (showing the AA, AB and BB allele tracts for the three normal genotypes). This result indicates that this sample has a normal copy number. In contrast, Fig. 2 shows these same graphs for a deletion. All of the probes in the log2 ratio are centered on the −0.45 line indicating a deletion in this region, while at the same time the allele difference only shows two tracts instead of three. These two tracts are at 0.5 and −0.5, indicating the presence of a single A or B allele, again confirming the presence of a deletion of this region. Fig. 3 shows these same graphs for a duplication. All of the probes in the log2 ratio are centered on the 0.3 line, indicating a duplication in this region, while at the same time the allele difference shows four tracts instead of three. These four tracts are at 1.5, 0.5, −0.5, and −1.5, indicating the presence of an AAA, AAB, BBA, and BBB tract, again confirming the presence of a duplication of this region.
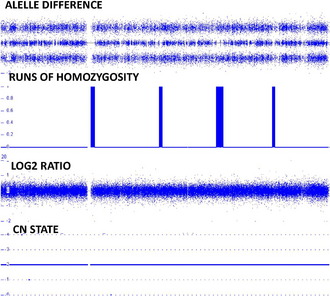
The genotyping will also allow detection of copy neutral changes. Fig. 4 shows normal findings with respect to the CN state and allele difference. In addition, this figure has a tract showing runs of homozygosity (ROH). These stretches can be detected when there is homozygosity of the SNPs in a 1 Mb stretch or greater of DNA. Based on examination of over 25,000 patients it is estimated that a normal individual will have between 20 and 150 Mb of homozygosity involving between 1 and 5 Mb of DNA in any stretch (data not shown). Based on a recent paper by Papenhausen and colleagues,7 these stretches become concerning when they are greater than 10 Mb in length. UPD is associated with one long contiguous stretch of homozygosity (LCSH) when greater than 8 Mb if telomeric and greater than 15 Mb if interstitial.7 Individuals from consanguineous unions have increased blocks of LCSH greater than 8 Mb. The more regions and chromosomes involved, the greater the consanguinity. The greater the consanguinity detected in the union, the greater the risk of recessive disease and birth defects.8 In addition, when parental and child specimens are run on the SNP array, the genotype generated will also allow for the detection of nonpaternity and parent of origin.
Clinical Applications and Overall Findings of the SNP Array Analysis
Constitutional Studies—Peripheral Blood, Copy Number Variation
The vast majority of array studies have involved an examination of constitutional postnatal bloods, looking in particular to determine the effectiveness of delineating gain or loss of material not detectable by standard cytogenetic methodology. This tendency is true for both CGH arrays as well as SNP arrays. Although the majority of studies for the detection of copy number variation have used oligonucleotide probes and CGH array, some SNP studies have been undertaken. McMullan and colleagues9 initiated a study to validate the Affymetrix 500K SNP array for routine diagnostic use in the evaluation of patients with mental retardation. This study consisted of two separate parts. First they performed a validation study on 38 patients previously shown to have submicroscopic copy number variations (CNVs). They then prospectively studied 120 patients with unexplained mental retardation. They were able to detect all 44 CNVs previously detected in the 38 patients and the study of trios (parents and affected proband) in the retrospective study. In the 120 prospective patients, both de novo and inherited CNVs were detected. The investigators concluded that their study validated the use of the Affymetrix 500K array for the detection of de novo CNVs of greater than 100 kb in patients with unexplained mental retardation.
Gijsbers and colleagues10 used several different commercially available SNP platforms (Affymetrix 262K NspI, Affymetrix 238K StyI, Illumina HumanHap300, and the Illumina HumanCNV370 BeadChip) to study CNVs in 318 patients with unexplained mental retardation and/or multiple congenital anomalies. They found abnormalities in 22.6% of patients, including CNVs (14 patients with pathogenic syndromes and 63 with potentially pathogenic alterations), large segments of homozygosity (4 patients), and mosaic trisomies for an entire chromosome (2 patients). With these studies they demonstrated that the high-density SNP array analysis has the ability to detect not only CNVs but also mosaicism, uniparental disomies, and loss of heterozygosity, all in the same experiment. Based on the findings from their study they proposed that all mental retardation/multiple congenital anomaly patients be initially analyzed by SNP array analysis rather than by conventional karyotyping, which will ultimately lead to an improvement in medical care and genetic counseling.
Bruno and colleagues11 studied 117 patients with unexplained mental retardation and/or multiple congenital anomalies using an Affymetrix 250K NspI array. The goal of their study was to replace locus-specific testing for specific microdeletion/duplication syndromes with microarray analysis. They were able to identify 18 pathogenic and 9 “potentially pathogenic” abnormalities with the array technology. Almost all of the pathogenic CNVs were larger than 500 kb. The investigators additionally found ROH larger than 5 Mb in 5 patients. They concluded from these studies that microarray analysis has improved diagnostic success; in addition, they were able to detect newly discovered syndromes and suggested that these changes were more common than previously suspected.
Friedman and colleagues,12 in order to study the effectiveness of the 500K Affymetrix GeneChip, analyzed 154 children with idiopathic intellectual disabilities and their parents (trios). Fifty-four of these patients were previously studied by a 100K array, and 100 of the patients were analyzed for the first time by the 500K array analysis. In the previously studied patient group, all CNVs diagnosed by the 100K were confirmed; however, at least one additional pathogenic abnormality was delineated. Pathogenic abnormalities were found in 11 of the 100 newly studied patients. As with those previously studied, these findings continue to highlight the effectiveness of SNP array analysis and indicate how array analysis is being established as the primary clinical tool in the recognition of genomic imbalance that causes intellectual disabilities and other birth defects.
More recently, Bernardini and colleagues13 used the Affymetrix 6.0 SNP array to study 70 patients with mental retardation with/without dysmorphic features who had been previously studied on lower density arrays. The investigators demonstrated that this platform increased the ability to detect small CNVs and that they were able to detect 6 additional changes not seen in the Agilent 44K analysis. Of these 6 CNV changes detected, 3 were thought to be pathogenic.
Stay updated, free articles. Join our Telegram channel

Full access? Get Clinical Tree


