Tumor Growth, Microenvironment, and Metabolism
12.1 TUMOR GROWTH AND CELL KINETICS
Tumors grow because the homeostatic mechanisms that maintain the appropriate number of cells in normal tissues are defective, leading to an imbalance between cell proliferation and cell death and to expansion of the cell population. The use of autoradiography with tritiated thymidine in the 1950s and 1960s, and the subsequent application of flow cytometry, have allowed a detailed analysis of tumor growth in terms of the kinetics of proliferation of the constituent cells. The proliferative rate of tumor cells varies widely between tumors; slowly proliferating or nonproliferating cells are common, and there is often a high rate of cell death. Several normal tissues, including bone marrow and intestine, contain cells with high rates of proliferation, and damage to these cells is often dose-limiting for chemotherapy. The rate of cell proliferation in tumors may be an important factor in determining prognosis and response to therapy.
12.1.1 Growth of Human Tumors
Because tumors are generally treated rather than observed, most of the data on growth rates of untreated human cancers are from studies that were undertaken prior to the development of more effective therapies. Accurate measurements could be made only on tumors from selected sites, and most studies have examined lung metastases using serial chest radiographs. There have been only a few reported measurements of the growth of untreated primary tumors (which generally were removed by operation or irradiated). Because there is a limited observation period between the time of tumor detection and either death of the host or initiation of therapy, such measurements represent only a small fraction of the history of the tumor’s growth (see Fig. 12–1). Despite these limitations, Steel (1977) was able to review measurements of the rate of growth of more than 600 human tumors, and a few general conclusions may be stated:
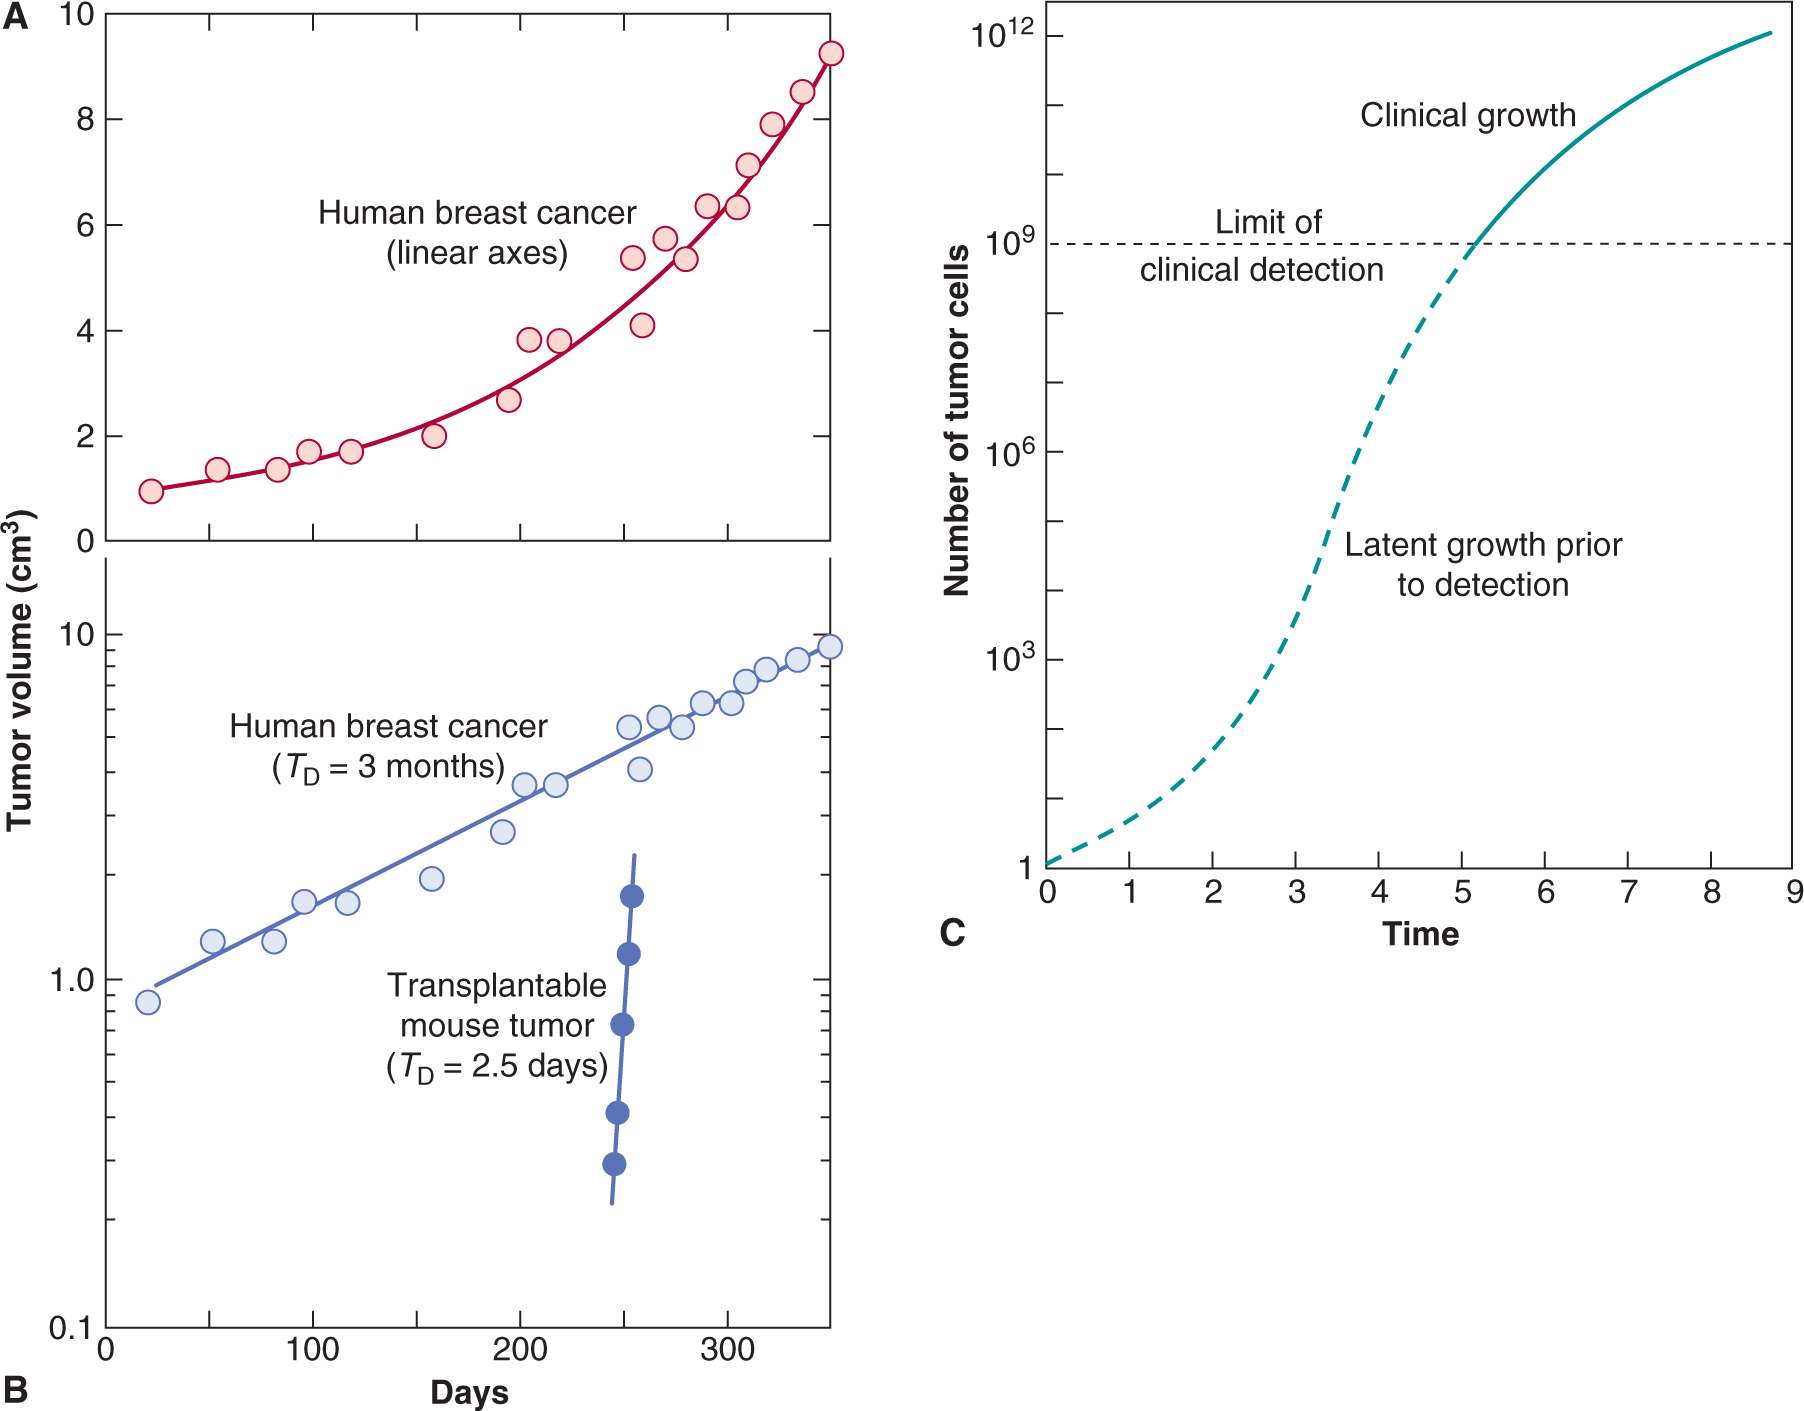
FIGURE 12–1 A) Growth rate of a human breast cancer using linear axes. B) Growth of the same tumor using a logarithmic scale for tumor volume. C) Hypothetical growth curve indicating initial latency and later slowing of tumor growth.
1. There is wide variation in growth rate, even among tumors of the same histological type and site of origin.
2. Childhood tumors and adult tumors that are known to be responsive to chemotherapy (eg, lymphoma, cancer of the testis) tend to grow more rapidly than less-responsive tumors.
3. Lung metastases tend to grow more rapidly than the primary tumor in the same patient.
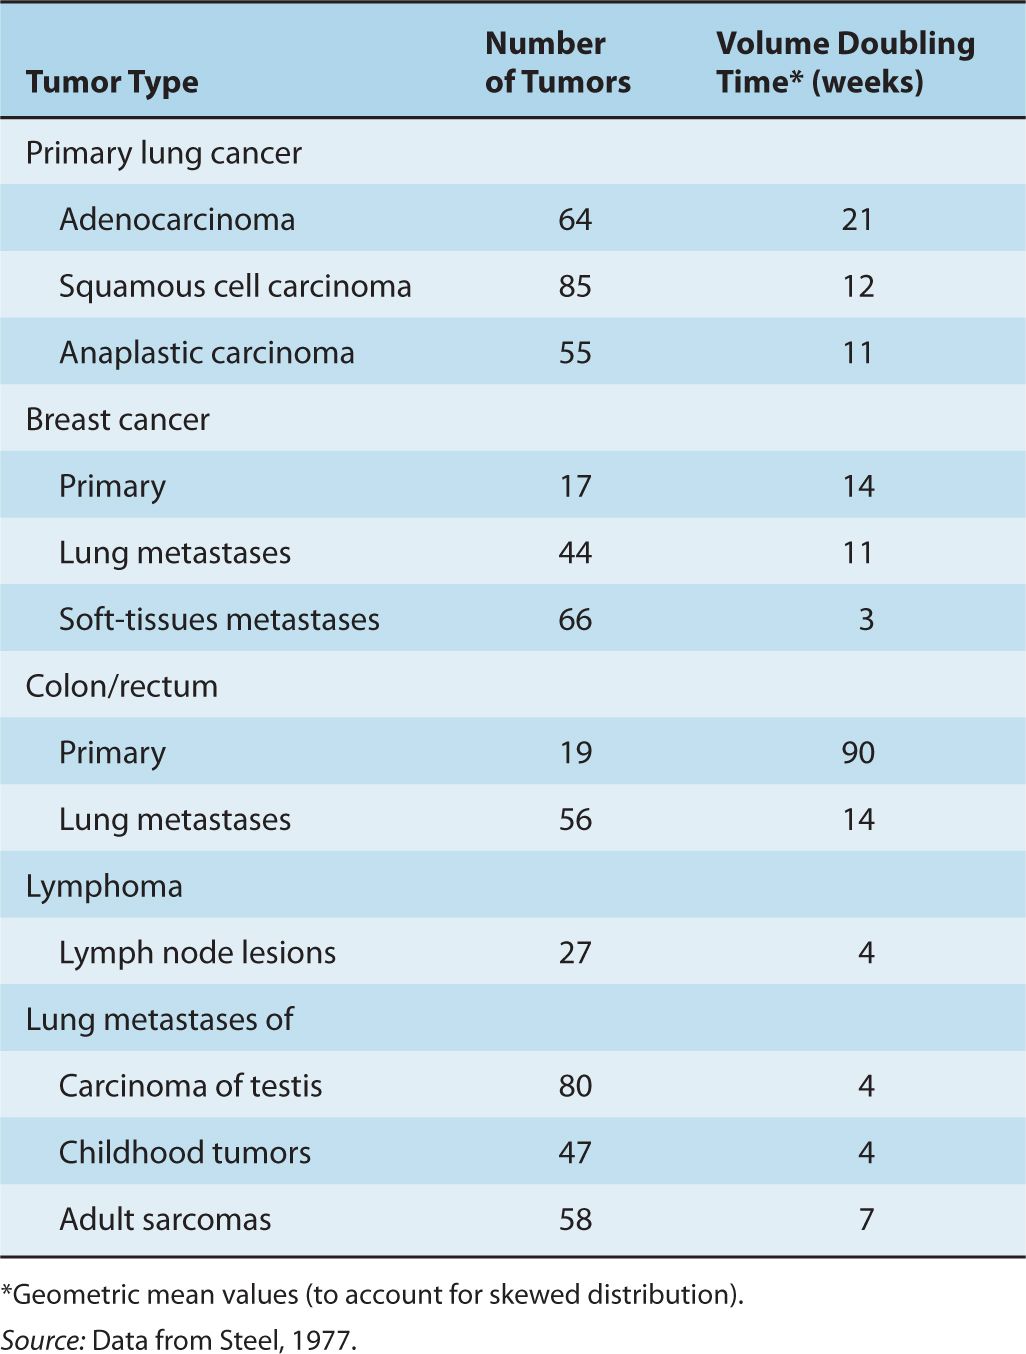
4. Over the period of observation, the time for the tumor volume to double was often constant, implying exponential growth. Doubling times for lung metastases of common tumors in humans were in the range of 2 to 3 months; Table 12–1 summarizes the doubling times for various types of cancer.
TABLE 12–1 Volume doubling time (TD) for representative human tumors.
Exponential growth of tumors will occur if the rates of cell production and of cell loss or death are proportional to the number of cells present in the population. Exponential growth often leads to the false impression that tumor growth is accelerating with time (see Fig. 12–1). Increase in the diameter of a human tumor from 0.5 to 1.0 cm may escape detection, whereas an increase from 5 to 10 cm is dramatic and is likely to cause new clinical symptoms. Both require 3 volume doublings; during exponential growth they will occur over the same period of time.
Many internal tumors are unlikely to be detected until they grow to approximately 0.5 to 1.0 g (~10 to 13 mm in diameter), and tumors of this size will contain approximately 500 to 1000 million (0.5 to 1.0 × 10⁹) cells. There is indirect evidence that many tumors arise from a single cell (see Sec. 12.1.3), and a tumor containing approximately 109 cells will have undergone approximately 30 doublings in volume prior to clinical detection (because of cell loss, this will involve more than 30 consecutive divisions of the initial cell). After 10 further doublings in volume, the tumor would weigh approximately 1 kg (1012 cells), a size that may be lethal to the host. Thus, the range of size over which a tumor is detectable clinically represents a rather short and late part of its total growth history (Fig. 12–2). There is evidence (eg, for breast cancer) that the probability of seeding of metastases increases with the size of the primary tumor, but the long preclinical history of the tumor may allow cells to metastasize prior to detection. Thus “early” clinical detection may be expected to reduce, but not to prevent, the subsequent appearance of metastases.
FIGURE 12–2 A human solid tumor must undergo approximately 30 to 33 doublings in volume from a single cell before it achieves a detectable size at a weight of 1 to 10 g. Metastases may have been established prior to detection of the primary tumor. Only a few further doublings of volume lead to a tumor whose size is incompatible with life. (Adapted from Tannock, 1983.)
The growth rate of a human tumor in its preclinical phase can only be estimated indirectly or inferred from observations of spontaneous or induced tumors in animals. Tumor growth may be slow at very early stages of development when tumor cells may have to overcome immunological and other host defense mechanisms, and induce proliferation of blood vessels to support them (see Chap. 11, Sec. 11.5). Deceleration of growth of large tumors is also observed, probably as a result of increasing cell death and decreasing cell proliferation as tumor nutrition deteriorates (see Sec. 12.1.4). Also, tumors often contain a high proportion of nonmalignant cells, such as macrophages, lymphocytes, and fibroblasts, and the proliferation and migration of these cells will influence changes in tumor volume.
12.1.2 Cell-Cycle Analysis
As discussed in Chapter 9, Section 9.2.1, the cell cycle is divided into a short mitotic (M) phase that can be recognized morphologically, a subsequent variable G1 (G = Gap) phase, a discrete period of DNA synthesis (or S-phase), and a G2-phase that precedes mitosis. Much of the information about the duration of phases of the cell cycle in tumors and normal tissues was derived by using autoradiography to detect the selective uptake of radioactive (3H or 14C) thymidine during the S-phase of the cell cycle, although these methods have now been supplanted by automated techniques based on flow cytometry. The proportion of thymidine-labeled cells at a short interval after administration of tritiated (3H) thymidine (the labeling index) is a measure of the proportion of cells that were in S-phase (3H-thymidine has a short half-life in the circulation). In the percent-labeled-mitoses (PLM) method, serial biopsies (or serial specimens from identical animals) are taken at intervals after a single injection of 3H-thymidine, and the proportion of mitotic cells that are radiolabeled is estimated from autoradiographs prepared from these biopsies. Time-dependent changes in this proportion can provide estimates of the duration of phases of the cell cycle (see Steel, 1977, for details). Although this method is labor intensive, it has provided most of the available estimates of the duration of the different cell-cycle phases in human tumors and normal tissues. The PLM method and other techniques for estimating duration of cell-cycle phases, which are described below, tend to give information about the faster proliferating cells in the population, and are insensitive to the presence of more slowly proliferating cells.
Flow cytometry is a method that separates and sorts cells based on cellular fluorescence. Cells can be tagged with fluorescent markers (eg, monoclonal antibodies) to a wide range of molecules, including cell-surface receptors, molecules involved in signaling pathways, and proteins that are expressed in different phases of the cell cycle. Several fluorescent dyes (eg, propidium iodide, ethidium bromide, mithramycin, and Hoechst 33342) bind to DNA in proportion to DNA content. Cells are then directed in single file through a laser beam to excite the dye, and the fluorescence emission is collected and displayed as a DNA distribution (Fig. 12–3A); cells can also be sorted on the basis of their fluorescence intensity. Minimally toxic agents, such as 5-bromodeoxyuridine (BrdUrd) or 5-ethynyl-2′-deoxyuridine (EdU), can be incorporated into newly synthesized DNA (like tritiated thymidine) and recognized by fluorescent-tagged antibodies. Analysis of the distribution of uptake of these precursors in relation to DNA content (Fig. 12–3B) can then provide estimates of the proportion of cells with 2N DNA content (ie, G1 and most nonproliferating cells), 4N DNA content (G2 and mitotic cells), and intermediate DNA content (S-phase cells), while time-dependent changes in these distributions can provide estimates of cell cycle phase duration (Darzynkiewicz et al, 2011). Many tumors are aneuploid (ie, the content of DNA in G1-phase tumor cells differs from that of normal cells) allowing separation of tumor cells and normal cells within the tumor. Some proteins (eg, the nuclear protein Ki-67) appear to be expressed uniquely in cycling cells and can be recognized by fluorescent-labeled antibodies. Fluorescent-tagged monoclonal antibodies that recognize cyclins and other molecules involved in cell-cycle regulation can also be used to determine their expression at different times during the mitotic cycle (see Chap. 9, Sec. 9.2.3), and expression of cell cycle-dependent molecules in human tumor cells can be related to prognosis (see Sec. 12.1.5).
FIGURE 12–3 A) DNA distribution for a human bladder cancer cell line produced by flow cytometry. Cells were stained with acridine orange. The peak at the origin represents cellular debris. B) Use of flow cytometry to sort HL-60 cells on the basis of their uptake of bromodeoxyuridine (BrdUrd) (recognized by an antibody tagged to fluorescein isothiocyanate [FITC]) in relation to DNA content; cells in different cell-cycle phases are indicated. (Adapted from Darzynkiewicz et al, 2011.)
In most normal tissues of the adult, only a small proportion of the cells are actively proliferating. The remaining cells have either lost their capacity for proliferation through differentiation, or are G0 cells that can proliferate in response to an appropriate stimulus. Examples of the latter include stem cells in the bone marrow (see Sec. 12.1.4) and cells in skin that participate in wound healing. Most tumors also contain slowly proliferating or nonproliferating cells, and the term growth fraction describes the proportion of cells in the tumor population that is proliferating—or, more accurately, those that are rapidly proliferating—as available techniques do not separate truly nonproliferating cells from those that are cycling at a rate slower than the mean. Proliferating cells in tumors can be recognized using cytometry with an antibody against Ki-67, as described above. Most anticancer drugs are more toxic to rapidly proliferating cells (see Chap. 17, Sec. 17.5) and the growth fraction (Ki-67–positive cells) therefore indicates the proportion of tumor cells that might be sensitive to cycle-dependent chemotherapy.
The overall rate of cell production can be estimated from the growth fraction and the median length of the cell cycle (Tc), but since the value of Tc is often unknown, it is easier to estimate this from the proportion of S-phase cells (obtained by flow cytometry or from the labeling index) and the length of S-phase (Ts) with an added constant (λ) to account for the relative position of S-phase in the cell cycle. This parameter is usually called the potential doubling time of the tumor (Tpot = λTs/LI) and is the expected doubling time of the tumor in the absence of cell loss. However, the frequent occurrence of necrosis and of apoptotic cells in tumors and the ability of tumor cells to metastasize from a primary tumor indicates that there is considerable cell death or loss from many tumors. Thus the value of Tpot is usually much shorter than the measured volume doubling time (VD) because of this cell loss (Steel, 1977). The fractional rate of cell loss from tumors can be estimated by comparing Tpot with the VD (Fractional cell loss = 1- Tpot/VD).
12.1.3 Cell Proliferation in Normal Tissues
Thymidine labeling and flow cytometry have been used to compare the overall rate of cell proliferation in a variety of normal tissues (Table 12–2). The side effects of chemotherapy that are common to many drugs (eg, myelosuppression, mucositis, hair loss, and sterility) are observed in rapidly proliferating tissues, reflecting the greater activity of most anticancer drugs against rapidly proliferating cells (see Chap. 17, Sec. 17.5). Acute effects of radiation injury are also observed in these tissues, because irradiated cells often die when they attempt mitosis (see Chap. 16, Sec. 16.5). The proliferation and differentiation of hemopoietic cells in the bone marrow and epithelial cells in the intestine are described below as examples of renewal tissues in which the pattern of cell proliferation is an important determinant of anticancer therapy.
TABLE 12–2 Proliferative rates of selected normal tissues in adults.
12.1.3.1 Bone Marrow Morphologically recognizable cells in bone marrow and blood have an orderly progression of differentiation from myeloblasts to polymorphonuclear granulocytes, from pronormoblasts to red blood cells, and from megakaryocytes to platelets (see Chap. 17, Fig. 17–10). The earlier bone marrow precursor cells cannot be recognized morphologically, but can be enriched by flow cytometry using fluorescent markers to antigens that are expressed selectively on their surface such as CD34 (Doulatov et al, 2010). The hematopoietic stem cell may undergo self-renewal or may produce progeny that are early precursor cells, which proliferate and differentiate to produce cells of the granulocyte (G), erythroid (E), megakaryocyte (Meg), monocyte (M), and lymphoid (L) lineages (see Chap. 17, Fig. 17–10). Older thymidine-labeling studies demonstrated a very high rate of cell proliferation among recognizable precursors of granulocytes and red cells; these are among the most rapidly proliferating cells in the human body, with a mean duration of Ts and Tc of approximately 12 and 24 hours, respectively. The more mature cells in each series undergo differentiation without proliferation. Stem cells and other early precursor cells proliferate quite slowly under resting conditions, but may proliferate rapidly to restore the bone marrow population following depletion of more mature functional cells (eg, by cancer chemotherapy) or after bone marrow ablation and transplantation.
The pattern of proliferation and differentiation in the bone marrow provides an explanation for the decrease in mature granulocytes at 10 to 14 days after cycle-active chemotherapy and their recovery by 21 to 28 days (see Chap. 17, Fig. 17–10). The rapidly proliferating intermediate precursor cells are most likely to be killed by chemotherapy. Effects on granulocytes and other normal cells in the peripheral blood are not seen immediately because the later maturing cells are nonproliferating. Recovery of the bone marrow occurs when earlier precursors are stimulated to proliferate, following release of growth factors that follows loss of the mature functional cells.
The growth factors that stimulate hemopoietic precursor cells to proliferate and differentiate into lineage-specific cells have been characterized, and several of them are now produced by recombinant techniques for clinical use. Granulocyte colony-stimulating factor (G-CSF) stimulates early cells in the granulocyte series and is used widely to decrease the duration and extent of myelosuppression after chemotherapy, and hence to lower the incidence of infection and hospitalization. Erythropoietin is produced by the kidney to stimulate erythroid cell precursors; recombinant erythropoietin and molecules derived from it (erythroid-stimulating factors) are used to treat anemia and accompanying fatigue, and to decrease the need for blood transfusion, but can be associated with increased blood clotting. Thrombopoietin stimulates the maturation of megakaryocytes and production of platelets to guard against bleeding. Clinical trials have been undertaken with recombinant thrombopoietin and derived agents in attempts to treat primary thrombocytopenia and to prevent thrombocytopenia (ie, a low platelet count and consequent bleeding) following chemotherapy, but the presence of neutralizing antibodies and other problems have limited their clinical utility (Vadhan-Raj, 2010).
12.1.3.2 Intestine The functional part of the small intestine consists of numerous villi that project into the lumen and provide a large absorptive surface (Fig. 12–4). The villi are lined by a single layer of differentiated epithelial cells that do not proliferate, and apoptotic cell death (see Chap. 9, Sec. 9.4) and shedding of cells into the lumen occur at the top of the villi. These cells are replaced by upward migration of cells lining crypts, which lie between and at the base of the villi. There is a high rate of cell proliferation in the crypts of the intestine, but proliferation of cells at the base of the crypts occurs more slowly (Fig. 12–4) and some of these cells act as progenitors or intestinal stem cells for the entire crypt and surrounding villi. Analogous to bone marrow, proliferation of stem cells in the crypts is influenced by paracrine and autocrine signaling factors (Walters, 2005). Some cycle-dependent drugs and radiation may cause severe mucosal damage to the intestine, resulting in diarrhea and/or intestinal bleeding, although this toxicity is less often dose-limiting for anticancer drugs than toxicity to the bone marrow.
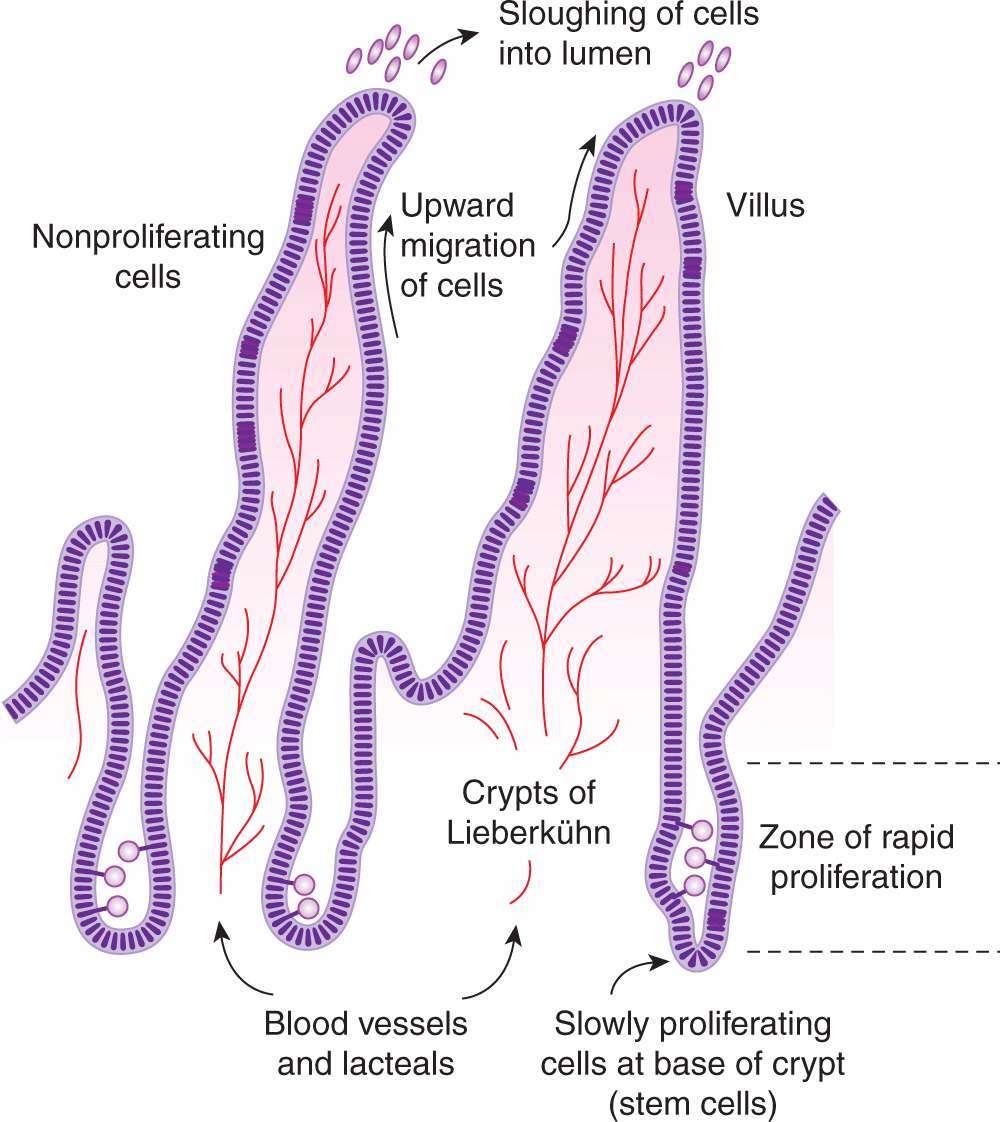
FIGURE 12–4 Model for cell proliferation and migration in the small intestine. Slowly proliferating cells in the bases of the crypts probably act as stem cells for the entire cell population. Other cells in the lower two-thirds of the crypts proliferate rapidly, with nuclei of mitotic cells visible in the lumens of the crypts. Cells migrate up the villi to replace those sloughed into the lumen.
12.1.4 Cell Proliferation in Tumors
Typical values for the percent of S-phase cells (labeling index) are in the range of 3% to 15% for many types of human solid tumors, but higher values are evident in faster-growing malignancies, including acute leukemia and some lymphomas. However, the rate of cell proliferation is usually less than that of some cells in normal renewing tissues such as the intestine or bone marrow. Thus, growth of tumors is not simply the result of an increased rate of cell proliferation as compared to the normal tissue of origin. Rather, there is defective maturation and the population of malignant cells increases because the rate of cell production exceeds the rate of cell death or removal (loss) from the population.
Information about the duration of the cell cycle and of its constituent phases in human tumors is available from a few early studies in which 3H-thymidine was injected into patients and where serial biopsies allowed the generation of a PLM curve. A larger number of estimates of the duration of Ts and of Tpot have been derived after injection of BrdUrd, followed by a tumor biopsy and analysis by flow cytometry. The distributions of these estimates tend to be lognormally distributed but mrsn values for Ts tend to be in the range of 12 to 24 hours. Typical values of mean Tc are in the range of 2 to 3 days, but this estimate is subject to uncertainty because the distribution of cell-cycle times is broad, and the techniques used to measure it tend to give information about the faster proliferating cells in the population. Estimates of the Tpot range from approximately 4.5 to approximately 20 days, and are much longer than estimates of mean Tc, implying that many human tumors have a low growth fraction. If some of the slowly proliferating or nonproliferating cells in human tumors retain the properties of a tumor stem cell (ie, they can repopulate the tumor if stimulated to divide; see Chap. 13, Sec. 13.4), a low growth fraction may be a factor that contributes to the relative resistance of human tumors to cycle-active chemotherapy. Estimates of mean values of Tpot are, in turn, much lower than estimates of VD for common human tumors (typically 2 to 3 months; see Table 12–1). It follows that the rate of cell loss in many human tumors is in the range of 75% to 90% of the rate of cell production.
Studies of human and animal tumors demonstrate considerable heterogeneity in labeling and mitotic indices within different parts of the same tumor or its metastases. Factors that may contributes to this heterogeneity include differentiation, as there is often an inverse relationship between differentiation and proliferative rate, the presence of genetically distinct clones of cells in a mature tumor (Marusyk et al, 2012), and variability in nutrient availability within the tumor microenvironment (see Sec. 12.2; see also Chap. 13, Sec. 13.2). Necrosis occurs commonly in solid tumors, and orderly structures (“tumor cords”) can sometimes be observed in which a tumor blood vessel and tumor necrosis are separated by a distance that in humans is commonly about 150 to 200 μm. This is estimated to be the approximate distance oxygen can diffuse in tissue before being completely metabolized by the cells in the tissue (Figs. 12–5 and 12–6; Thomlinson and Gray, 1955). The presence of such structures facilitated older studies of cell proliferation in relation to the blood supply. This relationship can now be evaluated by quantifying the proportion of Ki-67– or BrdUrd-labeled–positive cells in relation to blood vessels, recognized by an antibody to CD31, which is expressed on endothelial cells, using computer techniques and immunohistochemistry (Huxham et al, 2004). Not surprisingly, well-nourished tumor cells close to blood vessels have higher levels of rapidly proliferating cells than poorly nourished cells close to a region of necrosis (see Figs. 12–5 and 12–6; eg, Tannock, 1970; Huxham et al, 2004). The presence of slowly proliferating cells at a distance from functional blood vessels has implications for tumor therapy: Such cells may be resistant to radiation because of hypoxia (see Sec. 12.2.1 and Chap. 16, Sec. 16.4), and to anticancer drugs because of their low proliferative rate (see Chap. 17, Sec. 17.5) and limited drug access (see Chap. 19, Sec. 19.3.3). This is a major concern if such cells are also more likely to be tumor stem cells (see Chap. 13, Sec. 13.4).
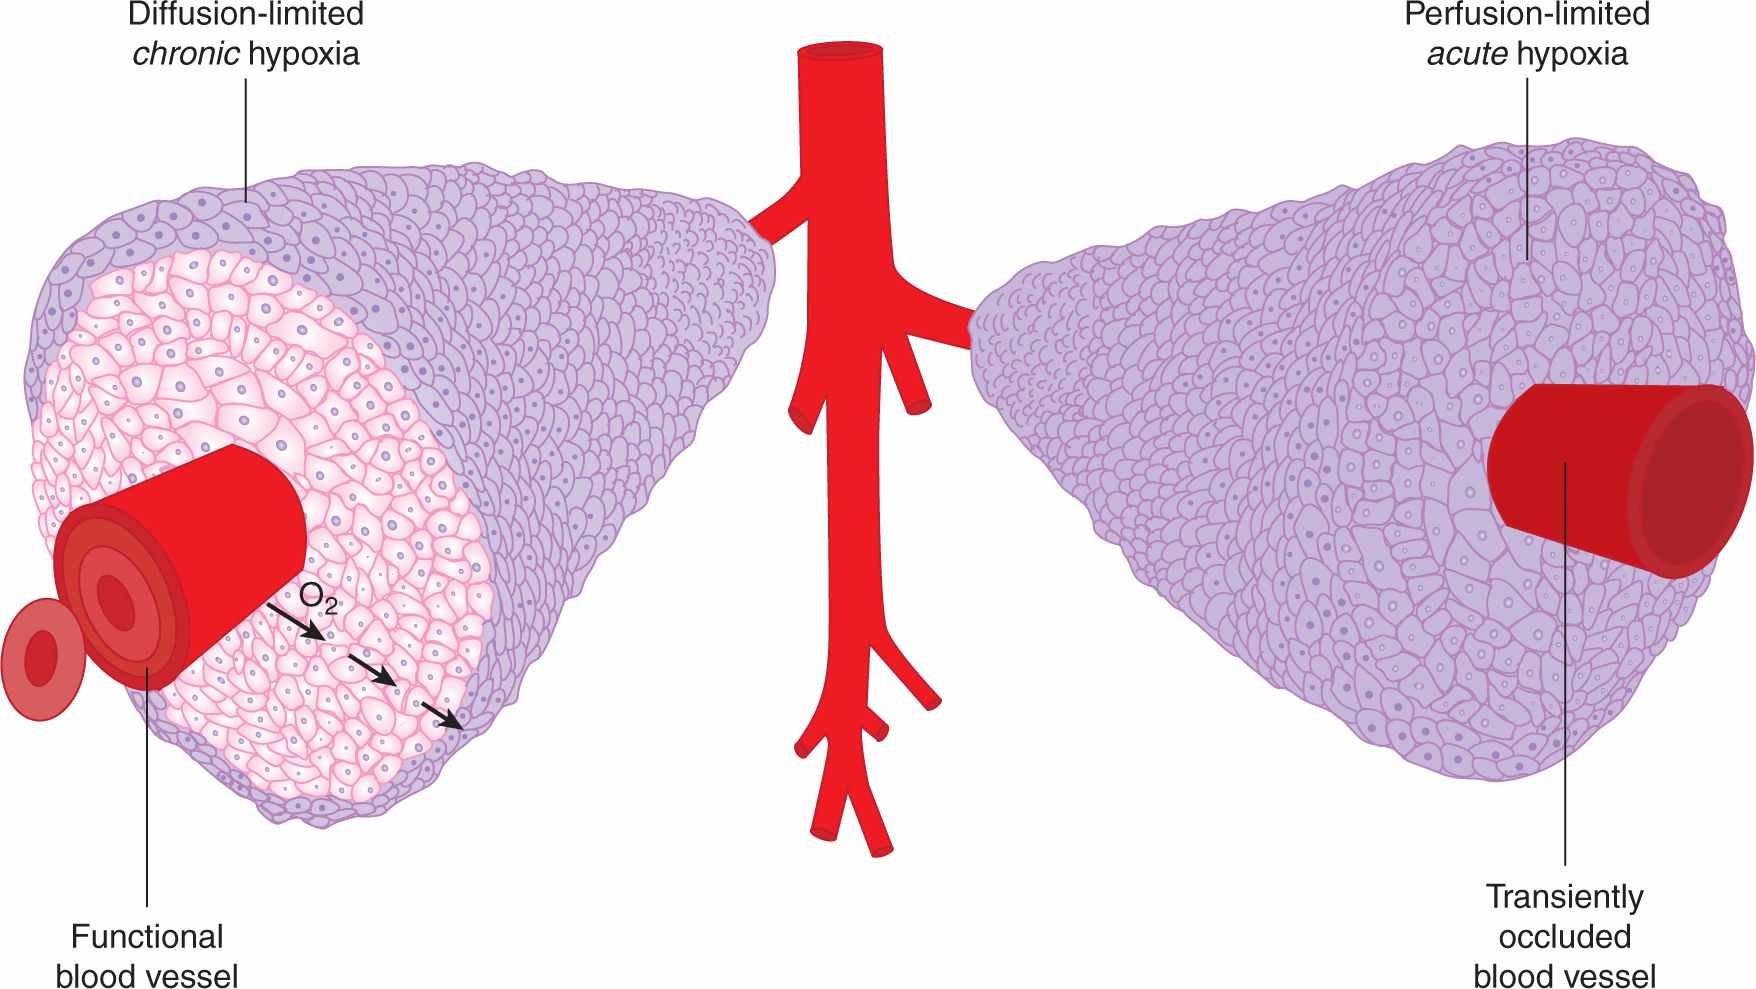
FIGURE 12–5 Mechanisms leading to hypoxia in solid tumors. Left: Oxygen metabolism (consumption) results in the establishment of oxygen gradients around isolated perfused vessels. Oxygenation values range from 4% to 5% near the vessel wall to complete anoxia. Right: Changes in blood perfusion, including complete vessel occlusion, result in acute changes in oxygenation in large numbers of tumor cells.
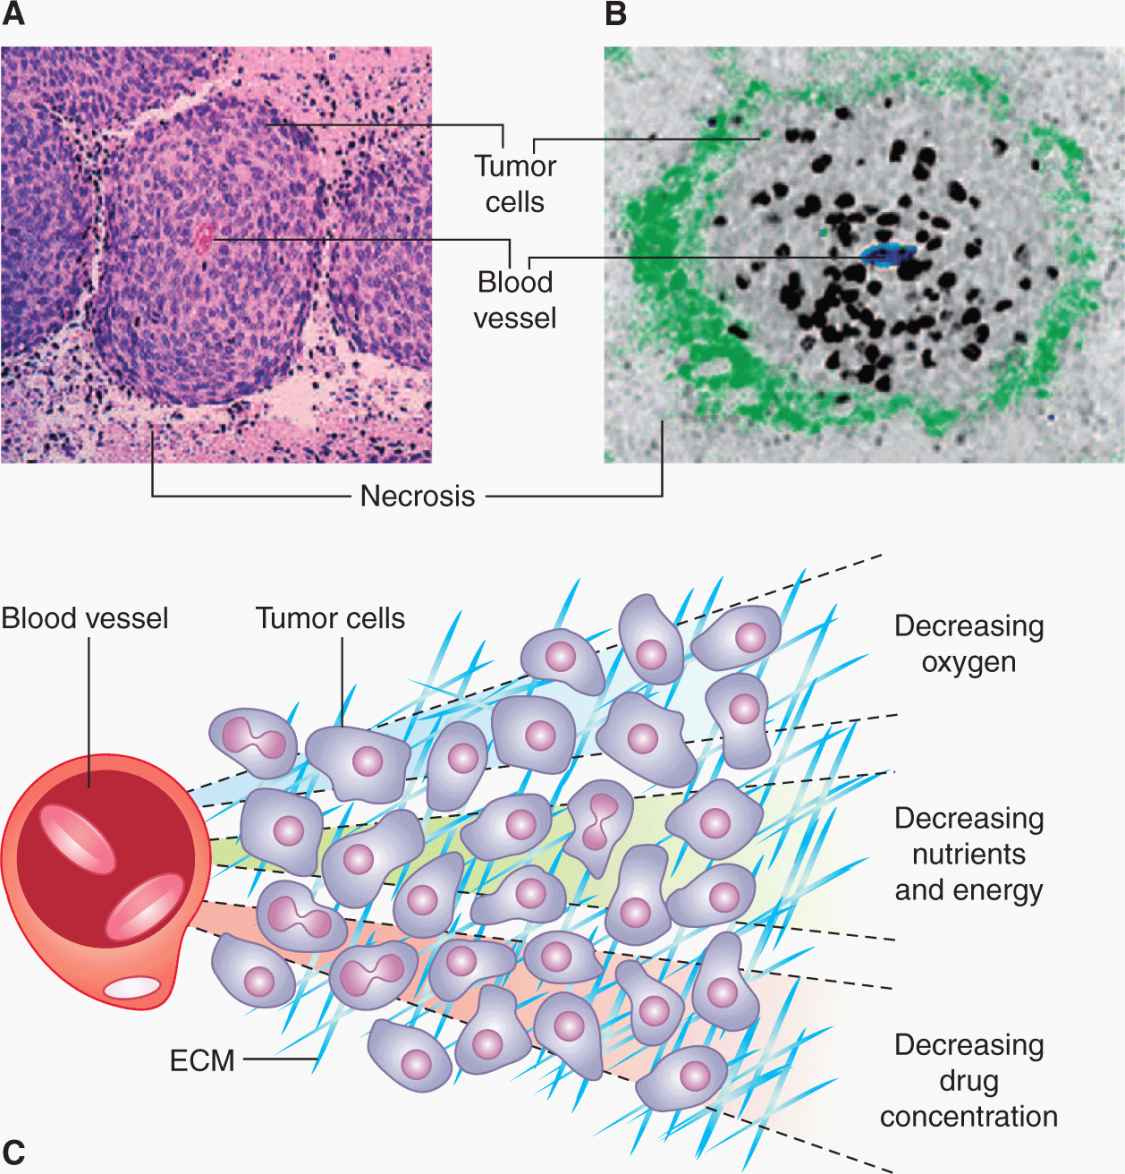
FIGURE 12–6 A) Viable cells surrounding a tumor blood vessel. B) Relation between frequency of Ki-67–positive (black) proliferating cells and distance from tumor blood vessels recognized by an antibody to CD31 in an experimental tumor. C) Diffusion gradients of oxygen and other metabolites in solid tumors. (Reproduced from Minchinton and Tannock, 2006, with permission.)
Because cell proliferation and cell death in tumors depend on a supply of nutrients through the vasculature, the rate of tumor growth is likely to depend on the rate of expansion of functional tumor blood vessels by angiogenesis (see Chap. 11, Sec. 11.5). In experimental animals, the proliferation rate of capillary endothelial cells appears to be slower than that of surrounding tumor cells (Denekamp and Hobson, 1982), which may lead to decreasing tumor vasculature and slowing of growth in larger tumors.
Renewal tissues such as bone marrow and intestinal mucosa represent a hierarchy of cells produced by cell division and differentiation from a small number of stem cells (see Sec. 12.1.3). Most tumors arise in renewal tissues, and there is substantial evidence that many tumors are (a) clonal, in that all of the tumor cells express a common genetic marker (Fearon et al, 1987; Fialkow, 1974), and (b) contain a limited population of stem cells with the capacity to regenerate the tumor after treatment (see Chap. 13, Sec. 13.4). Other cells in the tumor population may have lost the capacity for cell proliferation (eg, through differentiation) or have only limited potential for cell proliferation (analogous to morphologically recognizable precursor cells in bone marrow, such as myelocytes). Proliferative potential and proliferative rate are quite different, and tumor cells with stem cell properties might be proliferating rather slowly, similar to stem cells in bone marrow or at the base of the intestinal crypts (see Sec. 12.1.3).
12.1.5 Cell Proliferation and Prognosis
The relationship between proliferative parameters and response to treatment with chemotherapy is complex. There may be a higher chance of response to chemotherapy in malignancies with a high proportion of proliferating cells, although intrinsic drug sensitivity of the cells is likely to be the major determinant of response. In contrast, malignancies with a high proportion of proliferating cells grow more rapidly both in the absence of effective treatment and during regrowth after partially effective therapy. A further confounding factor arises because analysis of DNA distributions does not provide information about the proliferative status of the cells that are able to regenerate the tumor, the putative tumor stem cells.
A technique for dissolving paraffin, followed by dispersion and staining of the cells, has allowed flow cytometry to be applied to the study of fixed tissue that is stored in paraffin blocks. Provided that attention is paid to quality control, this technique can provide a useful retrospective analysis of the relationship between kinetic parameters of human tumors and the subsequent outcome of the patients (Hedley et al, 1993).
Multiple studies of the relationship between cell-cycle parameters and outcome for several types of tumor have been done. In many studies, both DNA index (ie, the DNA content of G1 tumor cells relative to that of normal cells) and S-phase fraction give prognostic information that is additional to the traditional prognostic factors of tumor stage and grade. In general, aneuploid tumors have a poorer prognosis than diploid tumors, and tumors with a higher proportion of proliferating cells have a poorer prognosis than tumors with a lower proportion of proliferating cells (eg, Hedley et al, 1993). The expression within tumors of cyclins, cyclin-dependent kinases (CDKs) and their inhibitors (see Chap. 9, Sec. 9.2.3) have also been reported to influence outcome, with the general, but not universal, finding that upregulation of positive regulators of the cell cycle (ie, cyclins and CDKs) are associated with poorer outcome, whereas upregulation of inhibitors is associated with better outcome (eg, Tsilhias et al, 1999; Keyomarsi et al, 2002).
12.2 TUMOR MICROENVIRONMENT
The microenvironment of solid human tumors is unlike that of normal tissues, as it is characterized by extreme heterogeneity in availability of oxygen and other nutrients, in patterns of metabolism, and in pH. The loss of normal homeostatic mechanisms uncouples cellular proliferation from growth signals and as a consequence, areas within the tumor become deficient in oxygen and other nutrients.
12.2.1 Hypoxia and Its Biological and Therapeutic Relevance
Oxygen is particularly important in solid tumors given its ability to influence metabolism, gene expression, and response to therapy. Oxygen is supplied through the vasculature, and is metabolized in the mitochondria by respiring cells, where it serves as a terminal electron acceptor during oxidative phosphorylation. The consumption of oxygen in this process establishes the oxygen demand of a given tissue, and in most tissues this demand is adequately met by the supply of oxygen through the local vasculature. The oxygen concentration of most normal tissues is maintained at around 50 to 70 μM, which is the equivalent of exposure to 5% to 7% O2 in the gas phase or a partial pressure (pO2) of 40 to 50 mm Hg. Note that even for normal tissues, this level of oxygenation is considerably lower than that in the normal atmosphere (~21% O2). In various physiological and pathological situations, the oxygen concentration can fall, and when it drops to levels equivalent to 3% or below, cells within the tissue will activate oxygen-sensitive signaling pathways to allow adaptation of the cell and the tissue to oxygen deprivation. In tumors, the vasculature is often insufficient to meet the oxygen demand of rapidly proliferating cells, giving rise to oxygen gradients surrounding isolated tumor vessels. Estimates of the oxygen diffusion distance from an individual vessel range from 75 to 200 μm depending on the respiration rate (oxygen consumption rate) of the cells within the tissue in question and the equivalent pO2 of the blood.
Hypoxia occurs when the oxygen demand exceeds oxygen supply. In tumors, this situation arises through 2 mechanisms, both of which are linked to the abnormal vasculature that characterizes many tumors. In the first mechanism, the rapid proliferation of tumor cells coupled with their reduced ability to suppress proliferation when nutrients are limiting leads to a situation of nonequilibrium in which the developing vasculature is unable to keep pace with the requirements of the expanding tumor. The lack of sufficient blood vessels creates gradients of oxygen around vessels, and at distances greater than approximately 100 μm gives rise to diffusion limited or “chronic” hypoxia (see Fig. 12–5). Similar gradients in other vascular-supplied molecules that are metabolized as they diffuse through tissue, including chemotherapeutic agents, will also occur. Chronic hypoxia can also arise in nonvascularized tumor nodules, again at distances dictated by the oxygen consumption rate. Chronic hypoxia was hypothesized to exist in tumors as early as 1955 by Thomlinson and Gray (1955) based on histological examination of human tumors. These authors noted that tissue necrosis was often observed at distances from vasculature consistent with the oxygen diffusion distance.
A second mechanism for development of tumor hypoxia occurs through transient changes in blood perfusion within tumor vasculature (see Figs. 12–5 and 12–6). Tumor vessels are often immature, leaky, lack smooth muscle cells, and have structural abnormalities, including blind ends and arterial–venous shunts that together result in unstable blood flow (see Chap. 11, Sec. 11.5 and Fig. 11–9); this can lead to “acute” or “perfusion-limited” hypoxia (Dewhirst et al, 2008; Pries et al, 2010). Regional tumor oxygenation can vary because of transient changes in blood flow that occur over periods ranging from 15 minutes to several hours. Complete vessel occlusion can result in rapid induction of hypoxia in all of the tumor cells that depend on that particular vessel for oxygen supply. As discussed below, the consequences of these 2 different mechanisms for generation of hypoxic cells in tumors can be very different from the perspective of both biology and therapy.
There is substantial heterogeneity of oxygenation and other microenvironmental factors in human cancer. This heterogeneity, although expected given the known causes of hypoxia, was only fully recognized when techniques became available to measure oxygenation in human tumors with needle electrodes and with exogenously administered markers of hypoxia that could be detected by immunohistochemistry (see also Chap. 16, Sec. 16.4.3). The spatial patterns of oxygen depend on both the distribution and functionality of the tumor blood vessels. A common misconception is that hypoxia is found primarily at the “core” of large solid tumors. Immunohistochemical studies from both animal and human tumors have confirmed that hypoxia can exist around any perfused vessel in a tumor (Fig. 12–7) (Kaanders et al, 2002). Also, there is at most a weak correlation between the degree of hypoxia and tumor size. Rather, regional variations in the levels of hypoxia are observed within tumors, reflecting regional differences in microvessel density and/or function. Because of the steep gradients in oxygen around perfused vessels, the equivalent oxygen concentration can fall from perivascular levels of approximately 5% to complete anoxia over only about 150 μm or about 10 cell diameters.
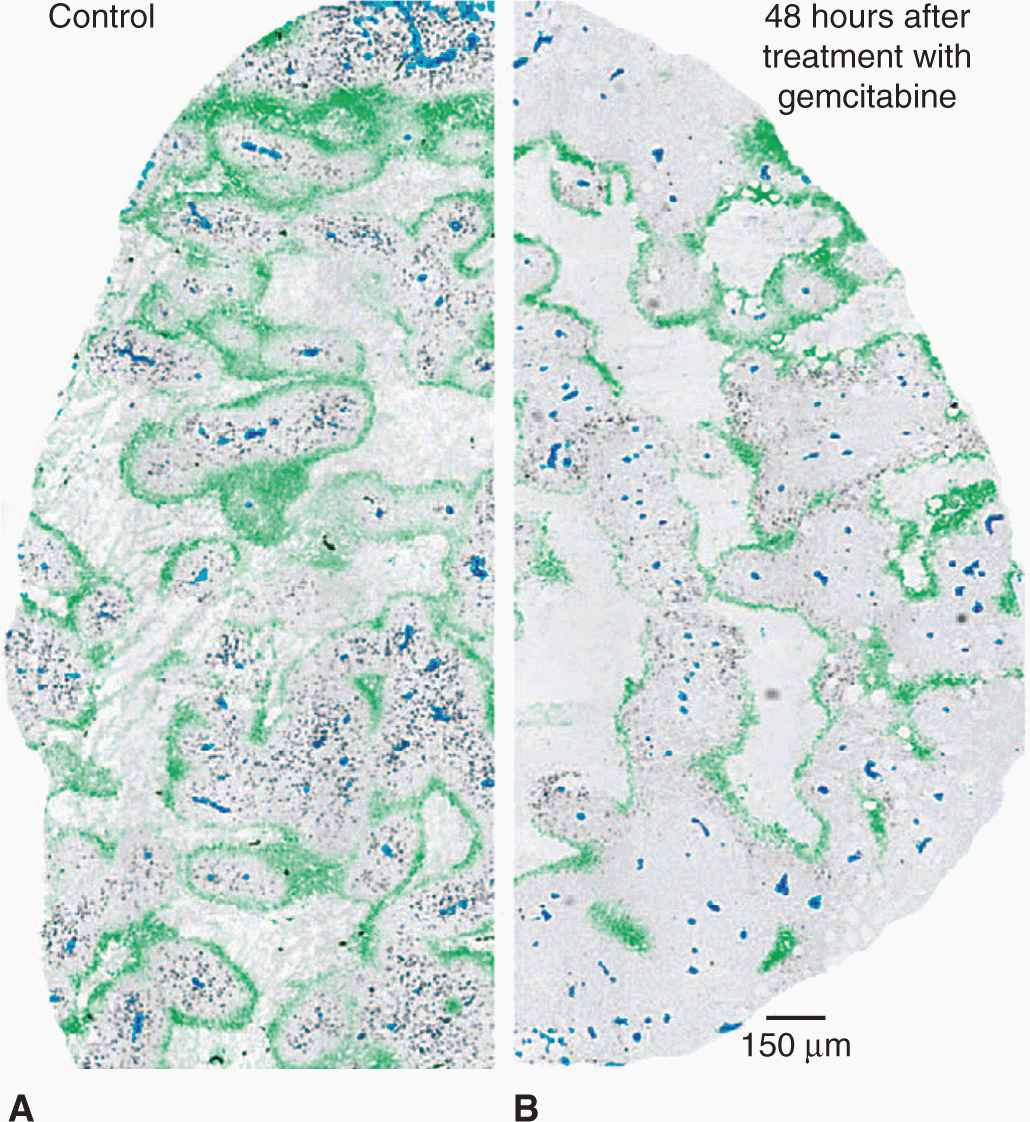
FIGURE 12–7 Distribution of hypoxia in tumors. The heterogeneous distribution of hypoxia is revealed in tumor xenografts using pimonidazole immunohistochemistry. These figures illustrate the concept that hypoxia is heterogeneously distributed throughout the tumor and can potentially be found around any vessel. (Reproduced from Minchinton and Tannock, 2006, with permission.)
The spatial heterogeneity in oxygen levels has implications for its assessment in patients. Immunohistochemistry is the only method that provides an assessment of oxygenation at the cellular level. Single biopsies will not necessarily reflect the overall oxygenation of the tumor, and multiple samples from various parts of the tumor will be necessary to estimate the overall level of hypoxia and its variation. Other techniques, including oxygen needle electrodes and imaging of hypoxia with positron emission tomography (PET) tracers (see Chap. 14, Sec. 14.3.3), may provide a more global view of hypoxia, but measurements are regional averages of oxygenation over a defined volume within which the cellular oxygen concentration can vary from normal to complete anoxia. Needle electrodes are inserted and measurements taken as the needle moves along a track through the tumor. Multiple tracks provide a frequency histogram of oxygen values (see Chap. 16, Fig. 16–12) that can reflect the overall distribution of oxygen values, but each measurement represents an average oxygen concentration over the sampling volume.
Spatial heterogeneity impacts on the biological and therapeutic consequences associated with hypoxia. For example, as discussed below, hypoxia is associated with an increased likelihood of distant metastasis. The ability of hypoxic cells to enter the circulation is likely to be much higher in regions of acute hypoxia, which can occur near blood vessels, than for chronic hypoxia. Indeed, laboratory data indicate that exposure to transient hypoxia promotes distant metastasis (see Chap. 10, Sec. 10.5.7; Chaudary and Hill, 2007). For chemotherapy, hypoxic cells are often found in regions where it is difficult to deliver therapeutic drugs effectively (see Chap. 19, Sec. 19.3.3).
Gradients surrounding isolated vessels result in oxygen concentrations that range from normal to complete anoxia. Complete anoxia is also expected to arise quickly in tumor cells surrounding temporarily occluded vessels, whereas partial vessel occlusion or a reduction in blood flow will result in a reduced oxygen concentration around the affected vessel and thus an acute drop in concentration across the entire gradient. Direct oxygen electrode and immunohistochemical studies in both animal and human tumors confirm the presence of cells at all possible oxygen concentrations. Hypoxic cells are resistant to radiation therapy (see Chap. 16, Sec. 16.4.1), but the oxygen sensitivity for this effect is significantly different from that for activation of hypoxia-inducible factor (HIF) transcription factors (discussed below) and for induction of changes in metabolism and angiogenesis. Therefore, the level of hypoxia and the fraction of hypoxic cells that is relevant depend upon the end point being considered.
The oxygen concentration in tumors also changes with time. Even when oxygen gradients around perfused vessels are stable, cellular proliferation results in movement of cells through this gradient. In rapidly proliferating mouse tumors, it has been estimated that a cell could be displaced by newly formed cells from a well-oxygenated region near the vessel to an anoxic region on the border of necrosis within 100 hours (4 to 5 doubling times). In human tumor xenografts, hypoxic cells can remain viable for up to 10 days (Durand and Sham, 1998), although this is likely to vary amongst different tumors. Thus, in addition to proliferation rates, the proportion of viable cells at low oxygenation concentration is influenced by the tolerance of the tumor cells to hypoxia. A rapid rate of proliferation coupled with high tolerance to hypoxia would be expected to produce tumors with large regions of chronic hypoxia, a feature that has been correlated with poor prognosis in patients. The contribution of changes in blood perfusion to overall levels of hypoxia also varies amongst different tumors and in some tumors accounts for a large proportion of the hypoxic cells at any given time (Durand and Aquino-Parsons, 2001). Fluctuations in regional blood flow and oxygen concentration occur over periods of approximately 30 minutes to 2 hours (Cardenas-Navia et al, 2004), and can result in periodic cycling between different oxygen concentrations. The rapid changes in oxygenation associated with perfusion-limited hypoxia present an additional challenge associated with attempts to measure oxygenation in patient tumors.
Tumor biology and response to treatment are strongly influenced by the duration of exposure to hypoxia. Transient exposures to anoxia may be better tolerated than more prolonged exposures arising at the ends of oxygen gradients at the border with necrosis. Adaptive mechanisms occur during the slow transition to longer periods of chronic hypoxia within oxygen gradients and these may have a stronger effect on gene expression and create different biological effects than the transient stress induced by acute hypoxia. Changes in oxygenation over time are also thought to be important mechanisms that can improve therapeutic outcome when treatment is delivered over longer periods of time. For example, hypoxic cells are resistant to radiotherapy (see Chap. 16, Sec. 16.4.1) and may also be resistant to many forms of chemotherapy because of poor drug distribution and through secondary effects that reduce their proliferation (see Chap. 19, Sec. 19.3.2). Thus, after a single dose of either treatment, the hypoxic cells have a selective survival advantage and the overall proportion of viable hypoxic cells in the tumor will increase. However, when treatment is fractionated over time, reoxygenation of previously hypoxic cells between treatments may result in the proportion of viable hypoxic cells being reduced to levels more typical of that before treatment. Although reoxygenation may allow the tumor to be more responsive to fractionated treatments (see Chap. 16, Sec. 16.6.4), this process may paradoxically also “rescue” previously hypoxic tumor cells that would have died in the absence of treatment.
Given the heterogeneity in space, time, and severity of levels of hypoxia, it is difficult to ascribe a single value to characterize the hypoxic status of a given tumor. For clinical studies with oxygen electrodes, investigators have defined the level of hypoxia as the proportion of readings below a defined pO2 value—typically 2.5, 5, or 10 mm Hg. Defined in this way, the hypoxic fraction of individual tumors can range from 0% to 100%. For immunohistochemical studies with hypoxic markers, the hypoxic fraction is usually determined as the proportion of cells (or tissue area) with a staining intensity above an arbitrary threshold. Even when defined in this suboptimal way, these approaches have provided insights into the impact of hypoxia on patient outcome. Figure 12–8 demonstrates results from the meta-analysis of 397 head and neck patients from 7 institutions who had oxygen measurements taken prior to treatment with radiotherapy (Nordsmark et al, 2006; see also Chap. 16, Fig. 16–12). This analysis indicates that pretreatment tumor oxygenation status is a significant determinant of outcome, with high levels of hypoxia predicting poor prognosis.
FIGURE 12–8 FIGURE 12–8 Hypoxia and patient outcome. A metaanalysis of oxygen electrode measurements made in head and neck cancer across several centers demonstrates an independent prognostic role for hypoxia and poor response to radiotherapy (from Nordsmark et al, 2006). This may be a result of the intrinsic resistance of hypoxic cells to radiation (the “oxygen effect”), and/or as a consequence of biological changes that occur as a result of hypoxia that promote malignancy.
12.2.2 Hypoxia and the Malignant Phenotype
The association of hypoxia with poor clinical outcome is not limited to treatment with radiotherapy; measurements of hypoxia can provide prognostic value independent of treatment modality, even for patients treated with surgery alone where there is no “intrinsic” resistance of hypoxic cells (Hockel et al, 1996). Numerous laboratory and clinical observations suggest that the prognostic value of hypoxia is associated not only with its ability to mediate resistance to therapy, but also with increased malignancy. For example, several clinical studies have found an association between hypoxia and metastases (Hockel et al, 1996; Airley et al, 2001) and hypoxia is prognostic of overall survival in cervix cancer (Fyles et al, 2006). Several independent animal model systems have demonstrated that exposure to transient acute hypoxia can promote metastasis (see Chap. 10, Sec. 10.5.7; Chaudary and Hill, 2007). Together, these findings suggest that the biological changes associated with hypoxia in human tumors are associated with a more aggressive phenotype (Harris, 2002).
At least 3 mechanisms may contribute to the association of hypoxia and increased malignancy. The first is through hypoxia-mediated selection of cells with mutations that confer both tolerance to hypoxia and increased aggressiveness. For example, p53 promotes hypoxia-induced cell death, and loss or mutation of p53 can lead to both increased levels of viable hypoxic cells, along with other aggressive phenotypes linked to loss of this tumor-suppressor protein (see Chap. 7, Sec. 7.6.2). Secondly, there are links between hypoxia and genomic instability (Bristow and Hill, 2008). Hypoxia can suppress the expression of genes involved in several DNA repair pathways including base excision repair (BER), mismatch repair (MMR), and double-stranded break (DSB) repair (see Chap. 5, Sec. 5.3). As a result, tumor hypoxia provides an environment to not only select cells with specific mutations, but one that may also directly promote mutation. Development of mutations may be further exacerbated in cells exposed to transient hypoxia, since reoxygenation is associated with the production of reactive oxygen species (ROS) that create DNA damage. A third proposed mechanism stems from changes in oxygen-sensitive signaling pathways, including those designed specifically for adaptation to hypoxic stress. These pathways constitute important physiological mechanisms mediating response to stress, but in tumors can promote adverse changes that affect cellular metabolism, angiogenesis, cell survival, and metastasis.
12.2.3 Sensing and Responding to Hypoxia
12.2.3.1 Hypoxia-Inducible Factor HIF is an essential transcription factor that regulates numerous cellular and tissue adaptive responses during hypoxia (Fig. 12–9A). It is a heterodimer composed of an oxygen-labile α-subunit (HIF-1α, HIF-2α), and a constitutively expressed HIF-1β subunit. In the presence of oxygen, the α-subunit is ubiquitinated by the von Hippel-Lindau (VHL) protein and targeted for degradation (see Chap. 8, Fig. 8–9 and Chap. 9, Fig. 9–4; Ivan et al, 2001; Jaakkola et al, 2001). Degradation requires hydroxylation of 2 proline residues (P402 and P564 in HIF-1α), which is carried out by 1 of 3 known HIF prolyl hydroxylases (PHD1 to -3). These enzymes require oxygen as a cofactor, and thus function as oxygen-sensing molecules (Epstein et al, 2001). During hypoxia, the PHD enzymes are unable to hydroxylate HIF-1α, resulting in its stabilization and formation of an active HIF heterodimer that is capable of inducing up to 200 different genes (Harris, 2002; Semenza, 2003). In addition to destabilizing HIF-1α, oxygen concentration also regulates its transcriptional activity. In the presence of oxygen, the factor inhibiting HIF (FIH) promotes hydroxylation of an asparagine residue in the transcription activation domain, which prevents its association with other proteins important for transcriptional activity. Genes regulated by HIF include those that promote metabolic adaptation at the cellular level through regulation of glucose uptake, glycolysis, and oxidative phosphorylation (Table 12–3). HIF also stimulates tumor angiogenesis through its ability to regulate genes such as vascular endothelial growth factor (VEGF; see Chap. 11, Sec. 11.4.1). HIF activation may also account for a component of the increased metastatic capacity of hypoxic cells through induction of genes such as LOX, VEGF-C, Met, and CXCR4 (see Chap. 10, Sec. 10.5.7; Pennacchietti et al, 2003; Staller et al, 2003; Erler et al, 2006; Chaudary et al, 2011).
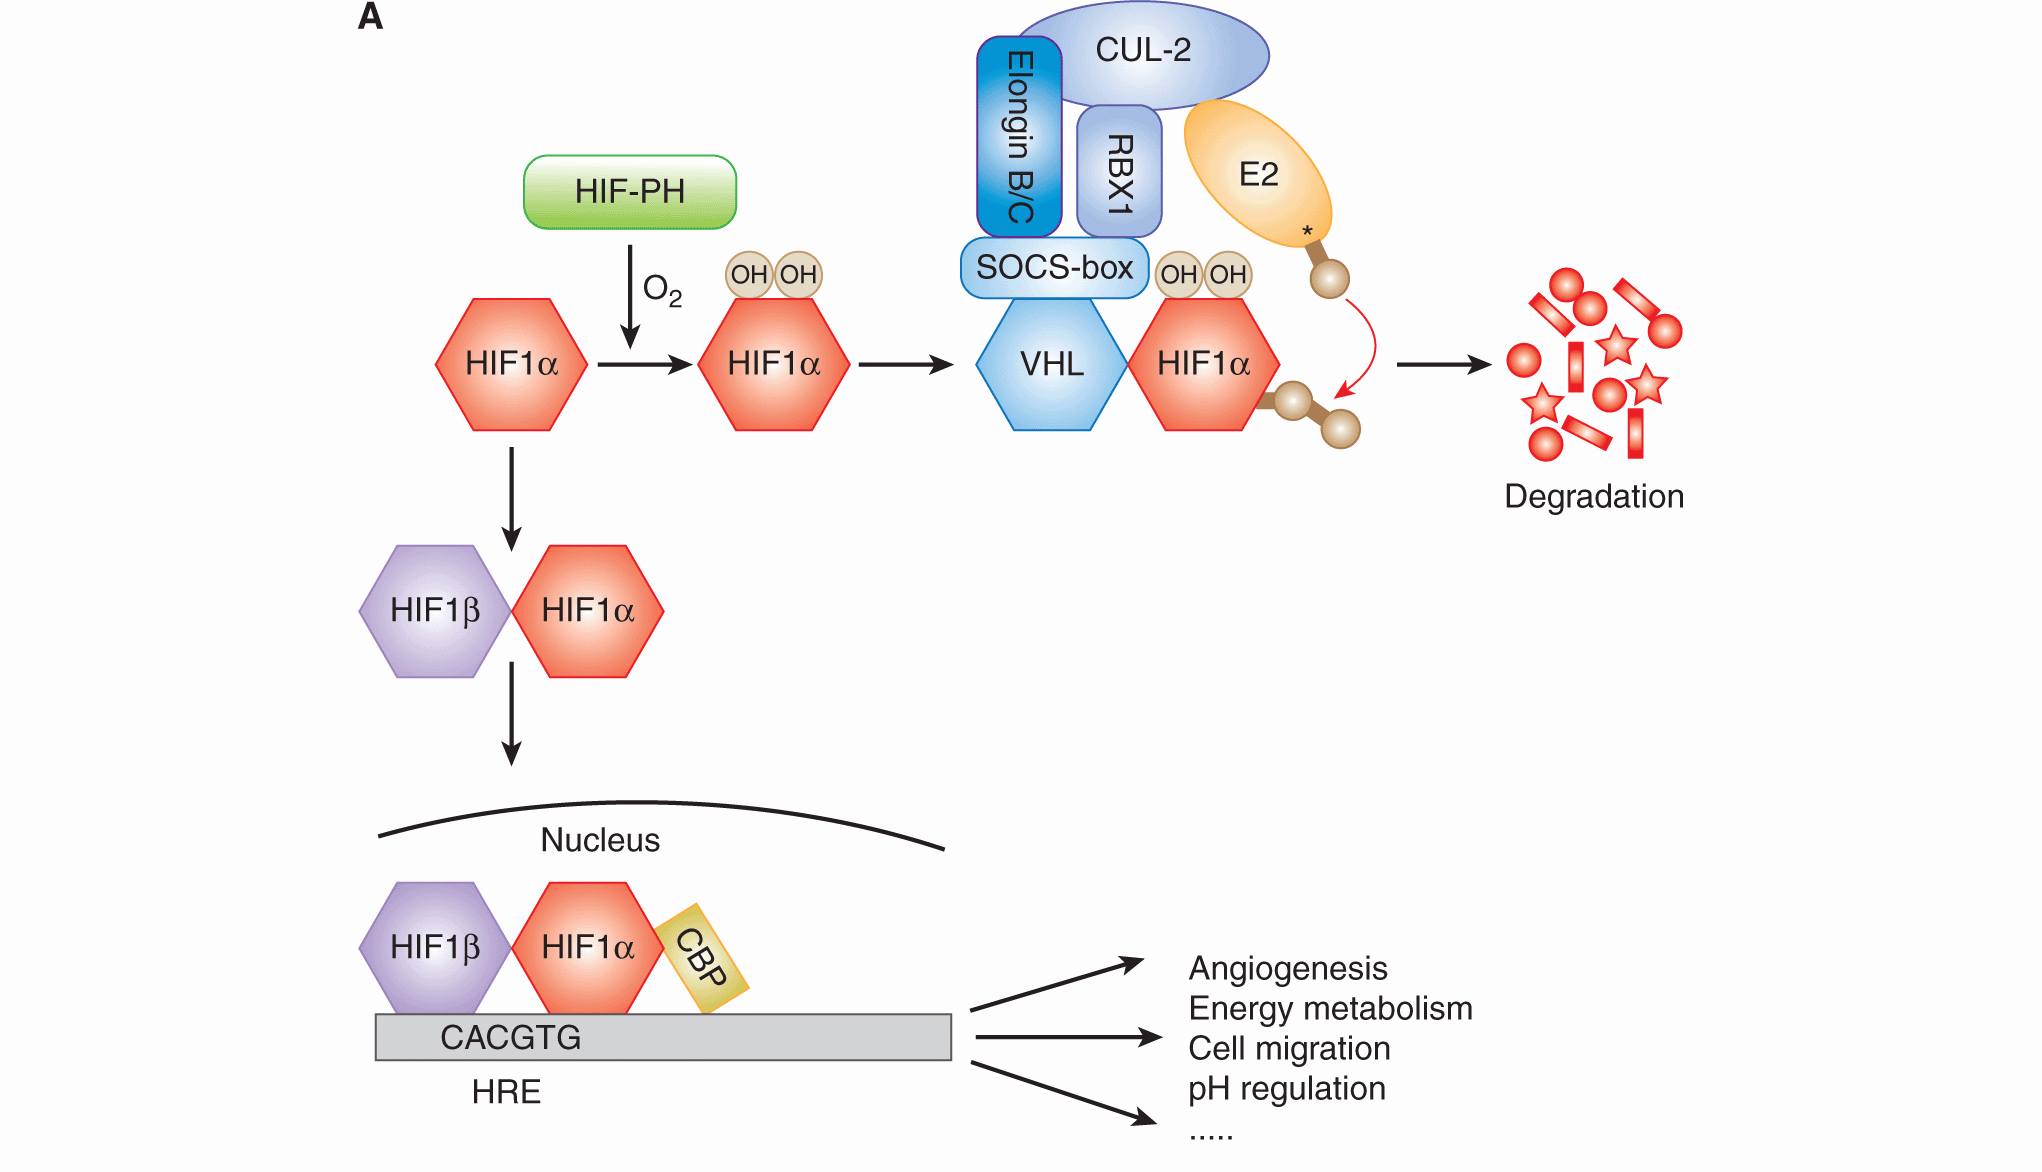
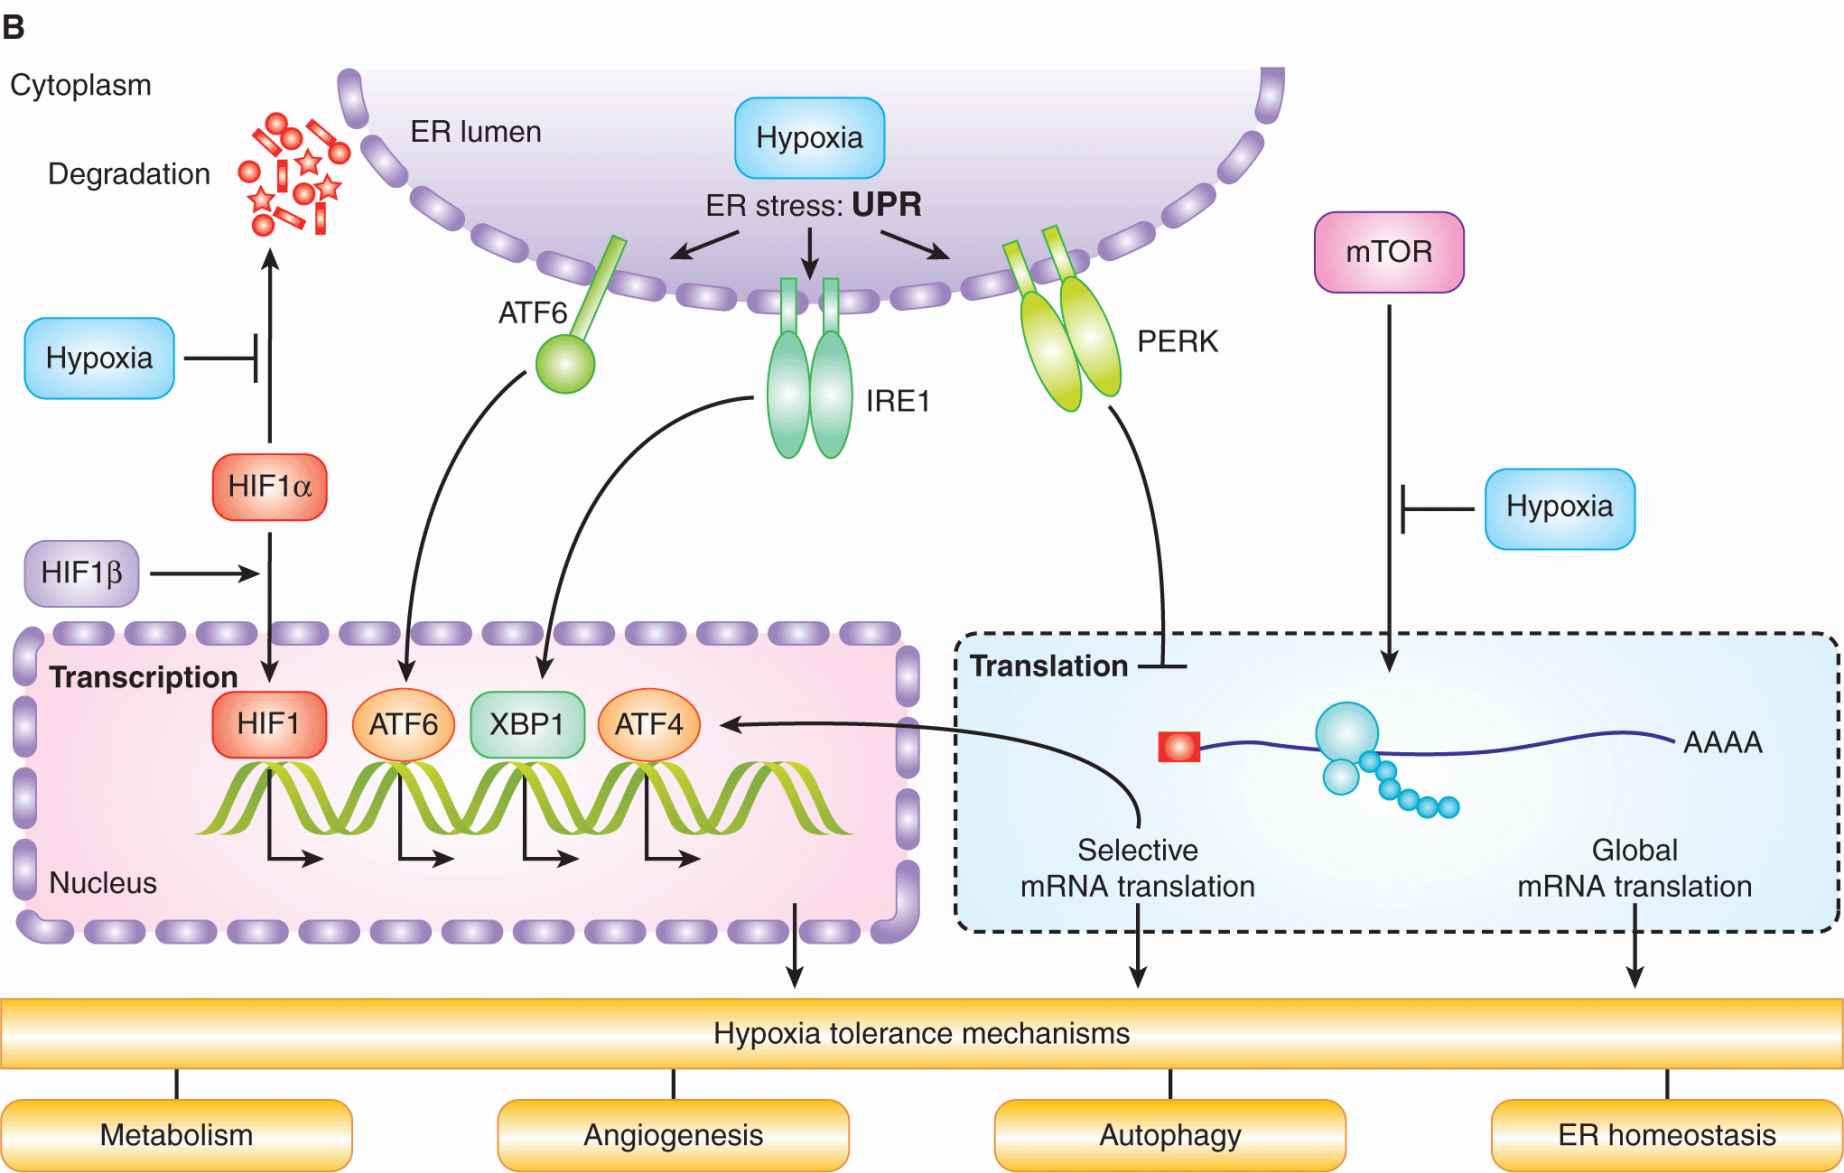
FIGURE 12–9 A) HIF activity is regulated by oxygen. HIF1α is hydroxylated on 2 proline residues in an oxygen-dependent reaction by 1 of the 3 HIF prolyl hydroxylases (HIF-PH enzymes). Hydroxylation leads to its recognition by the von Hippel-Lindau (VHL) protein, which subsequently mediates its ubiquitination by the Elongin B/C-CUL2-RBX1 complex and an E2 ubiquitin ligase. Ubiquitinated HIF-1α is then degraded in the proteasome. In the absence of oxygen, HIF-1α forms a heterodimer with HIF1β, which then moves into the nucleus and activates genes (together with CBP) that contain a HIF consensus-binding sequence in their promoter. These genes promote numerous biological changes that promote change in metabolism and angiogenesis. B) Cell signaling in response to hypoxia. Hypoxia results in the activation of HIF and the unfolded protein response (UPR), as well as inhibition of mammalian target of rapamycin (mTOR). These distinct oxygen-sensitive signaling pathways promote adaption to hypoxic stress through a multitude of downstream effectors that influence cellular metabolism, autophagy, endoplasmic reticulum (ER) stress, and angiogenesis. The UPR consists of 3 signaling arms initiated by PERK, IRE1 and ATF6. Each of these arms results in the activation of a different transcription factor (ATF4, XBP1, and ATF6), which collectively function to prevent and mitigate the consequences of ER stress. These 3 pathways can also influence cellular phenotypes in ways that promote malignancy through increased invasion and metastasis.
TABLE 12–3 Important pathways and genes controlled by HIF.
HIF activation occurs during normal physiological processes and is sensitive to relatively mild tissue hypoxia, below approximately 2% oxygen, levels much higher than needed to cause substantial resistance to radiation. Thus, the proportion of HIF-expressing cells in tumors is expected to be greater than the fraction of radiation-resistant cells. This difference also influences comparisons of direct measurements of tumor hypoxia with those inferred from so-called endogenous markers of hypoxia. HIF-target genes such as carbonic anhydrase 9 (CA9) and glucose transporter 1 (GLUT-1) have been used as markers in immunohistochemical studies to evaluate tumor hypoxia, but have limited correlation with other direct measures of oxygenation. This is further complicated because HIF is also regulated by oxygen-independent mechanisms. The most extreme example occurs in renal cell carcinoma, where loss of the VHL protein leads to constitutive activation of HIF. Oncogene activation can also lead to increased synthesis and activity of HIF independent of hypoxia.
Laboratory experiments with cells and animal tumor models have suggested that targeting HIF might be an effective therapeutic strategy. However, despite numerous attempts it has been difficult to develop drugs that are specific inhibitors of HIF. Most drug development has focused on targeting pathways downstream of HIF, such as VEGF, or enzymes such as CA9, which regulate tumor pH in response to hypoxia.
12.2.3.2 Unfolded Protein Response The endoplasmic reticulum (ER) is a specialized organelle where membrane-based and secreted proteins are folded and glycosylated. A disruption in ER homeostasis or an increase in protein flux through the ER can lead to the accumulation of unfolded proteins and activation of the unfolded protein response (UPR; see Fig. 12–9B). The UPR is mediated by 3 distinct ER stress sensors: PERK (PKR-like ER kinase), inositol-requiring protein-1 (IRE-1), and activating transcription factor-6(ATF6). All 3 of these sensors are activated rapidly during severe hypoxia (<0.2% equivalent) as a consequence of an unexplained disruption in protein folding. During hypoxia, PERK phosphorylates and inactivates eIF2α, leading to a block in new protein synthesis (Koumenis et al, 2002). PERK activation also leads to selected synthesis of the ATF4 transcription factor and downstream activation of genes involved in adaptation to ER stress. IRE-1 and ATF6 activation result in additional transcriptional responses that support both adaptation and recovery from ER stress. The activation of the UPR occurs within minutes of hypoxic exposure and is important for adaptation and cell survival. Defects in the PERK and IRE-1 signaling pathways result in increased cell death during hypoxia and prevent or slow tumor growth in animal models, indicating their importance for cellular adaptation to hypoxia (Wouters and Koritzinsky, 2008).
UPR activation has been observed in human tumors and is associated with poor disease-free survival, possibly reflecting the presence of hypoxia (Davies et al, 2008). UPR-dependent genes, such as ATF4, are also known to be overexpressed in cancer, primarily in hypoxic perinecrotic regions of human tumors (Ameri et al, 2004). Several downstream pathways are likely to contribute to the importance of the UPR in hypoxic cells. Because protein synthesis is a large consumer of cellular energy, its suppression via PERK may assist in maintaining energy homeostasis (Kraggerud et al, 1995). PERK activation also has been shown to promote survival by promoting transcriptional changes in CA9 that regulates tumor pH and by promoting autophagy, a process in which cells capture and degrade components of their own cytoplasm to sustain survival during times of starvation (see Sec. 12.3.7; Rouschop et al, 2010).
12.2.3.3 Mammalian Target of Rapamycin The mammalian target of rapamycin (mTOR) kinase acts as a central regulator of cellular metabolism by integrating upstream signaling pathways that monitor growth factors, energy, and nutrients, and coupling them to regulation of protein synthesis, ribosomal biogenesis, autophagy, and metabolism (Guertin and Sabatini, 2007; see Figs. 12–9B and 12–10). Many onco-genes and tumor suppressors function in pathways whose activation in cancer results in hyperactive mTOR signaling. Hypoxia, in contrast, inhibits mTOR signaling through multiple pathways both upstream and downstream of the kinase, particularly in concert with other stresses or when hypoxic conditions are chronic (Wouters and Koritzinsky, 2008). Cells that are genetically engineered to be unable to inhibit mTOR during hypoxia show reduced tolerance to hypoxia, and produce tumors with a smaller proportion of radioresistant hypoxic cells (Dubois et al, 2009).
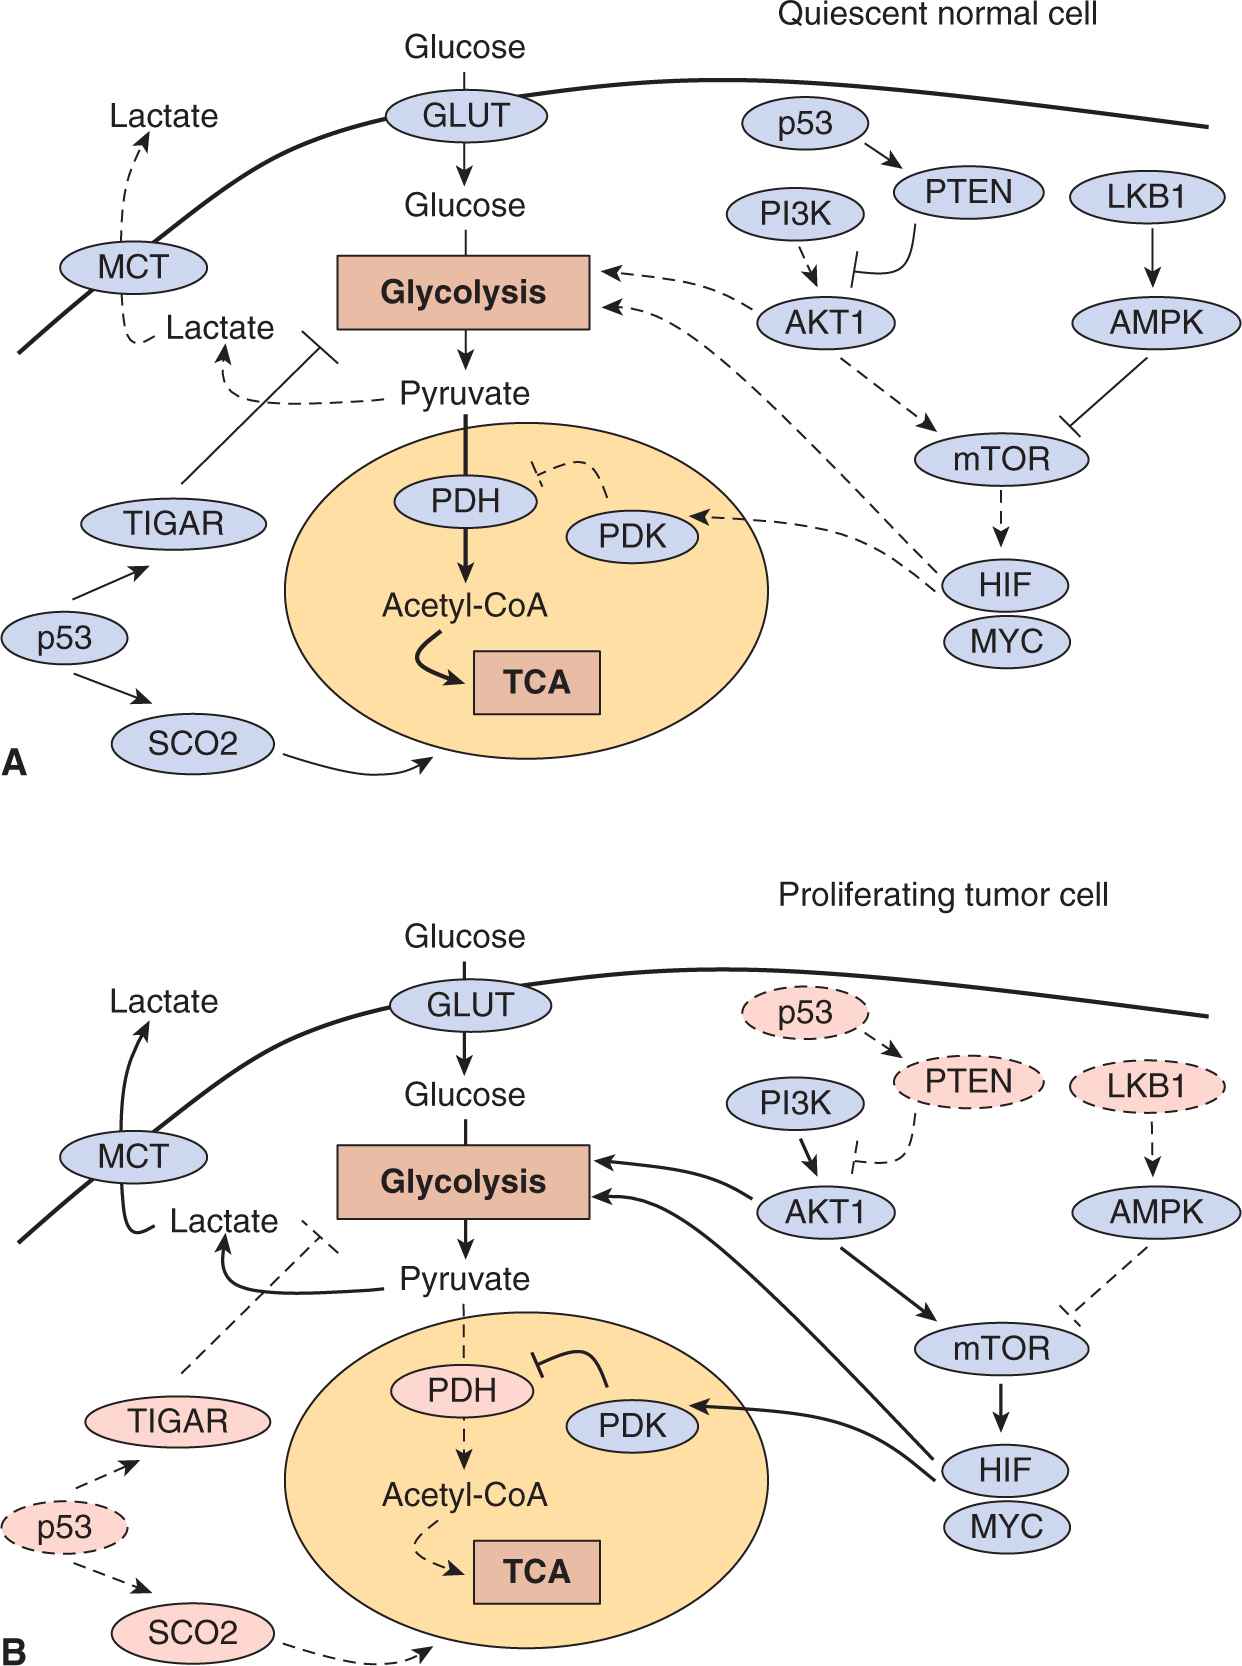
FIGURE 12–10 Molecular regulation of aerobic glycolysis. The shift to aerobic glycolysis in tumor cells (B) relative to normal cells (A) is driven by multiple oncogenic signaling pathways. Phosphatidylinositol-3 kinase (PI3K) activates the oncogenic kinase AKT, which stimulates glycolysis by directly regulating glycolytic enzymes and by activating the mammalian target of rapamycin (mTOR) kinase. The liver kinase B1 (LKB1) tumor suppressor, through adenosine monophosphate-activated protein kinase (AMPK) activation, opposes the glycolytic phenotype by inhibiting mTOR. mTOR alters metabolism in a variety of ways, but it has an effect on the glycolytic phenotype by enhancing HIF-1 activity, which engages a hypoxia adaptive transcriptional program. HIF-1 increases the expression of glucose transporters, glycolytic enzymes, and pyruvate dehydrogenase kinase, isozyme 1 (PDK1), which blocks entry of pyruvate into the tricarboxylic acid cycle (TCA) cycle. MYC cooperates with HIF in activating several glycolytic genes, but also increases mitochondrial metabolism. The tumor-suppressor p53 opposes the glycolytic phenotype by suppressing glycolysis via TP53-induced glycolysis and apoptosis regulator (TIGAR), increasing mitochondrial metabolism via cytochrome c oxidase assembly protein 2 (SCO2) and supporting expression of the phosphatase and tensin homolog (PTEN) tumor supressor. Solid lines represent more active pathways; dashed lines represent less active pathways. Pink protein labels indicate proteins whose function is commonly impaired in tumor cells.
Tumor cells exposed to severe hypoxic stress may inhibit mTOR as a means to reduce protein synthesis and energy expenditure, and thus promote cell survival. Inhibition of mTOR also promotes tolerance to hypoxia through mechanisms that involve changes in apoptosis and/or autophagy (Erler et al, 2004). Inhibition of mTOR stimulates autophagy, which can assist in maintaining essential metabolism in nutrient- and oxygen-deprived cells (see Sec. 12.3.7). Consistent with this, autophagy has been observed in poorly vascularized xenografts (Degenhardt et al, 2006), as well as in animal models of the ischemic brain (Adhami et al, 2006) and myocardium (Yan et al, 2005). Finally, although inhibition of mTOR leads to an overall reduction in protein synthesis, certain classes of genes are able to bypass this inhibition and become selectively translated. This so-called cap-independent translation affects several important genes, including both HIF-1α and VEGF (Richter and Sonenberg, 2005). This effect has also been shown to facilitate tumor growth in locally advanced breast cancers (Braunstein et al, 2007).
New drugs that inhibit mTOR (eg, temsirolimus and everolimus) have been approved for specific anticancer indications. These agents are able to slow proliferation by reducing mTOR activity and inhibit overall metabolic activity. However, given that inhibition of mTOR also promotes tolerance to hypoxia, these agents could result in an increase in the proportion of viable hypoxic cells and as a consequence reduce the effectiveness of other therapies (Weppler et al, 2007).
12.2.4 Heterogeneity in Tumor pH and Interstitial Fluid Pressure
12.2.4.1 Tumor pH The abnormal structure and function of the vasculature causes abnormal and highly heterogeneous biochemical conditions in the tumor microenvironment in addition to affecting tumor oxygenation. As a result of an imbalance in the production and elimination of metabolic acids such as lactic and carbonic acid, extracellular pH levels in solid tumors are often acidic relative to normal tissues (Yamagata et al, 1998). However, adaptive responses mediated by membrane transport proteins and carbonic anhydrase enzymes allow maintenance of normal or even elevated intracellular pH (Parks et al, 2011). Experimental models suggest that like hypoxia, acidic extracellular conditions contribute to the malignant phenotype by increasing tumor invasiveness and metastasis. Although there is not yet a complete understanding of the mechanisms responsible for pH regulation in tumor cells, strategies to target the adaptive response to acidic conditions are under investigation. The concentrations of critical nutrients are also altered in solid tumors. Measurements of glucose, gluta-mine and other metabolites reveal that spatial and temporal heterogeneity exists, as well as large intertumor variation. These conditions also require tumor cells to appropriately respond and adapt in order to continue to survive and proliferate.
12.2.4.2 Interstitial Fluid Pressure A further abnormality encountered in the tumor microenvironment is elevated interstitial fluid pressure (IFP) (Fukumura and Jain, 2007). Tumors lack functional lymphatics, which results in a buildup of fluid in the extracellular space and increased IFP, especially when combined with an abnormal and leaky vasculature. This phenomenon has been measured in a variety of solid tumors, and predicts for poor outcome in some circumstances (Fyles et al, 2006). Impaired delivery of chemotherapeutic agents and altered levels of cytokines and growth factors are thought to be responsible for the reduced effects of treatment.
12.3 TUMOR METABOLISM
The abnormal conditions present in the tumor microenvironment play a major role in determining the metabolic phenotype of tumor cell (Lunt et al, 2009). The relationship between the tumor microenvironment and cellular metabolism is not one of simple cause-and-effect in which biochemical conditions in the tumor influence cellular metabolism. Because metabolite concentrations are governed by both supply via the vasculature and demand by the tissue (or vice versa), changes in metabolism of both the tumor and normal stromal cell have a profound effect on local microenvironmental conditions. Because of the dynamic nature of the tumor microenvironment, it is likely that the metabolic phenotype of tumor cells can change to adapt to the prevailing local conditions.
Critical phenotypes characteristic of tumor cells are caused by a series of mutational events that combine to alter multiple cellular signaling pathways affecting proliferation and survival. Thousands of point mutations, translocations, amplifications, and deletions have been detected in cancer cells and the mutational spectrum can differ even among seemingly identical tumors. Bioinformatic analyses of large data sets have suggested that cancer-related driver mutations affect a dozen or more core signaling pathways and processes responsible for tumorigenesis, many of which are described in other chapters. Multiple molecular mechanisms, both intrinsic and extrinsic, converge to alter cellular metabolism to support growth and survival of the cancer cells. Furthermore, some of these metabolic alterations appear to be absolutely required for malignant transformation.
Genetic alterations to oncogenes and tumor suppressors (see Chap. 7) and the cellular response to extracellular micro-environmental conditions both contribute to the development of an abnormal metabolic phenotype. These metabolic alterations provide support for 3 of the most basic needs of dividing cells (Fig. 12–11):
FIGURE 12–11 Determinants of the tumor metabolic phenotype. The metabolic phenotype of tumor cells is controlled by intrinsic genetic mutations and external responses to the tumor microenvironment. Oncogenic signaling pathways controlling growth and survival are often activated by loss of tumor suppressors (such as p53) or activation of oncogenes (such as PI3K). The resulting altered signaling modifies cellular metabolism to match the requirements of cell division. Abnormal microenvironmental conditions such as hypoxia, low pH, and/or nutrient deprivation elicit responses from tumor cells that further affect metabolic activity. These adaptations serve to optimize tumor cell metabolism for proliferation by providing appropriate levels of energy in the form of adenosine triphosphate (ATP), biosynthetic capacity, and maintenance of balanced reduction-oxidation (redox) status.
• Rapid generation of energy in the form of adenosine triphosphate (ATP);
• Biosynthesis of the macromolecular building blocks required to generate daughter cells; and
• Maintenance of appropriate cellular reduction-oxidation (redox) status required to prevent excessive oxidative damage and to provide reducing power for anabolic enzymatic reactions.
To meet these needs, cancer cells acquire alterations to the metabolism of all 4 major classes of macromolecules: carbohydrates, proteins, lipids, and nucleic acids. Many similar metabolic alterations are also observed in rapidly proliferating normal cells, where they represent appropriate responses to physiological growth signals (Newsholme et al, 1985; Vander Heiden et al, 2009). However, for cancer cells, these adaptations represent responses to the inappropriate growth and survival signals generated by acquired genetic mutations. Furthermore, these metabolic alterations must be implemented in a stressful and dynamic tumor microenvironment, where concentrations of critical nutrients and waste products, such as glucose, glutamine, oxygen, and lactate, are spatially and temporally heterogeneous (see Sec. 12.2).
12.3.1 Aerobic Glycolysis (The Warburg Effect)
In addition to the ATP required to maintain normal cellular homeostasis, proliferating tumor cells must also generate the energy required to support cell division. Furthermore, tumor cells must evade the checkpoint controls that would normally block proliferation under the stressful metabolic conditions characteristic of the abnormal tumor microenvironment. During the course of transformation and progression, these selective pressures result in a reprogramming of core metabolic pathways. The best characterized, and most universal metabolic phenotype observed in tumor cells is an increase in glycolysis. In this process, glucose is converted to lactate and secreted from the cell, rather than being completely oxidized to CO2 via oxidative phosphorylation in the mitochondria (see Fig. 12–10). This is referred to as the Warburg effect, after Otto Warburg, who first described the phenomena (Warburg, 1956). This mode of glucose utilization and ATP production is similar to the Pasteur effect, which is the normal shift toward glycolytic ATP production that occurs during periods of oxygen limitation. However, the Warburg effect is observed in tumor cells even under normal oxygen concentrations (Warburg, 1956). As a result, unlike most normal cells, many transformed cells derive a substantial amount of their energy from aerobic glycolysis, converting the majority of incoming glucose into lactate rather than metabolizing it in the mitochondria via oxidative phosphorylation. Although ATP production by glycolysis can be more rapid than by oxidative phosphorylation, it is far less efficient in terms of ATP generated per molecule of glucose consumed. This shift therefore demands that tumor cells increase their rate of glucose uptake so as to meet their energy requirements.
Aerobic glycolysis is a common feature of many tumors, but there remains debate about the selective advantage that glycolytic metabolism provides to proliferating tumor cells. Initial work by Warburg and others focused on the concept that tumor cells develop defects in mitochondrial function, and that aerobic glycolysis was a necessary adaptation to cope with a decrease in ATP generation by oxidative phosphorylation. However, functional mitochondrial defects in tumors are relatively rare (Frezza and Gottlieb, 2009), and most tumor cells retain the capacity for oxidative phosphorylation and continue to consume oxygen at rates similar to those observed in normal tissues (Weinhouse, 1976). In fact, mitochondrial function is critical for transformation in some model tumor systems (Funes et al, 2007). Other explanations for the shift toward aerobic glycolysis include the concept that glycolysis has the capacity to generate ATP at a higher rate compared to oxidative phosphorylation, so it could be advantageous as long as glucose supplies are not limited. Alternatively, it has been proposed that glycolytic metabolism arises as an adaptation to the hypoxic conditions that develop during the early avascular phase of tumor growth, as it allows for ATP production and maintenance of bioenergetic homeostasis in the absence of oxygen. Adaptation to the resulting acidic microenvironment caused by excess lactate and carbonic acid production may further drive the evolution of the glycolytic phenotype (Gillies et al, 2008).
Another explanation for increased aerobic glycolysis in tumors is that this pathway serves to balance the need of proliferating cells for energy with the equally important need for macromolecular building blocks and maintenance of redox homeostasis (see Sec. 12.3.4). Several important subsidiary biosynthetic metabolic pathways rely on glycolytic intermediates, including the hexosamine pathway, uridine diphosphate (UDP)-glucose synthesis, glycerol synthesis, and the pentose phosphate pathway. The pentose phosphate pathway is also a key means of producing nicotinamide adenine dinucleotide phosphate (NADPH), which provides reducing power for many biosynthetic reactions and maintenance of antioxidant systems. In addition, by removing the burden of energy production from the mitochondria, high rates of aerobic glycolysis allow the tricarboxylic acid (TCA) cycle to act as a hub for biosynthesis of fatty acids and amino acids rather than as a site of energy generation.
The reliance of cancer cells on increased glucose uptake has proven useful for tumor detection and monitoring. The glycolytic phenotype of tumor cells serves as the basis for clinical [18F] fluorodeoxyglucose positron emission tomography (FDG-PET) imaging (see Chap. 14, Sec. 14.3.3). FDG-PET employs a radioactive glucose analog that is taken up by cells along with glucose, but cannot be further metabolized and is trapped intracellularly. Imaging of fluorodeoxyglucose (FDG) detects regions of high glucose uptake, and allows identification and monitoring of many tumor types, as well as generating data regarding the importance of glucose as a fuel for malignancies (Jadvar et al, 2009). Attempts to exploit the glycolytic phenotype of tumor cells for therapy have been less successful: There have been attempts to block aerobic glycolysis, using compounds such as 2-deoxyglucose, but effective therapeutic strategies have yet to be devised. Several novel therapeutic approaches targeting the glycolytic process are undergoing evaluation, including the inhibition of lactate dehydrogenase, and the inactivation of the monocarboxylate transporters (MCT) responsible for conveying lactate across the plasma membrane (see Fig. 12–10) (Le et al, 2010).
Although aerobic glycolysis is the most well documented metabolic phenotype of tumor cells, it is not a universal feature of human cancers (Moreno-Sanchez et al, 2007). Moreover, even in relatively glycolytic tumors, oxidative phosphorylation is not completely shut down. Clinical FDG-PET data, as well as in vitro and in vivo experimental studies show that tumor cells are capable of using alternative fuel sources. It is estimated that up to 30% of human tumors are considered FDG-PET–negative depending on the tumor type (Jadvar et al, 2009). Amino acids, fatty acids, and even lactate have been shown to act as fuels for tumor cells in certain genetic and microenvironmental contexts.
Much of the work on cancer metabolism has focused on rapidly proliferating tumor models and cells grown in vitro. Because the rate of cell division can alter the metabolism of normal cells and tissues, some of the metabolic properties associated with malignancy may simply relate to rapid cell proliferation. It is unclear to what extent the metabolic pheno-types of tumor cells, including the Warburg effect, will prove to be important in low-grade slow-growing tumors, where metabolic demands may not be as extreme. Future clinical data describing the metabolic profiles of human tumors will be required to determine which metabolic alterations are most prevalent in specific tumor types and how they relate to changes in common oncogenic signaling pathways.
12.3.2 Regulation of Aerobic Glycolysis
12.3.2.1 The PI3K pathway The PI3K (phophatidylinositol-3 kinase) pathway is one of the most commonly altered signaling pathways in human cancers (see Chap. 7, Sec. 7.5.4 and Chap. 8, Sec. 8.2.5). This pathway is activated by mutations in tumor-suppressor genes such as PTEN, mutations in components of the PI3K complex itself, or by aberrant signaling from receptor tyrosine kinases (Wong et al, 2010). Once activated, the PI3K pathway not only provides strong growth and survival signals to tumor cells but also has profound effects on their metabolism.
The best-studied effector molecule downstream of PI3K is AKT1, also known as protein kinase B (PKB). Upon activation, AKT1 exerts its effects by phosphorylating key signaling substrates involved in proliferation, survival and metabolism. AKT1 is an important driver of the tumor glycolytic pheno-type and stimulates ATP generation via multiple mechanisms, ensuring that cells have the bioenergetic capacity required to respond to parallel growth signals. AKT1 stimulates glycolysis by increasing the expression and membrane translocation of glucose transporters, and by phosphorylating key glycolytic enzymes such as hexokinase and phosphofructokinase-2 (Robey and Hay, 2009). The elevated and prolonged AKT1 signaling that is associated with transformation inhibits the fork-head box subfamily O (FOXO) transcription factors, resulting in a host of complex transcriptional changes that also increase glycolytic capacity (Khatri et al, 2010). Finally, AKT1 strongly activates mTOR kinase by phosphorylating and inhibiting its negative regulator, tuberous sclerosis 2 (TSC2) (Robey and Hay, 2009). The mTOR protein functions as a key metabolic integration point, coupling growth signals to nutrient availability (see Sec. 12.2.3). Normally, activated mTOR stimulates protein and lipid biosynthesis and cell growth in response to sufficient nutrient and energy conditions and growth signals, but it is often constitutively activated in tumors (Guertin and Sabatini, 2007). At the molecular level, mTOR directly stimulates messenger RNA (mRNA) translation and ribosome biogenesis, and indirectly causes other metabolic changes by activating transcription factors such as HIF-1 (see Sec. 12.2.3). The subsequent HIF-1–dependent metabolic changes are a major determinant of the glycolytic phenotype downstream of PI3K, AKT1, and mTOR (see Fig. 12–10).
12.3.2.2 HIF-1 and MYC The HIF-1 and HIF-2 complexes are the major transcription factors responsible for changes in gene expression during the cellular response to hypoxia (see Sec. 12.2.3). Although these 2 transcription factors transactivate an overlapping set of genes, the effects on central metabolism have been better characterized for HIF-1. In addition to its stabilization under hypoxic conditions, HIF-1 can be activated under normoxic conditions by oncogenic signaling pathways, including PI3K, and by mutations in tumor-suppressor proteins such as VHL (Kaelin, 2008), succinate dehydrogenase (SDH), and fumarate hydratase (FH) (King et al, 2006), which cause defects in its normal degradation. HIF-1 amplifies the transcription of genes encoding glucose transporters and most of the glycolytic enzymes, increasing the capacity of the cell to perform glycolysis (Semenza, 2010). In addition, HIF-1 activates the pyruvate dehydrogenase kinases (PDKs), which phosphorylate and inactivate the mitochondrial pyruvate dehydrogenase complex, thereby reducing the flow of glucose-derived pyruvate into the TCA cycle (Papandreau et al, 2006; see Fig. 12–10). This reduction in pyruvate flux into the TCA cycle decreases the rate of oxidative phosphorylation and oxygen consumption, reinforcing the glycolytic phenotype and sparing oxygen under hypoxic conditions. Inhibitors of HIF-1 or the PDKs might reverse some of the metabolic effects of tumorigenic HIF-1 signaling, and several such candidates, including the PDK inhibitor dichloroacetic acid (DCA), are under evaluation for their therapeutic utility.
The oncogenic transcription factor MYC also has a number of important effects on cell metabolism (see Chap. 7, Sec. 7.5.2). MYC can collaborate with HIF in the activation of a number of glucose transporters, glycolytic enzymes, lactate dehydrogenase A, and PDK1 (Dang et al, 2008). However, unlike HIF, MYC also activates the transcription of targets that increase mitochondrial function, especially the metabolism of glutamine, which is discussed below.
12.3.2.3 Adenosine Monophosphate-Activated Protein Kinase Adenosine monophosphate (AMP)-activated protein kinase (AMPK) is a critical sensor of energy status and plays an important role in cellular responses to metabolic stress, coupling energy status to growth signals. AMPK opposes the effects of AKT1 by acting as a potent inhibitor of mTOR (see Fig. 12–10). The AMPK complex thus functions as a metabolic checkpoint, regulating the cellular response to available metabolic energy. AMPK becomes activated in response to an increased AMP:ATP ratio, and is responsible for shifting cells to an oxidative metabolic pheno-type and inhibiting cell proliferation (Shackelford and Shaw, 2009). Tumor cells must overcome this checkpoint in order to proliferate in response to activated growth signaling pathways, especially in a nutrient deficient microenvironment. A number of oncogenic mutations and signaling pathways can suppress AMPK signaling (Shackelford and Shaw, 2009), effectively uncoupling fuel signals from growth signals, and allowing tumor cells to continue to divide under abnormal nutrient conditions. This uncoupling permits tumor cells to respond to inappropriate growth signaling pathways activated by oncogenes and the loss of tumor suppressors. Accordingly, many cancer cells exhibit a loss of appropriate AMPK signaling, which may also contribute to their glycolytic phenotype.
Given the role of AMPK, it is not surprising that the gene which encodes liver kinase B1 (LKB1), the upstream kinase necessary for AMPK activation, has been identified as a tumor-suppressor gene (see Fig. 12–10). Inherited mutations in LKB1 are responsible for Peutz-Jeghers syndrome (Jenne et al, 1998). This syndrome is characterized by the development of benign gastrointestinal and oral lesions, and an increased risk of developing a broad spectrum of malignancies. LKB1 is also frequently mutated in sporadic cases of non–small cell lung cancer and cervical carcinoma. Recent evidence suggests that LKB1 mutations are tumorigenic as a consequence of the resulting decrease in AMPK signaling and loss of mTOR inhibition (Shackelford and Shaw, 2009). The loss of AMPK signaling permits the activation of mTOR and HIF-1, and therefore may also support the shift toward glycolytic metabolism. Clinically, there is interest in evaluating whether AMPK agonists can be used to recouple fuel and growth signals in tumor cells and shut down cell growth. Two such agonists are the commonly used antidiabetic drugs metformin and phenformin.
12.3.2.4 p53 Although the transcription factor and tumor-suppressor p53 is best known for its functions in the DNA damage response (DDR) and apoptosis pathways (see Chap. 5, Sec. 5.4 and Chap. 7, Fig. 7–12), it is also an important regulator of metabolism (Vousden and Ryan, 2009). p53 activates the expression of hexokinase II, which converts glucose to glucose-6-phosphate (G6P). G6P then either enters the glycolytic pathway to produce ATP, or enters the pentose phosphate pathway (PPP), which supports macromolecular biosynthesis by producing reducing potential in the form of reduced NADPH and/or ribose building blocks for nucleotide synthesis. p53 inhibits the glycolytic pathway by upregulating the expression of p53-induced glycolysis and apoptosis regulator (TIGAR), an enzyme that decreases levels of the glycolytic activator fructose-2,6-bisphosphate (see Fig. 12–10) (Vousden and Ryan, 2009). Wild-type p53 also acts to support the expression of PTEN, which inhibits the PI3K pathway, thereby suppressing glycolysis (Stambolic et al, 2001). Furthermore, p53 promotes oxidative phosphorylation by activating the expression of SCO2, which is required for assembly of the cyto-chrome c oxidase complex of the electron transport chain (Matoba et al, 2006). Thus, the loss of p53 may also be a major force behind the acquisition of the glycolytic phenotype.
12.3.2.5 Pyruvate Kinase Pyruvate kinase (PK) catalyzes the final, and ATP-generating step of glycolysis, in which phosphoenolpyruvate (PEP) is converted to pyruvate (Mazurek et al, 2005). Multiple isoenzymes of PK exist in mammals: type L, found in the liver and kidneys; type R, expressed in erythrocytes; type M1, found in muscle and brain; and type M2, present in self-renewing cells such as embryonic and adult stem cells (Mazurek et al, 2005). PKM2 is also overexpressed by many tumor cells, and PKM2 expression by lung cancer cells was found to confer a tumorigenic advantage over cells expressing the PKM1 isoform (Christofk et al, 2008). While PKM1 is highly active, and would be expected to efficiently promote glycolysis and rapid energy generation, the tumor associated PKM2 is characteristically found in a less active state (Mazurek et al, 2005; Christofk et al, 2008). Initially, this observation seemed paradoxical: PKM2 represented a tumor-specific glycolytic enzyme that slowed ATP generation and antagonized the Warburg effect. However, the switch to PKM2 provides an advantage to tumor cells, because by slowing the last step of glycolysis, it allows glucose-derived carbohydrate metabolites to be diverted to other metabolic pathways. Interestingly, the oncoprotein MYC has been found to promote the expression of PKM2 over PKM1 by modulating exon splicing (David et al, 2010). MYC upregulates the expression of heterogeneous nuclear ribonucleoproteins (hnRNPs), which bind to PK mRNA, leading to preferential production of PKM2.
12.3.3 Glutamine Metabolism
Although glutamine is not an essential amino acid, cell culture medium must be supplemented with high concentrations of glutamine in order to support robust cell proliferation, and some cultured tumor cell lines derive the majority of their ATP from glutamine catabolism (Reitzer et al, 1979). More recently, it was found that oncogenic transformation can stimulate glutamine uptake and catabolism (glutaminolysis) and that many tumor cells are critically dependent on this amino acid (Wise et al, 2008). After glutamine enters the cell via specific plasma membrane transporters, glutaminase enzymes remove an ammonium ion, converting it to glutamate, which has several fates (Fig. 12–12). Glutamate can be converted directly into glutathione (GSH) by the enzyme glutathione cysteine ligase (GCL). Reduced GSH is one of the most abundant antioxidants found in mammalian cells, and is vital to controlling the redox state of all subcellular compartments. Glutamate can also be converted to α-ketoglutarate (α-KG) and enter the TCA cycle. This process, termed anaplerosis, supplies the alternative carbon input required for the TCA cycle to act as a biosynthetic hub and permits the production of other amino acids and fatty acids. Some glutamine-derived carbon can exit the TCA cycle as malate and serve as a substrate for malic enzyme 1 (ME1) which produces NADPH (DeBerardinis et al, 2007). The mechanisms regulating the fate of glutamine in tumor cells are not completely understood, and it is likely that genetic background and microenvironmental factors play a role.
FIGURE 12–12 Glutamine metabolism. Glutamine enters cells via specific transporters (SLC5A1 and SLC5A7) and is converted to glutamate by the enzyme glutaminase (GLS). Glutamate can be converted to glutathione so as to combat oxidative stress or enter the TCA cycle as a-ketoglutarate so as to provide ATP and macromolecular building blocks for cell growth and division. Key products of glutamine metabolism are shown in bold. Oncogenic proteins, including MYC, can enhance this process at several levels and render tumor cells highly dependent on exogenous glutamine.
One factor that plays a major role in regulating glutaminolysis is the oncogene MYC (see Chap. 7, Sec. 7.5.2). Thus MYC promotes not only proliferation but also the production of the macromolecules and reducing power required for cell growth and division. MYC increases glutamine uptake by directly increasing the expression of the glutamine transporters SLC5A1 and SLC7A1 (Gao et al, 2009). Furthermore, MYC indirectly increases the level of glutaminase 1 (GLS1), the key first enzyme of glutaminolysis, by repressing the expression of microRNAs-23a/b, which function to inhibit GLS1 (see Chap. 2, Sec. 2.4.3) (Gao et al, 2009). It is now clear that MYC supports antioxidant capacity by driving the production of NADPH via the PPP, by promoting the PKM2 isoform as described above, and also by increasing the synthesis of GSH through glutaminolysis. New techniques for measuring glutamine and its metabolites should soon permit the detailed examination of glutamine metabolism and MYC expression in tumors in patients.
12.3.4 Metabolic Alterations Support Balanced Redox Status
Redox status refers to the balance of the reduced versus the oxidized state of a biochemical system. In biological systems, this balance is influenced by the level of reactive oxygen species (ROS) relative to the capacity of antioxidant systems to eliminate ROS, as well as the relative concentrations of key substrates involved in oxidation reduction reactions. ROS are a diverse class of molecules produced in all cells as a normal byproduct of metabolic processes. ROS are heterogeneous in their chemical properties and cause a number of effects, depending on their concentrations. At low levels, ROS can act as signaling molecules to increase cell proliferation and survival through post-translational modification of kinases and phosphatases (Lee et al, 2002). Production of these low levels of ROS is required for homeostatic signaling events. At moderate levels, ROS induce the expression of stress-responsive genes downstream of transcription factors such as HIF-1α and NRF2, which trigger the expression of proteins providing pro-survival signals and antioxidant defense mechanisms (Gao et al, 2007). However, at high levels, ROS can overwhelm antioxidant systems, and damage macromolecules, including DNA, proteins, and lipids. Cells counteract the detrimental effects of ROS by producing antioxidant molecules such as reduced GSH and thioredoxin (TRX), along with enzymes such as superoxide dismutase and catalase. These molecules act to reduce excessive ROS so as to prevent irreversible cellular damage. Several of these antioxidant systems, including GSH and TRX, rely on the reducing power of NADPH to maintain their activities. In highly proliferative tumor cells, ROS regulation is critical because of the presence of oncogenic mutations that promote aberrant metabolism and protein translation, resulting in elevated rates of ROS production. Transformed cells counteract the accumulation of ROS by further upregulating antioxidant systems, creating a dynamic equilibrium between high levels of ROS production and high levels of anti-oxidant molecules (Trachootham et al, 2009; Fig. 12–13).
FIGURE 12–13 Relationship between ROS level and cancer. The impact of ROS on cell fate depends on ROS levels. Low levels of ROS provide a beneficial effect, supporting cell proliferation and survival pathways. However, once ROS levels become excessively high, they cause detrimental oxidative stress that can lead to cell death. To counter such oxidative stress, cells employ antioxidant systems that prevent ROS from accumulating to high levels. In cancer cells, aberrant metabolism, protein translation, and microenvironmental conditions generate abnormally high ROS levels. Through additional mutations and adaptations, cancer cells exert tight regulation of ROS and antioxidants in such a way that the cells survive and ROS are reduced to moderate levels.
12.3.4.1 Rb, PTEN, and p53 Contribute to Redox Maintenance Fully transformed tumor cells alter their metabolic pathways and regulatory mechanisms so that ROS and antioxidants are tightly controlled and maintained at elevated levels compared to normal cells. However, during the process of tumorigenesis, the initial loss of tumor suppressors may cause cells to become overloaded with the products of aberrant metabolism and lose control of redox balance. Several mechanisms downstream of commonly mutated tumor suppressors may contribute to increased oxidative stress (Fig. 12–14). For example, when the tumor-suppressor TSC2 is deleted, mTOR becomes hyperactive. This mTOR activity leads to an upregulation of protein translation and increased ROS production (Ozcan et al, 2008). Data from experimental systems indicates that cells lacking retinoblastoma (Rb) tumor-suppressor function, which normally participates in the anti-oxidant response, are more sensitive to apoptosis as a consequence of this cellular stress (Li et al, 2010). Similar results have been seen with loss of PTEN, where increased activation of AKT leads to FOXO transcription factor inactivation and increased oxidative stress because of a reduction in the antioxidant defense molecules normally maintained by FOXO (Nogueira et al, 2008).
FIGURE 12–14 Tumor suppressors influence oxidative stress. Loss of the tumor supressors tuberous sclerosis 1 (TSC), phosphatase and tensin homolog (PTEN), p53, and retinoblastoma 1 (Rb), shaded in gray, leads to increased oxidative stress by increasing ROS production or by preventing the induction and maintenance of appropriate antioxidant defense mechanisms. TSC inhibits the mammalian target of rapamycin (mTOR), reducing the oxidative stress resulting from metabolism associated with protein translation. PTEN inhibits the ability of AKT1 to inhibit the FOXO transcription factor, which also increases oxidative stress. p53 can bolster antioxidant defenses by increasing the activity of the NRF2 antioxidant trascription factor via the p21 protein, and by stimulating glutathione production by upregulating glutaminase 2 (GLS2). The oncogenic DJ1 protein can contribute to both of these pathways by inhibiting PTEN, and by helping to stabilize NRF2. The Rb tumor suppressor enhances antioxidant defenses via a number of downstream mechanisms.
The tumor-suppressor p53 may promote oxidative stress during the induction of apoptosis (see Chap. 9, Sec. 9.4.3 and Fig. 9–12), yet it also plays a significant role in reducing oxidative stress as a defense mechanism. Glutaminase 2 (GLS2) is upregulated by p53 and drives de novo GSH synthesis (Suzuki et al, 2010). Furthermore, via the p53 target gene CDK inhibitor 1A (CDKN1A), which encodes p21 (see Chap. 9, Sec. 9.2.2), p53 promotes the stabilization of the NRF2 transcription factor (see Fig. 12–14) (Chen et al, 2009). NRF2 is an important antioxidant transcription factor that upregulates the expression of several antioxidant and detoxifying molecules. Loss of p53 in a cancer cell inactivates this redox maintenance mechanism. Thus it might be possible to exploit clinically loss-of-function p53 mutations or other tumor-suppressor genes by applying additional oxidative stress, since malignant cells might be selectively killed.
12.3.4.2 DJ1 Much of our understanding of ROS and oxidative stress has emerged from the field of neurodegenerative disease. Similar mechanisms maintain appropriate redox status in both neurons and cancer cells. One protein involved in preventing neurodegeneration that has been investigated in the context of cancer is DJ1 (also known as PARK7). Similar to p21, DJ1 acts to stabilize NRF2 and thereby promotes anti-oxidant responses (Clements et al, 2006). DJ1 is mutated and inactive in several neurodegenerative disorders, most notably Parkinson disease (Gasser et al, 1997). In these disorders, it is believed that loss of DJ1 function leads to elevated oxidative stress in the brain, and increased neuronal cell death (see Fig. 12–14). DJ1 has also been described as an oncogene, and in patients with lung, ovarian, and esophageal cancers, high DJ1 expression in the tumor predicts a poor outcome (Kim et al, 2005). DJ1 stimulates AKT activity both in vitro and in vivo by regulating the function of the tumor-suppressor PTEN (see Fig. 12–14) (Kim et al, 2005). Although this function appears to be a logical candidate for the mechanism underlying a tumorigenic role of DJ1, high DJ1 expression may also promote tumor progression by reducing the oxidative stress caused by aberrant cell proliferation and thereby preventing ROS-induced cell death.
Supporting the notion that loss of DJ1 prevents appropriate redox control in cancers, an inverse correlation has been reported between cancer risk and Parkinson disease. A recent metaanalysis of patients with Parkinson disease determined that they have an approximately 30% lower risk of developing cancers compared with controls (Bajaj et al, 2010). The lower risk was associated with several different cancer types, including lung, prostrate, and colorectal cancers. Additional investigation of the cancer risk of patients with other neuro-degenerative disorders may provide key insights into potential therapeutic exploitation of the heightened need to maintain redox balance in a cancer cell.
12.3.5 Metabolic Oncogenes and Tumor Suppressors
Although many signaling pathways commonly altered in tumors have profound effects on cellular metabolism, few key metabolic enzymes themselves are consistently mutated. However, several metabolic enzymes have been shown to be important oncogenes and tumor suppressors.
12.3.5.1 Fumarate Hydratase and Succinate Dehydrogenase The TCA cycle enzymes FH and SDH have been identified as classical tumor suppressors (see Chap. 7, Sec. 7.6). Loss-of-function mutations in these enzymes cause disruption of the TCA cycle and lead to hereditary cancer syndromes, predisposing patients to paraganglioma and pheochromocytoma in the case of SDH, and to leiomyoma and renal cell carcinoma in the case of FH (Selak et al, 2005). The biochemical mechanisms responsible for driving tumorigenesis in these situations are still being clarified, but they appear to involve the induction of a pseudohypoxic phenotype, caused by inhibition of the PHD enzymes responsible for causing the degradation of HIF (Selak et al, 2005). However, other mechanisms, including an increase in ROS production and alterations to other PHD substrates, may be involved. The restricted tumor spectrum observed in these syndromes indicates that the capacity of these mutations to cause cancer may be dependent on cellular context.
12.3.5.2 Isocitrate Dehydrogenases Isocitrate dehydrogenase 1 and 2 (IDH1/2) have been identified as genes commonly mutated in glioma and acute myeloid leukemia (AML) (Mardis, 2009; Parsons et al, 2008). These genes normally function to regulate cellular redox status by producing NADPH during the conversion of isocitrate to α-KG in the cytoplasm and mitochondria, respectively. IDH1 and IDH2 are homologous, and structurally and functionally distinct from the nicotinamide adenine dinucleotide (NAD)-dependent enzyme IDH3, which functions in the TCA cycle to produce the reduced form of nicotinamide adenine dinucleotide (NADH) required for oxidative phosphorylation.
The IDH1 and IDH2 mutations associated with the development of glioma and AML are restricted to critical arginine residues required for isocitrate binding in the active site of the protein (R132 in IDH1 and R172 or R140 in IDH2) (Dang et al, 2009). Affected patients are heterozygous for these mutations, suggesting that these alterations cause an oncogenic gain-of-function. The spectrum of mutation differs in the 2 diseases, with the IDH1 R132H mutation predominating in gliomas (>90%), whereas a more diverse collection of mutations in both IDH1 and IDH2 are found in AML.
The specific mutations cause the IDH1 and IDH2 proteins to acquire a novel enzymatic activity that converts α-KG to 2-hydroxyglutarate (2-HG) in an NADPH-dependent manner (Dang et al, 2009; Gross et al, 2010). This change causes the mutated IDH1 and IDH2 enzymes to switch from NADPH production to NADPH consumption, with consequences for cellular redox balance. The product of the novel reaction, 2-HG, is a poorly understood metabolite normally present at low concentrations in cells and tissues. However, in patients bearing somatic IDH1 or IDH2 mutations, 2-HG builds up to high levels in glioma tissues, and in the leukemic cells and sera of AML patients and may be directly oncogenic (Dang et al, 2009; Gross et al, 2010).
Studies of IDH1 and IDH2 have established a new paradigm in oncogenesis: a driver mutation that confers a new metabolic enzymatic activity that produces a potential oncometabolite. The molecular mechanisms by which IDH1 and IDH2 mutations contribute to tumorigenesis are under investigation, as is the possibility that these mutant enzymes may be useful targets for therapy. Although IDH1 and IDH2 mutations are clearly powerful drivers of glioma and AML, they appear to be rare or absent in other tumor types, illustrating the importance of specific cellular context in understanding metabolic perturbations in cancer cells.
12.3.6 Autophagy
Autophagy has emerged as an important link between cellular metabolism and hypoxia in the microenvironment of solid tumors. Autophagy literally means “self-eating” and is a process that is responsible for the basal turnover (degradation) of long-lived cellular proteins. It occurs through generation of a double-membrane vesicle referred to as an autophagosome that captures cytoplasmic contents destined for degradation. The outer membrane of the autophagosome fuses with a lyso-some to form an autolysosome, resulting in the degradation of the inner membrane and its contents by enzymes present within the lysosome. The degradation products (amino acids, lipids) are delivered back to the cytoplasm and can be used in essential metabolic processes. Autophagy occurs at a low basal rate in all cells, but can be strongly induced by particular forms of cell stress, including those often present in the microenvironment of tumors.
Autophagy serves at least 2 critical cellular functions that are relevant in cancer. First, it is important for the removal and degradation of damaged organelles and misfolded protein aggregates. This includes removal of damaged mitochondria that would otherwise “leak” electrons and produce ROS through a selective form of autophagy sometimes referred to as mitophagy. The ability to remove and degrade these otherwise toxic cellular components is thought to provide a tumor-suppressor function in some instances during early tumorigenesis. Indeed, mutations in genes, such as Beclin1, that regulate the initiation of autophagy have been observed in some types of cancer. Second, and perhaps more important, autophagy plays an essential metabolic function and is required to maintain cell survival during conditions of extreme metabolic stress. Autophagy is activated as part of a “starvation” response when cells are unable to import nutrients to sustain essential metabolic pathways. In this role, autophagy functions to degrade cytoplasmic components to provide essential products for sustaining cellular metabolism and energy homeostasis. This function is particularly important within hypoxic regions of solid tumors where maintaining energy homeostasis becomes critical for cell survival, and each of the HIF, UPR, and mTOR pathways described above are capable of stimulating rates of autophagy during hypoxia (Fig. 12–15). In some tumors, activation of growth-promoting oncogenes including K-ras is sufficient to render cells constitutively dependent on autophagy for their continued survival. Thus, in most advanced cancers, autophagy rates are markedly induced and function to promote cell survival. Consequently, autophagy and the genes/pathways that regulate it, have emerged as new therapeutic targets. Current clinical strategies for inhibiting autophagy include the use of agents such as hydroxychloroquine that disrupt lysosomal pH regulation and thus prevent autolysosome formation and degradation of captured cytoplasmic content.
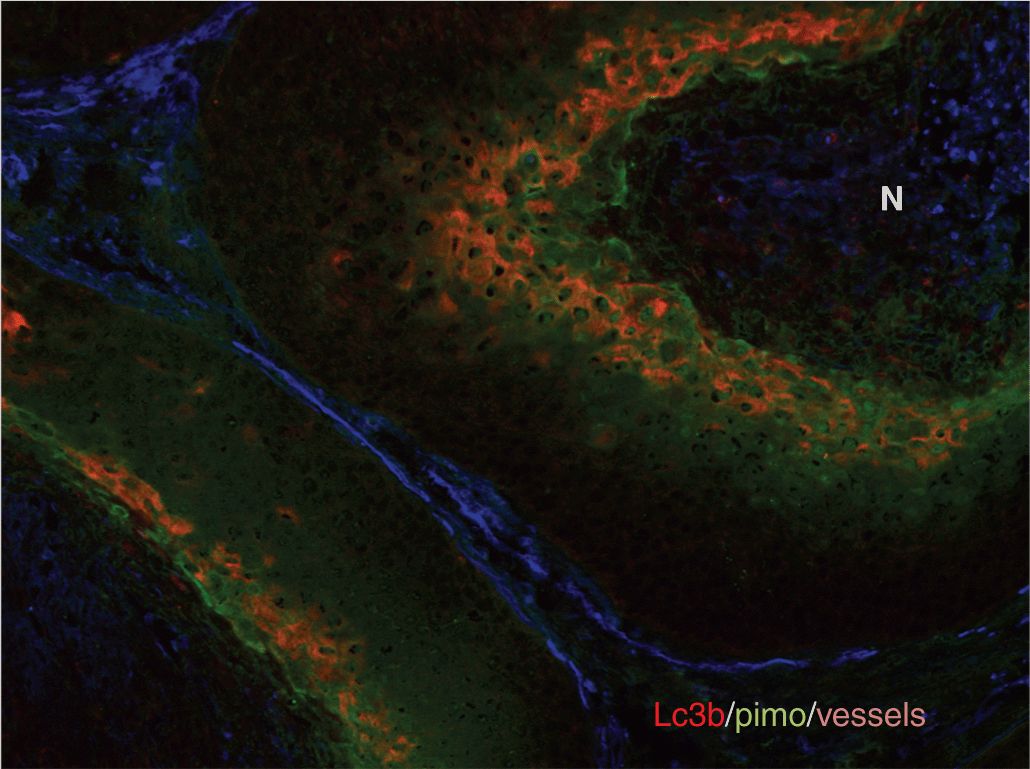
FIGURE 12–15 Hypoxia and autophagy. Immunostaining of a head and neck cancer xenograft reveals colocalization of hypoxia (green; pimonidazole immunohistochemistry) and autophagy (red; LC3 immunohistochemistry). Blood vessels are shown in blue; N = necrosis. Activation of autophagy can protect hypoxic and other tumor cells experiencing metabolic stress by promoting energy homeostasis. (From Rousc hop et al, 2010.)
Related posts:

Stay updated, free articles. Join our Telegram channel

Full access? Get Clinical Tree


