Tumor and Normal Tissue Response to Radiotherapy
16.1 INTRODUCTION
The dose of radiation that can be delivered to a tumor is limited by the damage caused to surrounding normal tissues and the consequent risk of complications. Whether a certain risk of developing complications is regarded as acceptable depends both on the function of the tissue(s) and the severity of the damage involved. This risk must be compared to the probability of benefit (ie, eradicating the tumor) to determine the overall gain from the treatment. This gain can be estimated for an average group of patients, but it may vary for individual patients, depending on the particular characteristics of their tumors and the normal tissues at risk. The balance between the probabilities for tumor control and normal tissue complications gives a measure of the therapeutic ratio of a treatment (see Sec. 16.5.8). The therapeutic ratio can be improved either by increasing the effective radiation dose delivered to the tumor relative to that given to surrounding normal tissues, or by increasing the biological response of the tumor relative to that of the surrounding normal tissues (see Figs. 16–1 to 16–3).
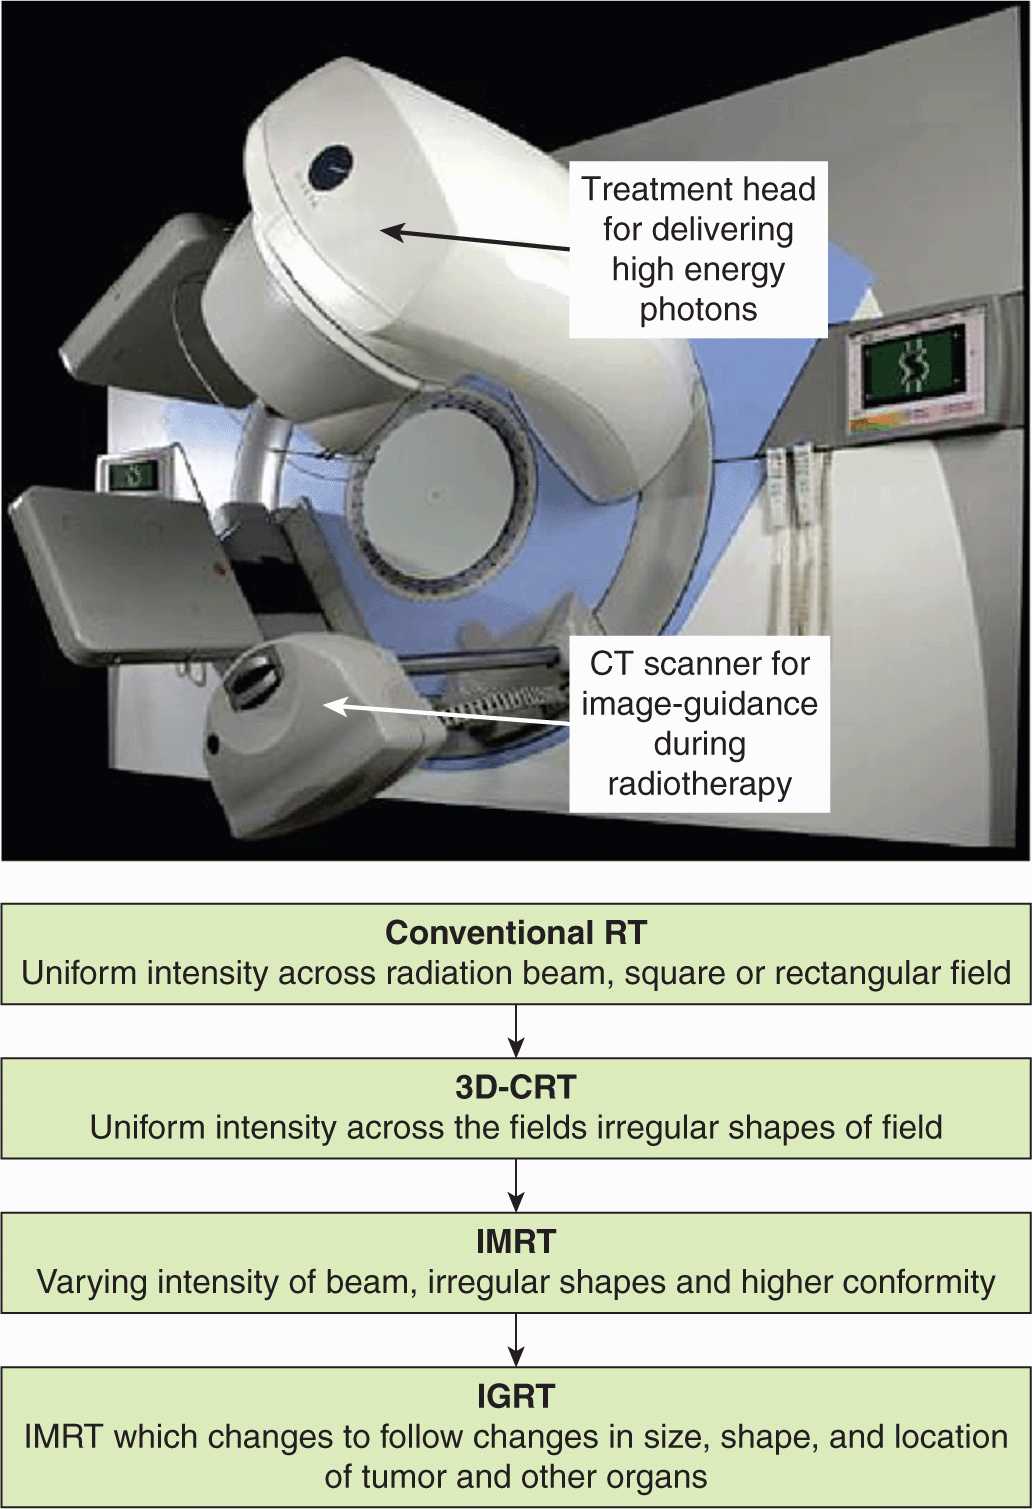
FIGURE 16–1 The evolution of modern radiotherapy planning techniques from conventional radiotherapy (RT) to 3-dimensional conformal radiotherapy (3D-CRT), to IMRT, and, finally, to image-guided radiotherapy (IGRT). For many tumor sites, IMRT and IGRT improve the therapeutic ratio by allowing for increased radiotherapy dose to tumor and decreased dose to normal tissues.
External beam radiation therapy is usually delivered in relatively small daily doses over the course of several weeks. The empiric development of such multifractionated treatments, which involve giving fractions of approximately 1.8 to 3 Gy daily for 5 to 8 weeks, is an example of exploiting biological factors to improve the therapeutic ratio. More recently, technical improvements in the physical aspects of radiation therapy have allowed an increase in the effective dose of radiation to deep-seated tumors without increasing the dose to normal tissues. Further improvements are occurring with the use of more sophisticated treatment planning methods, allowing for 3-dimensional (3D) conformal radiotherapy (3D-CRT), intensity-modulated radiation therapy (IMRT), and stereotactic treatments (Fig. 16–1). These new methods limit the volume of normal tissues irradiated to high doses and allow escalated doses to the tumor. Stereotactic body/brain radiation therapy (SBRT) uses a specially designed coordinate system for the exact localization of the tumor in the body so as to treat it with limited, but highly precise, treatment fields. SBRT involves the delivery of a single high-dose radiation treatment or a few (large-dose) fractionated radiation treatments (usually up to 5 treatments). A highly potent biological dose of radiation is delivered to the tumor over this period and has been used for individual brain or vertebral metastases or for small lung tumors (Milano et al, 2008). Finally, low-dose-rate and highdose-rate brachytherapy can highly conform dose by placing radioactive sources directly within or adjacent to tumors (see Fig. 16–2). Although these newer treatment strategies improve the efficiency of radiation therapy delivery, they may also provide opportunities to exploit biological factors. Examples are the continuing exploration of ways to exploit the oxygen effect to cause greater tumor cell killing and more recent efforts to develop drugs that can protect normal tissue from effects of irradiation (without affecting tumor response). Biological factors that may influence the outcome of radiation therapy and their exploitation to improve therapy are discussed in this chapter.
16.2 PRINCIPLES OF CLINICAL RADIOTHERAPY
16.2.1 Radiotherapy Dose
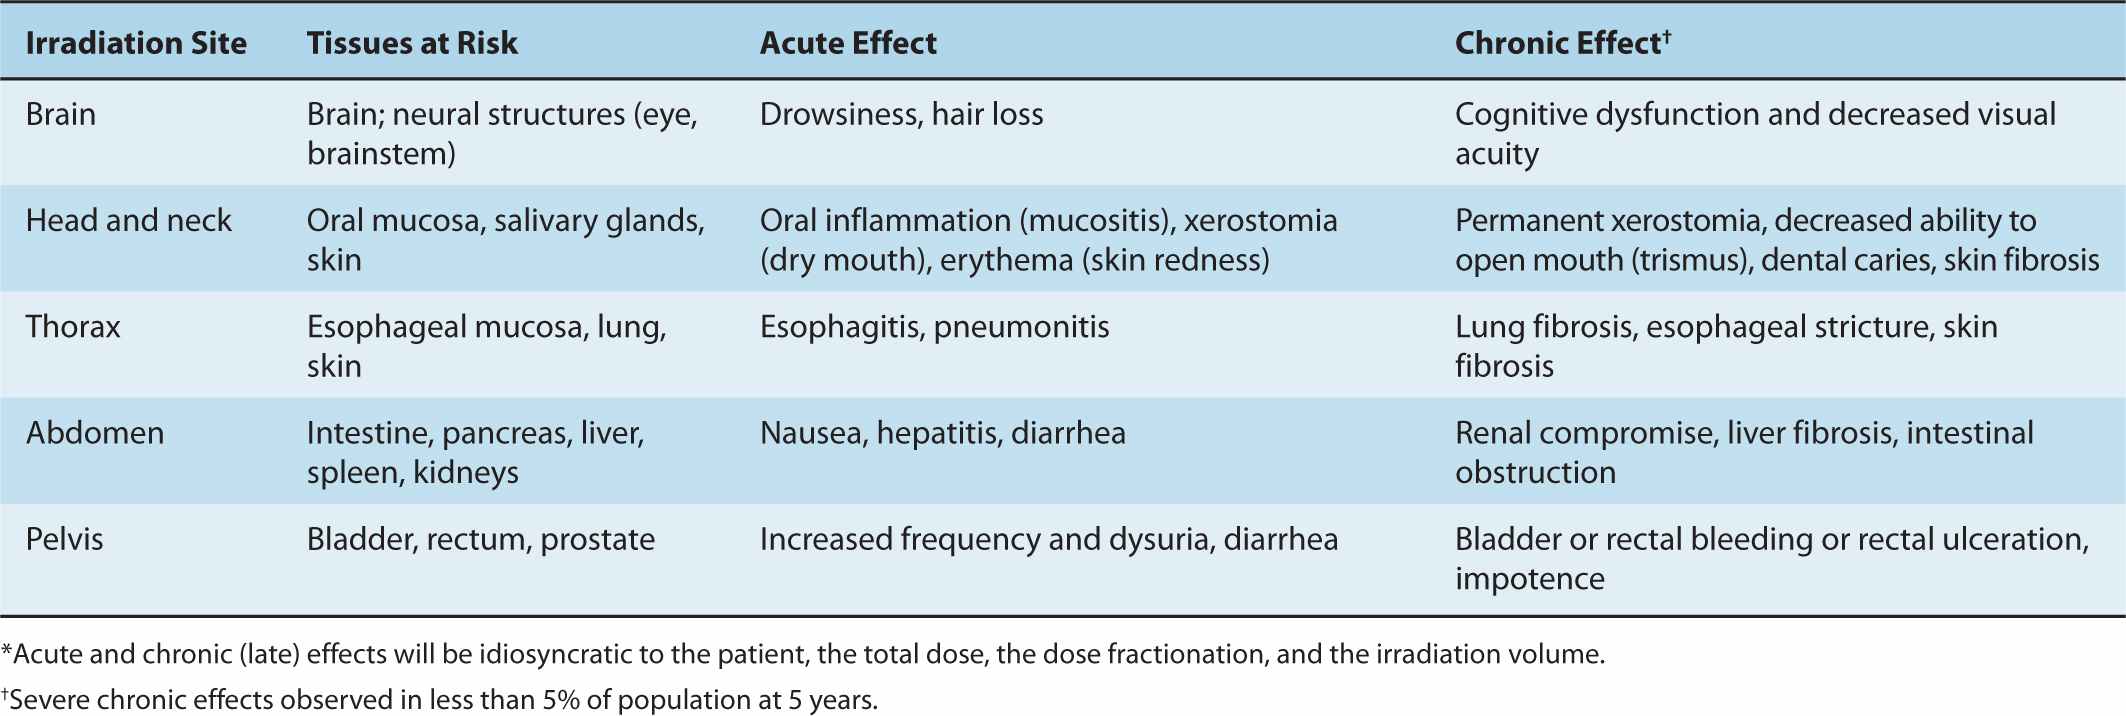
As discussed in Chapter 15, radiotherapy involves both external-beam radiotherapy and brachytherapy; treatment choice depends on the type of tumor and location within the body. The dose of radiation is determined by the int ent of the therapy (ie, curative or palliative), the volume of tumor, the relative radiosensitivity of the tumor cells and expected toxicity to the surrounding normal tissues. Other factors relate to the condition of the patient, including age and other health problems that might increase the side effects of radiotherapy (eg, inflammatory and connective tissue disorders). The acute and chronic side effects that may occur following local radiotherapy are linked to the normal structures and tissues within the irradiated volume (Table 16–1); these effects increase with the volume of the irradiated field and with the size of the dose fractions. For example, head and neck irradiation can lead to altered swallowing or a dry mouth (xerostomia), whereas irradiation of pelvic structures may lead to a change in bladder and bowel function. Whole-body radiotherapy, which is sometimes given in addition to chemotherapy during bone marrow transplantation, can lead to nausea and vomiting, decreased blood counts, and altered humoral and cell-mediated immune responses (see Sec. 16.5; Chap. 21, Secs. 21.2 and 21.3).
TABLE 16–1 Severe acute and chronic side effects of radiotherapy.*
Most curative radiotherapy regimens consist of daily treatments or fractions in the range of 1.8 to 3 Gy per day over a period of 5 to 8 weeks. The intent is to achieve local control of the tumor, thereby preventing local tissue destruction, organ failure, and the seeding of secondary metastases. Using modern planning techniques (see Sec. 16.2.2) doses up to approximately 75 Gy to the tumor can usually be achieved without causing severe side effects. There are substantial data to indicate that increased radiotherapy dose is associated with increased local control (Armstrong, 2002; Suit, 2002). Typically, the dose to normal tissues is limited so that severe complications occur in no more than 5% of the surviving patients after a period of 5 years (known as the TD5/5 value). However, this dose limit may be increased if radiotherapy is the only curative treatment option for the patient. Palliative radiotherapy is given when the disease is incurable but there is a need to achieve better pain control, to control bleeding, or to prevent tissue destruction or ulceration. These radiotherapy treatments are usually of short duration and consist of 1 to 3 fractions of 5 to 8 Gy or 5 to 10 fractions of 3 to 4 Gy.
16.2.2 Radiotherapy Planning and Dose Delivery
Conformal radiotherapy employs 3D treatment planning using a series of specific radiation beams given from different angles to maximize tumor dose while minimizing normal tissue irradiation. IMRT is an alternative method that uses a computerized algorithm to design optimal beam orientations and intensities. With IMRT, the individual radiation beams are shaped using special collimators that move during the time of irradiation, so that relatively high-dose volumes of irradiation are contoured to treat the tumor. The combination of multiple beams then allows for better dose distributions resulting in a decreased volume of normal tissue in the high dose region (Bauman et al, 2012).
Both types of planning use magnetic resonance imaging (MRI) or computed tomography (CT) scans or other imaging to localize the tumor and critical normal tissues (see Chap. 14, Sec. 14.3). The energy type (see Chap. 15, Sec. 15.2) and number of radiation beams and their orientation are then chosen. Successful delivery is tracked during treatment using verification images. The extent of the tumor is defined as the gross tumor volume (GTV), but the final radiation plan will deliver the maximum dose to a slightly larger radiation volume (the planning target volume [PTV]). The PTV accounts for microscopic disease just beyond the detectable edge of the tumor, for body or organ movement, and for dose gradients that occur at the edge of the radiation beam (the “penumbra”) where the dose decreases rapidly. Special techniques and markers are sometimes used to track organ movement within the body (eg, movement of a lung tumor during normal breathing), thereby increasing the accurate targeting of the radiation dose. This type of imageguided radiation therapy (IGRT) uses serial 2- and 3-dimensional imaging to optimize the treatment coordinates during a course of radiation treatment (Dawson and Sharpe, 2006). For small, anatomically accessible tumors, high doses of finely localized irradiation can also be delivered through the use of brachytherapy (Fig. 16–2; discussed in Sec. 16.2.3) or stereotactic body or brain radiosurgery. The latter uses highly focused irradiation beams of charged particles (eg, proton beams; see Sec. 16.2.4), γ-rays, or high-energy x-rays precisely targeted to the tumor site.
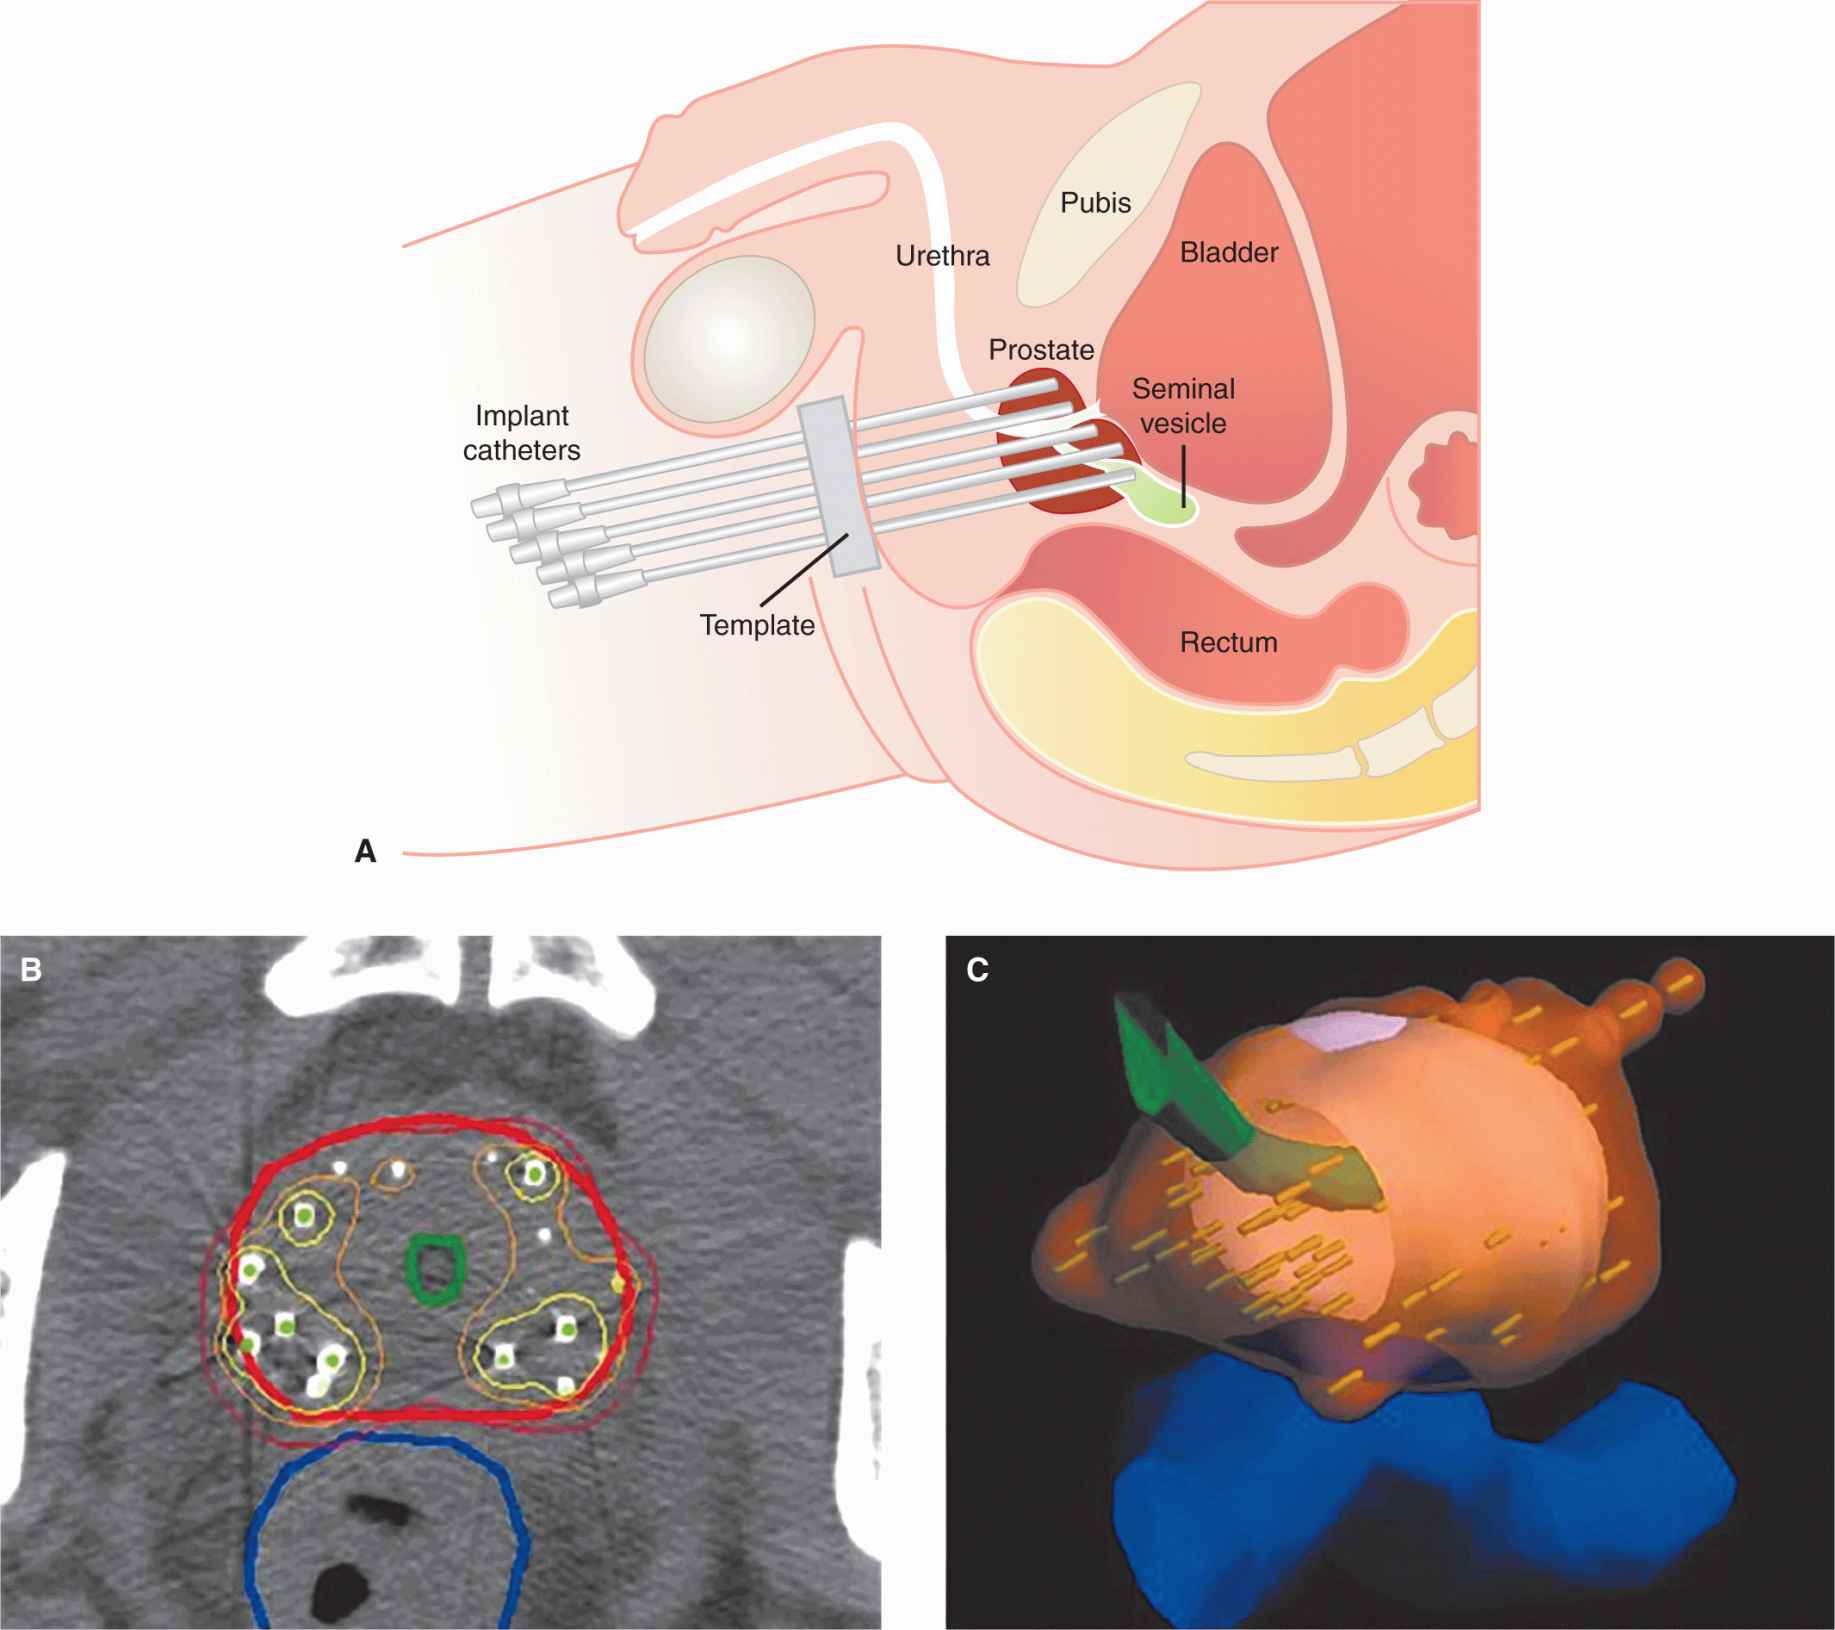
FIGURE 16–2 Images of a prostate gland treated with high-dose rate radiotherapy using catheters placed into the prostate gland (A) through the patient’s perineum. B) CT image near middle of prostate overlaid with contours delineating prostate (red), urethra (green), and rectum (dark blue). Also shown are isodose lines corresponding to 100% (red), 150% (orange), and 200% (yellow) of the prescribed dose of 145 Gy. C) 3D rendering of the 145-Gy isodose surface (translucent orange) covering the prostate.
Determination of the relationship between normal tissue response and dose is often confounded by the nonuniform dose distribution within the normal organs. However, a dose-volume histogram (DVH) can be generated as part of a modern radiotherapy plan for each exposed organ in a patient (see Sec. 16.2.4 and Fig. 16–3). Several models have been proposed for predicting normal tissue response to radiotherapy using such histograms. However, the quality of clinical data available for such predictions is rarely sufficient to alter radiotherapy practice. Nonetheless, in prostate cancer radiotherapy, for example, DVH plots can be used to show that the volume of the anterior rectum irradiated to high doses is directly correlated to late complications within the rectum (Bauman et al, 2012; Budaus et al, 2012). One important complexity with IMRT plans is that increased volumes of normal tissue are exposed to lower doses and this raises concerns about increased radiation-induced second malignancies (see Sec. 16.8).
16.2.3 Brachytherapy, Radionucleotides, and Radioimmunotherapy
Low-dose rate (LDR; dose rates of up to ~2 Gy/h) radiation sources placed into or beside the tumor (known as brachytherapy) can be used, either alone or in combination with external beam radiotherapy, to treat accessible tumors such as those of the cervix, prostate, head and neck, breast, bladder, lung, esophagus, and some sarcomas. Close to the implanted brachytherapy source the radiation dose is high, leading to effective killing of tumor cells, whereas normal cell killing is less at increasi ng distances from the source as a result of lower doses (and dose rates) (see Fig. 16–2). The cellular effects of continuous LDR irradiation (described in Chap. 15, Sec. 15.4.2) are similar to those of reducing fraction size and thereby allow for cellular repair in normal tissues (see Sec. 16.6.1 and Fig. 16–20). Computer-controlled brachytherapy systems can deliver radiation doses as short high-dose pulses (pulsed-dose brachytherapy) or with a highdose rate (HDR brachytherapy; rate of dose delivery exceeds 12 Gy/h). The high-dose source travels along a catheter track within the tumor. By varying the position and dwell time of the radiation source, the dose is neatly sculpted to conform to the shape of the target. The patient typically receives the total dose in a series of 1 to 10 treatments. HDR brachytherapy uses a relatively intense source of radiation (eg, iridium 192) delivered through temporarily placed applicators. The benefits of HDR brachytherapy, compared to manual-loaded brachytherapy techniques, can include treatments being planned after the applicator placement, but before radiation delivery, helping to improve treatment efficacy and safety, and a rapid dose delivery, which can lead to decreased outpatient visits for treatments. Radiobiological modeling suggests that the acute and late reactions with pulsed-dose brachytherapy are similar to traditional (continuous) brachytherapy as long as the gaps between pulses are less than 1 hour (Brenner and Hall, 1991).
The use of injected radionucleotides to treat cancer is based on their selective uptake by tumors or adjacent normal tissues, so that local irradiation may lead to death of the tumor cells. Examples are 131I to treat well-differentiated thyroid cancer, radiolabeled somatostatin analogs for the treatment of neuroendocrine tumors, and 89Sr or 223Ra to treat bone metastases, mainly in prostate cancer (Autio et al, 2012); the latter isotopes are chemically similar to calcium and thus taken up selectively into bone where they can irradiate and cause death of neighboring cancer cells. The conjugation of radioisotopes to specific antibodies or to agents that bind to receptors on cancer cells allows targeted radiotherapy to tumors expressing the relevant antigens or receptors and is termed radioimmunotherapy (RIT). Optimal radioisotopes are those emitting a-particles and short-range electrons (ie, β-particles) resulting in the killing of cells within a radius of 1 to 3 cell diameters of the bound isotope (eg, 111Indium). In animal models, RIT was found to kill disseminated solid tumor cells and small metastases when targeting differentiation antigens (eg, CD20 or CD21) on lymphomas, somatostatin receptors on neuroendocrine tumors, or epidermal growth factor receptors (EGFRs) on certain breast cancers. However, in patients, this approach has been limited by the lack of specific uptake in tumor cells when compared to normal cells and the attendant difficulty of accurate dosimetry and treatment planning. Clinical success has so far been achieved mostly with radiolabeled antibodies against CD20 (131I-tositumomab and 90Y-ibritumomab) for the treatment of relapsed or refractory CD20+ follicular B-cell non-Hodgkin lymphoma or consolidation therapy in patients with follicular non-Hodgkin lymphoma that achieve a partial or complete response to first-line chemotherapy. The predominant complication of RIT is hematological toxicity, but this is usually manageable (Pouget et al, 2011).
16.2.4 High Linear Energy Transfer Radiotherapy: Protons and Carbon Ions
Particle therapy is a form of external-beam radiotherapy using beams of energetic protons, neutrons, or positive ions for cancer treatment. The most common type of particle therapy is proton therapy. Particle therapies may have high linear energy transfer (LET) and might contribute to improvements in the therapeutic ratio in several ways. First, because much of the energy of particle beams is deposited in tissue at the end of particle tracks (Fig. 16–3) (ie, in the region of the Bragg peak; see Chap. 15, Sec. 15.2.2), they can give improved depth-dose distributions for deep-seated tumors. Neutron beams do not demonstrate a Bragg peak and depth-dose distributions are similar to those for low-LET radiation. Heavy ion therapy, for example, using carbon ions, is being investigated in a number of centers across the world. These beams have higher LET than protons and increased relative biological effectiveness (RBE; see Chap. 15, Sec. 15.3.1).
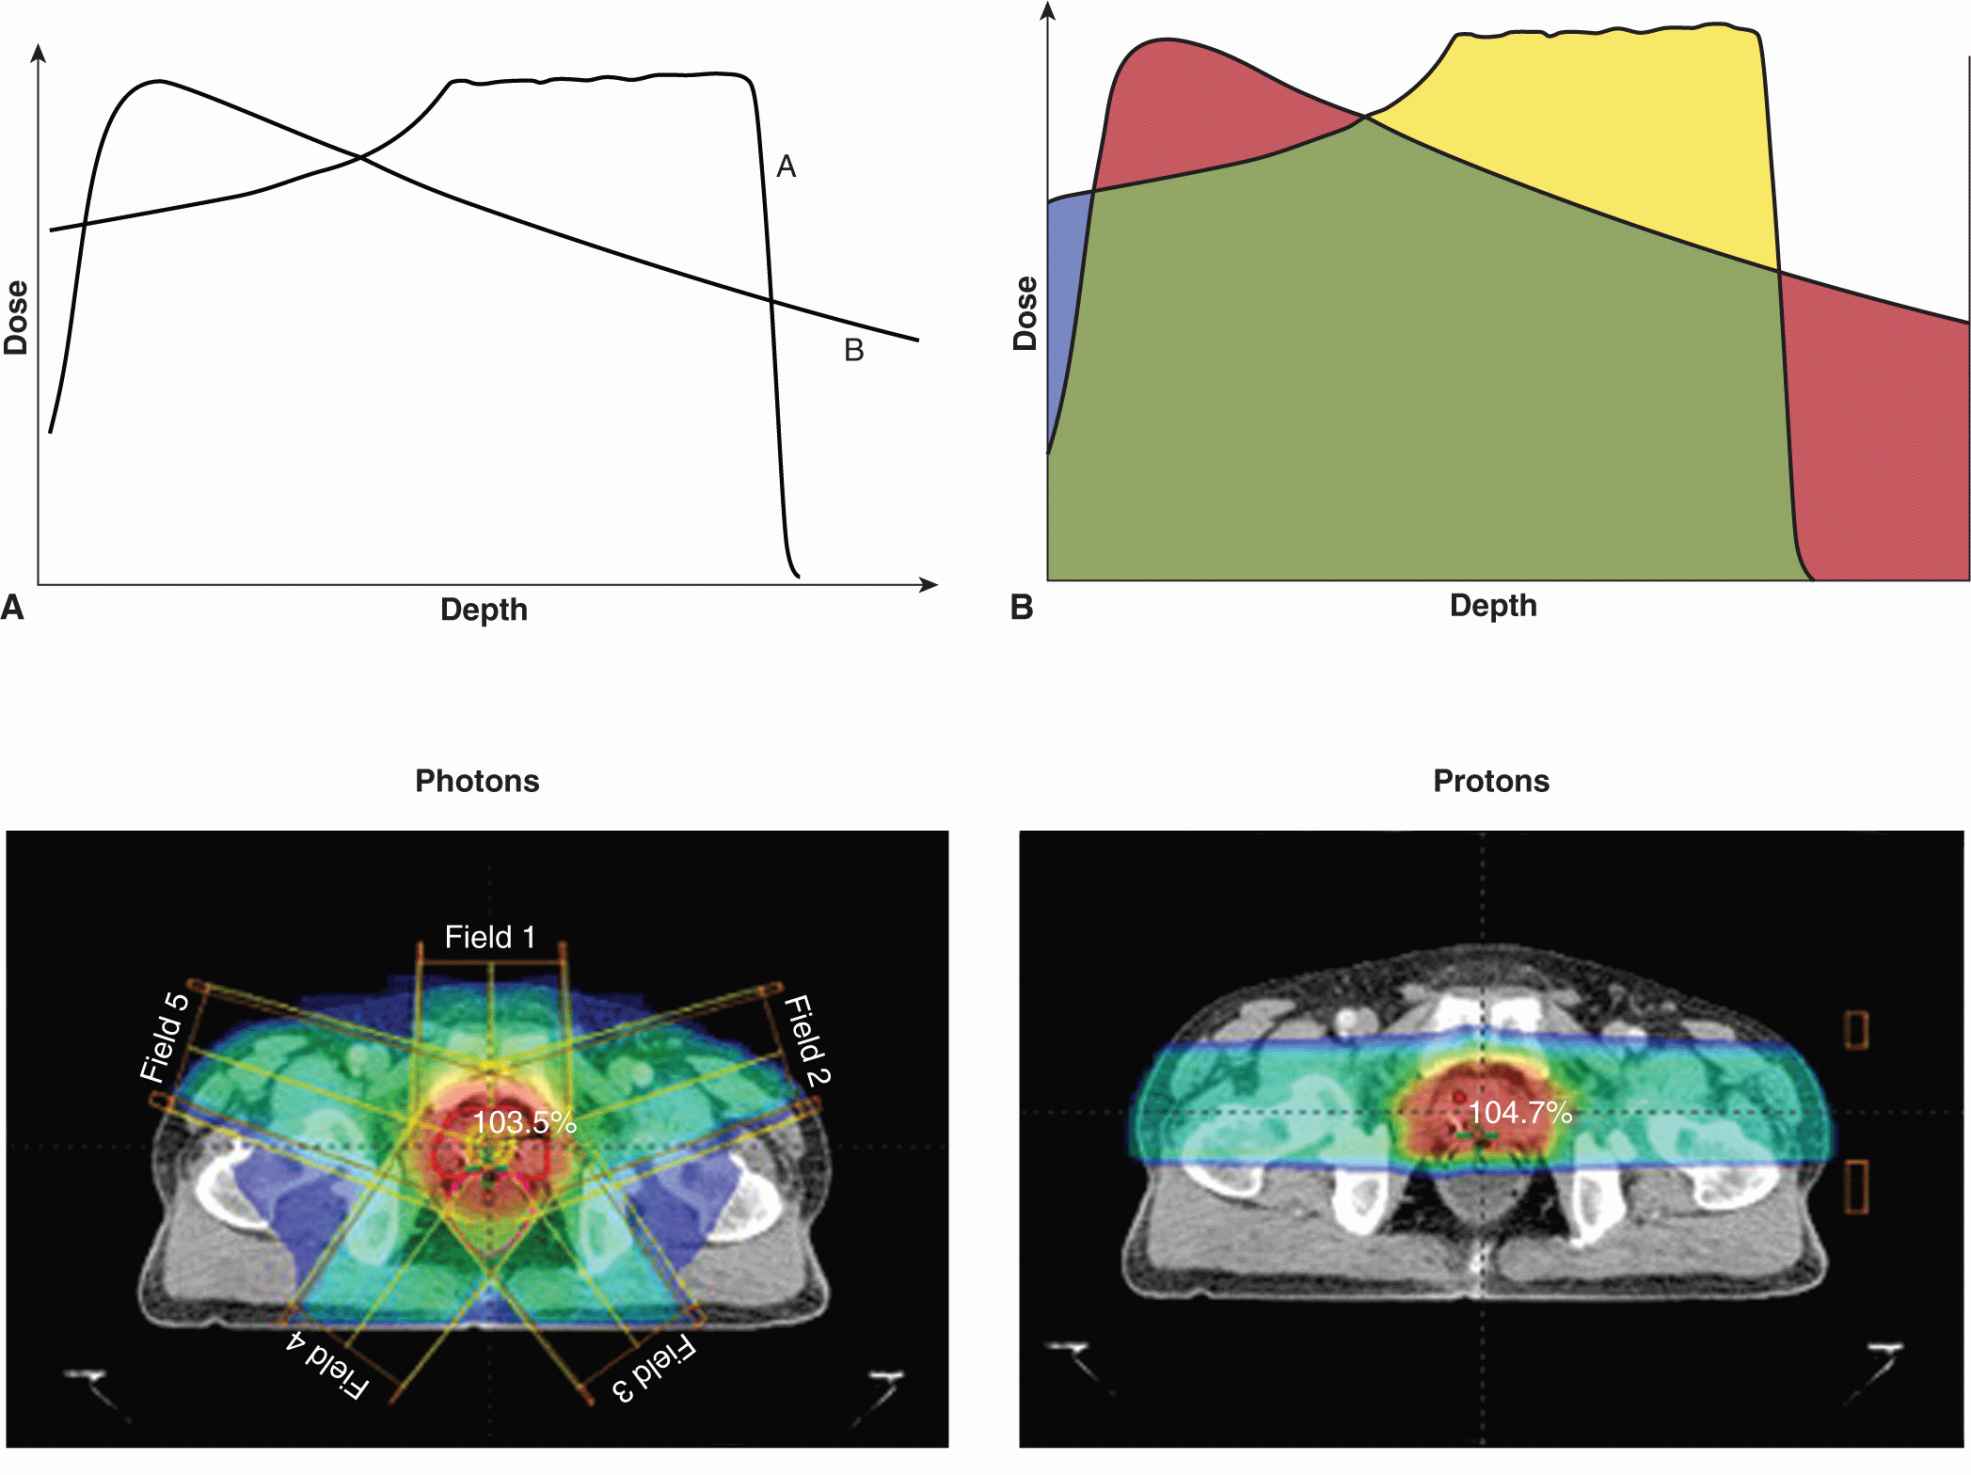
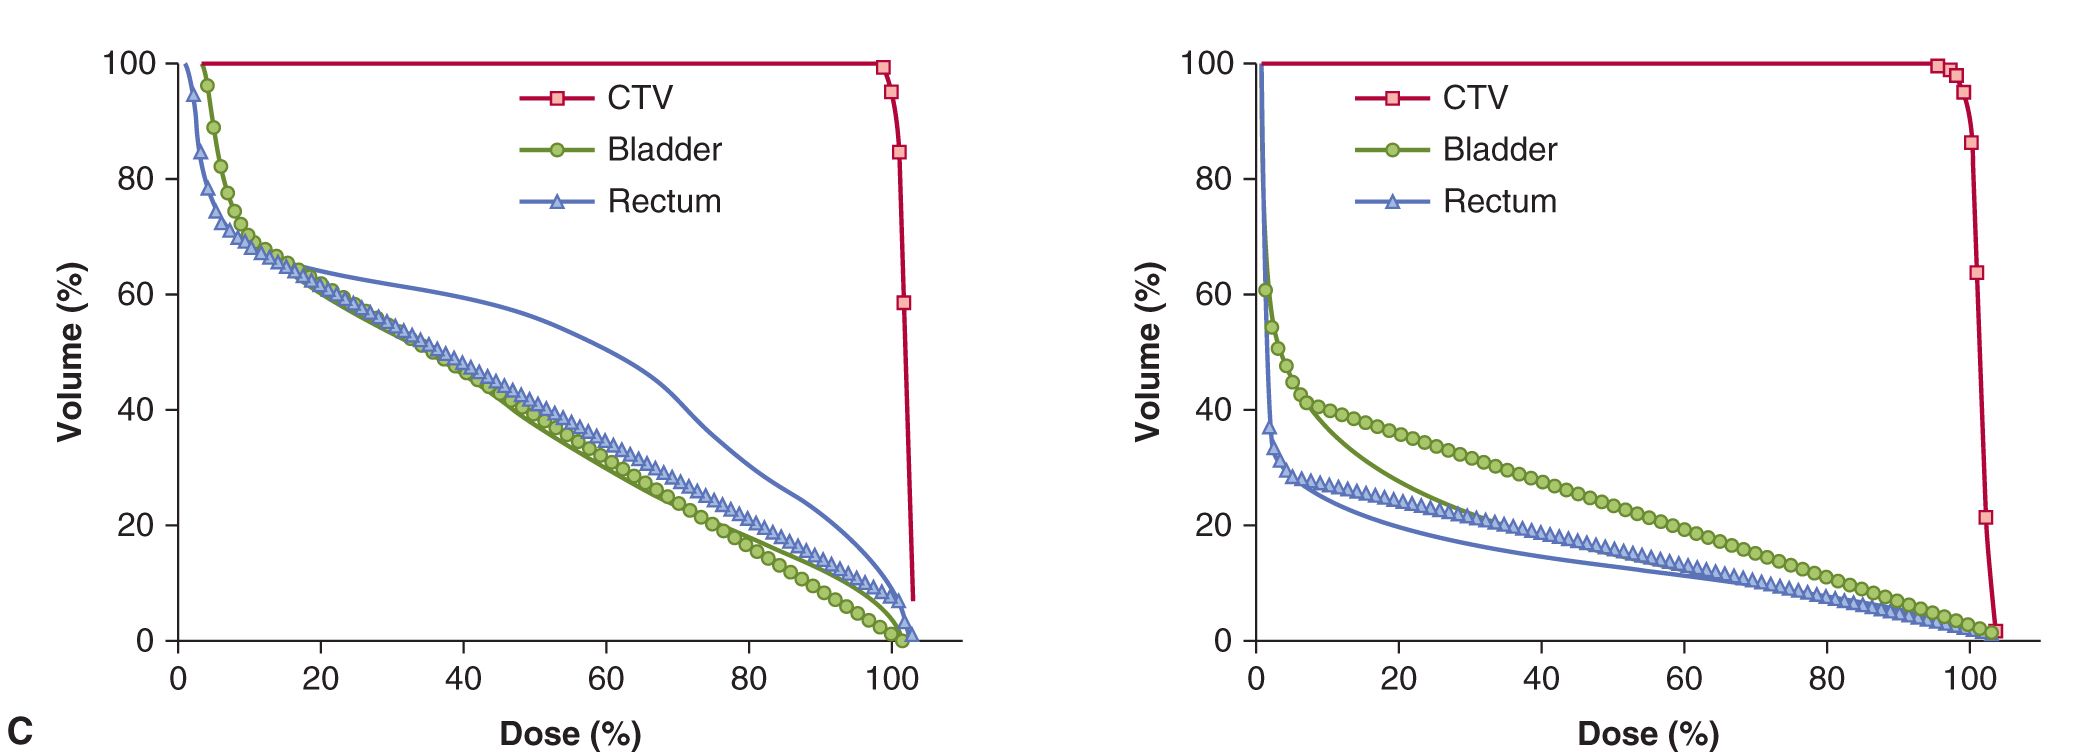
FIGURE 16–3 A) Generalized depth dose curves for a high-energy photon (6MV or above) and a modulated-energy proton beam. The proton beam (A) delivers its dose at increased depth as compare to a high-energy photon beam (B). B) Illustration of differences between photon and proton depth dose distribution (red, dose delivered by the photon beam that is greater than that delivered by the proton beam; green, same dose from both photon and proton beams; blue, dose delivered by proton beam but not photon beam; gold, dose delivered to defined target by protons but not by photons). C) Comparison of isodose distributions and dose volume histograms (DVH) for protons versus photons for a typical prostate cancer radiotherapy plan. The 5-beam photon plan shows increased volumes (y-axis on plot) of bladder and rectum being irradiated for increasing percentage of the total dose delivered (x-axis on plot) when compared to the use of a 2-beam proton plan (CTV, clinical tumor volume to be treated with the total radiotherapy dose).
The therapeutic ratio may also be improved by particle therapies because the oxygen enhancement ratio (OER) is reduced at high LET (see Sec. 16.4.1), so that hypoxic cells in tumors are protected to a lesser degree. The variation in radiosensitivity with position in the cell cycle (see Chap. 15, Sec. 15.4.1) is also reduced for high-LET radiation and, in general, there is reduced variability in response between different cells. This is partly because cells exhibit reduced capacity for repair following high-LET radiation relative to that following low-LET radiation, leading to an increase in RBE (see Chap. 15, Sec. 15.3.1). Compared to protons, carbon ions have the disadvantage that beyond the Bragg peak, the dose does not decrease to zero, because nuclear reactions between the carbon ions and the atoms of the tissue lead to production of lighter ions that have increased range.
One potential difficulty in using high-LET radiation is that because late-responding tissues demonstrate greater repair capacity than early responding tissues (see Secs. 16.7.1 and 16.7.2), the reduction in repair capacity following high-LET irradiation will result in relatively higher RBE values for late-responding normal tissues. However, the ability to deliver dose in a finely focused manner using protons or heavy ions combined with IMRT planning techniques reduces the volume of normal tissue exposed to high doses, limiting this concern. Results with protons demonstrate an advantage for treatment of some tumors, such as choroidal melanomas and skull-base tumors (Suit, 2002), that require precise treatment of a highly localized lesion, and in pediatric tumors where the dose to normal structures should be decreased as much as possible to avoid developmental side-effects during development (DeLaney, 2011).
There have been extensive clinical studies using high-energy neutrons, but such treatments have been associated with an increase in complications, particularly subcutaneous fibrosis, and randomized trials have not demonstrated therapeutic gain (Fowler, 1988; Raju, 1996); thus there is limited current use of such therapy. An alternative approach is boron neutron capture therapy (BNCT), in which compounds enriched with 10B are administered prior to irradiation with a lower-energy (thermal) neutron beam. Neutrons interact preferentially with the 10B atoms in the tumors, and, a fission reaction produces high-energy charged particles (7Li and 4He), resulting in tumor cell killing. For an improved therapeutic ratio with BNCT, relatively high concentrations of 10B must be achieved in the tumor, with low concentrations in normal tissues. New boronated compounds and new strategies for delivering them are needed to improve the differential concentrations achievable in tumors and surrounding normal tissues, but encouraging results have been obtained, particularly for the treatment of brain tumors (Yamamoto et al, 2008; Barth, 2009). However, the depth-dose distribution for the thermal neutron beam is relatively poor and this remains a serious limitation in the clinical use of this treatment for deep-seated tumors.
16.2.5 Combining Radiotherapy with Other Cancer Treatments
Radiotherapy is increasingly used with other cancer treatments, including surgery and drug therapy with hormones, chemotherapy, or molecular targeted agents. Combining radiotherapy with surgery can improve outcome by sterilizing microscopic or residual disease within, and just beyond, the surgical bed. Alternatively, surgery can be used as salvage therapy in patients where the use of radiotherapy alone was not sufficient to control the tumor locally. Concomitant chemotherapy is used for treatment of locally advanced head and neck, lung, and cervical cancers to increase the probability of cure or local control by radiotherapy, and concomitant hormone therapy is used to improve survival of men with locally advanced prostate cancer. Results from preclinical local tumor control experiments suggest that multiple radiobiological mechanisms might contribute to an improved therapeutic ratio with this approach, including the prevention of tumor cell repopulation, decreased number of clonogenic tumor cells, increased cellular radiation sensitivity, improved reoxygenation of clonogenic tumor cells during the combined treatment, and killing of circulating endothelial precursor cells that might replace tumor vasculature destroyed during radiotherapy (Zips et al, 2008; Ahn and Brown, 2009; Begg et al, 2011). Important interactions between radiation and chemotherapy in tumor and normal tissues are reviewed in Chapter 17, Section 17.6.4.
Increasingly, molecular-targeted agents that can sensitize tumors to radiotherapy are being combined with radiotherapy; this is discussed in Chapter 15, Section 15.4. A specific example of the clinical application of such an approach is the phase III randomized study that demonstrated that the EGFR inhibitor cetuximab given concomitantly with radiotherapy for head and neck cancer, improved locoregional control and overall survival without increasing mucosal toxicity (Fig. 16–4) when compared to radiotherapy alone (Bonner et al, 2010). The use of an EGFR inhibitor was thought to combat tumor cell repopulation during radiotherapy as the basis for the improved therapeutic ratio for this combination (Zips et al, 2008). Newer Phase III clinical trials are assessing the benefit of adding cetuximab to the current standard regimen of cisplatin and radiotherapy, but increased toxicity of the 3 agents when combined may limit this modality approach (Walsh et al, 2011). Other trials are assessing the benefit of chemotherapy and or/cetuximab added to radiotherapy for human papillomavirus (HPV)-positive versus HPV-negative cancers, given the reported increased sensitivity of HPV-positive head and neck cancers to fractionated radiotherapy (Ang et al, 2010). Biomarkers that reflect the HPV status of the tumor (eg, HPV viral or P16INK4a gene expression) predict patients with differing prognosis following radical radiotherapy (Ang and Sturgis, 2012).
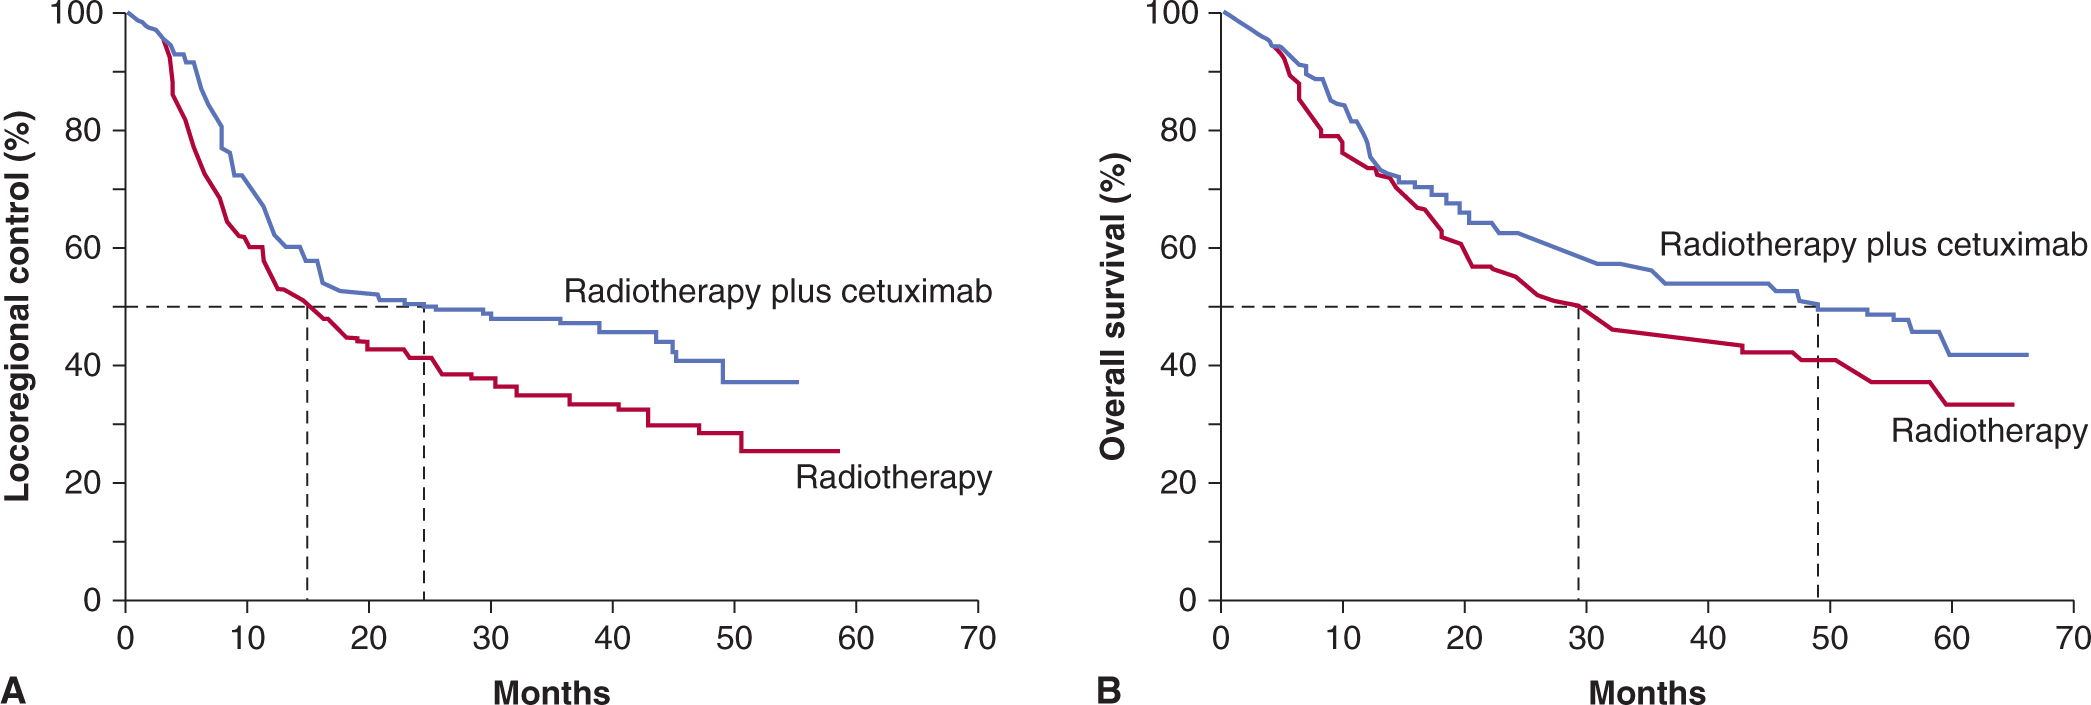
FIGURE 16–4 Kaplan-Meier estimates of (A) locoregional control and (B) overall survival among all patients randomly assigned to radiotherapy plus cetuximab or radiotherapy alone. (Redrawn from Bonner et al, 2006 with permission.)
In another example, histone deacetylase (HDAC) inhibitors, such as vorinostat, that have shown radiosensitizing activity in preclinical tumor models are being assessed in patients. A recent Phase I study has shown that vorinostat can be safely combined with short-term pelvic palliative radiotherapy and may therefore be of benefit in long-term curative pelvic radiotherapy as a component of preoperative chemoradiotherapy for rectal cancer (Ree et al, 2010). Similar efforts are ongoing across many tumor types receiving radiotherapy in Phase I to III trials, where the effectiveness of a molecular-targeted agent is being matched to a biomarker of radioresistance (Begg et al, 2011). Any benefit of combined modality therapy will be predicated on improving the therapeutic ratio in which the molecular agent does not add radiotoxicity to normal tissues.
16.3 TUMOR CONTROL FOLLOWING RADIOTHERAPY
16.3.1 Dose Response and Tumor Control Relationships
The emphasis in Chapter 15 on the molecular and cellul ar effects of radiation treatment reflects a view that the response of tumors can be understood largely in terms of the sensitivity of the cancer cells within those tumors. However, there is increasing evidence that the extracellular environment in tumors can play a substantial role in their response to treatment (Hanahan and Weinberg, 2011). For radiation, hypoxia is known to play an important role in tumor response (see Sec. 16.4.2; Chap. 12, Sec. 12.2). Consequently, techniques that assess tumor response in situ rather than measuring the survival of tumor cells after removing and dissociating the tumor are important (Fig. 16–5). The size of untreated and irradiated tumors can be measured as a function of time to allow the generation of growth curves (Fig. 16–5A). The delay in growth is the difference in time for treated and untreated tumors to grow to a defined size, and this time difference can be plotted as a function of radiation dose, as shown for single-dose treatments in Figure 16–5B. The curve shown in Figure 16–5B is drawn to show a change in slope, consistent with the presence of a fraction of hypoxic cells in the tumor (see Sec. 16.4.2). At higher radiation doses, some tumors will be permanently controlled. If groups of animals receive different radiation doses to their tumors, the percentage of controlled tumors can be plotted as a function of dose to give a dose-control curve as shown in Figure 16–5C.
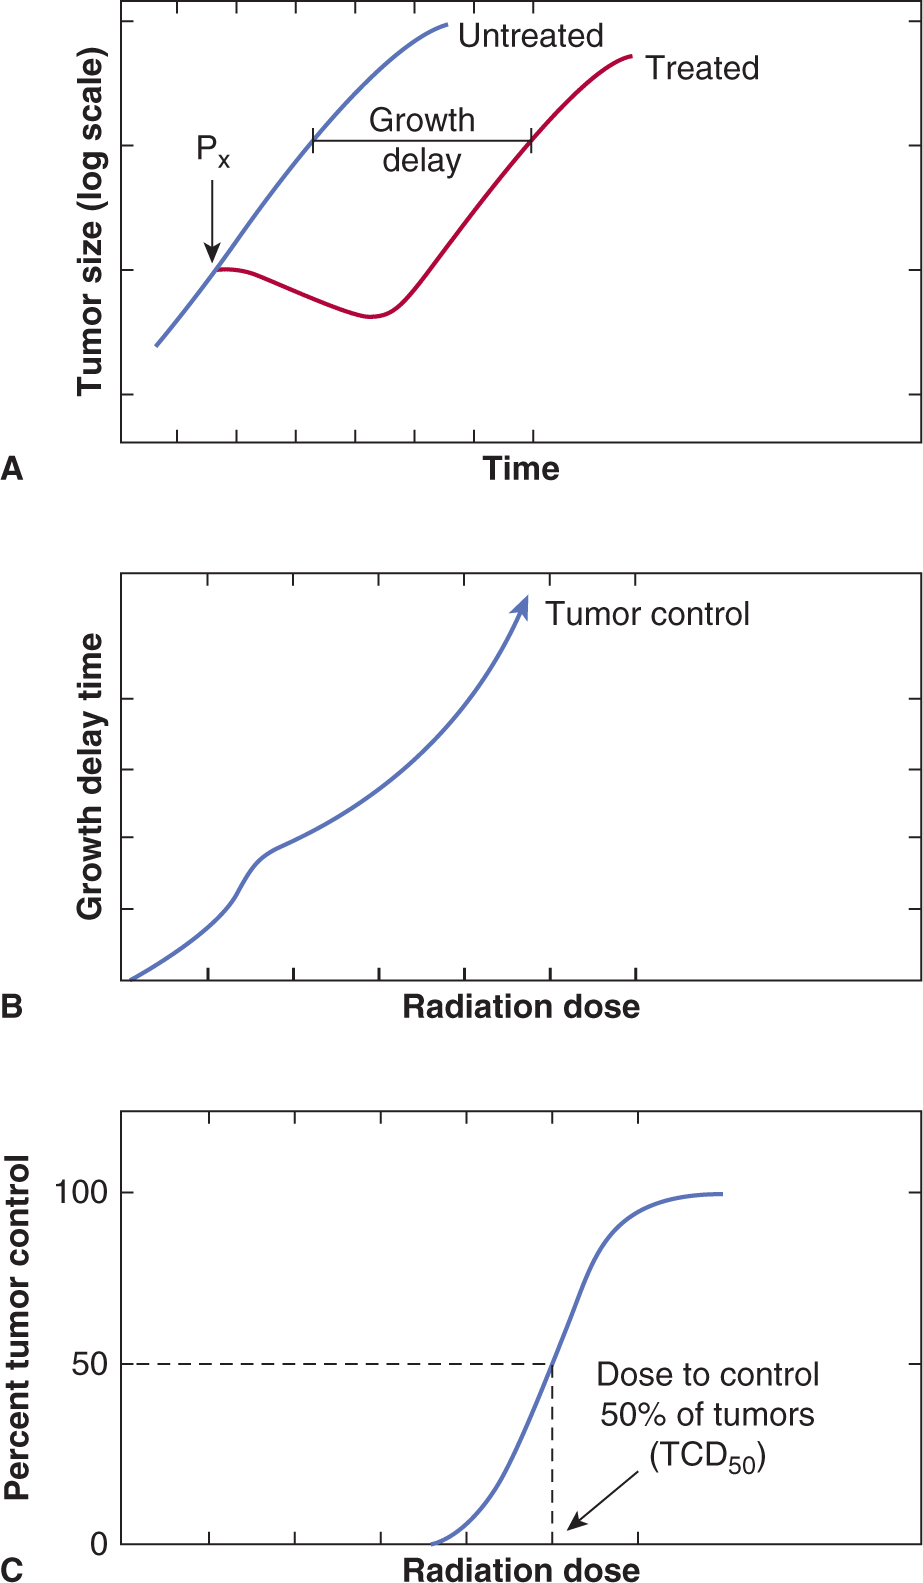
FIGURE 16–5 Illustration of 2 assays for tumor response. In (A), growth curves for groups of treated and untreated tumors are shown and the measurement of growth delay indicated. Growth delay is plotted as a function of radiation dose in (B). At large doses, some of the tumors may not regrow and the percentage of controlled tumors can be plotted as a function of dose as in (C).
The concept that tumors contain a fraction of cells that have unlimited proliferative capacity (ie, cancer stem cells [CSCs]) was introduced in Chapter 13. As discussed in that chapter, there are uncertainties about the properties of such cells and about the plasticity of the CSC phenotype, but, because cells expressing a CSC phenotype are the ones that can regenerate the tumor after treatment, their radiosensitivity is critical to achieving tumor control. For a simple model, which assumes that the response of a tumor to radiation depends on the individual responses of the cells within it, the dose of radiation required to control a tumor only depends on (a) the radiation sensitivity of the CSCs and (b) their number. From a knowledge of the sensitivity of the CSCs in a tumor, it is possible to predict the expected level of survival following a given single radiation dose. A simple calculation, using Appendix Equation 15.4 in Appendix 15.1 (see Chap. 15) and typical survival curve parameters for well-oxygenated cells (D0 = 1.3 Gy, Dq = 2.1 Gy), indicates that a single radiation dose of 26 Gy might be expected to reduce the probability of survival of an individual cell to approximately 10–8. For a tumor containing 108 CSCs, this dose would thus leave, on average, 1 surviving CSC. Because of the random nature of radiation damage there will be statistical fluctuation around this value. The statistical fluctuation expected from random cell killing by radiation follows a Poisson distribution; the probability (Pn) of a tumor having n surviving CSCs when the average number of CSCs surviving is a is given by:
![]()
For tumor control, the important parameter is P0, which is the probability that a tumor will contain no surviving CSCs (ie, n = 0). From Equation 16.1:
![]()
For a = 1, as in the example above, the probability of control would be e– = 0.37. Different radiation doses will, of course, result in different values of a and it is possible to construct a theoretical curve relating the probability of tumor control with dose, which shows a sigmoid relationship (Fig. 16–6, solid lines).
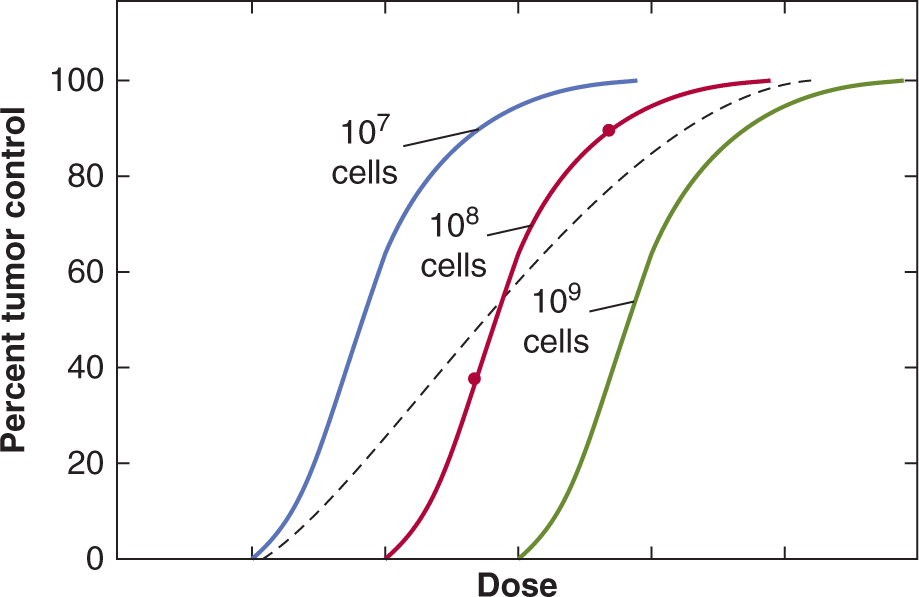
FIGURE 16–6 Percentage tumor control plotted as a function of dose for single radiation treatments. Theoretical curves for groups of tumors containing different numbers of tumor stem cells are shown. The points on the red curve labeled “108 cells” are derived as discussed in the text. The composite curve (dashed) was obtained for a group containing equal proportions from the 3 individual groups.
The central red curve in Figure 16–6 represents a group of identical tumors each containing 108 CSCs. For tumors containing 107 or 109 CSCs, the curves will be displaced (to smaller (blue) or larger (green) doses, respectively) by a dose sufficient to reduce survival by a factor of 10. These dose-control curves illustrate the concept that the dose of radiation required to control a tumor depends on the number of CSCs that it contains, although as noted above, the uncertainties about the identification of such cells and the plasticity of their phenotype may make it difficult to determine the number of cells with CSC potential in an individual tumor.
The above discussion also assumes that the CSCs exhibit a uniform radiosensitivity within a tumor. Recent studies suggest the possibility that CSCs may be more resistant to radiation than other (progenitor) cell populations in a tumor (Krause et al, 2011). Also, the microenvironment of the CSCs in the tumor can affect their sensitivity to radiation and there may also be differences as a result of genetic or epigenetic heterogeneity among the tumor cells. The role of hypoxia is well documented (see Sec. 16.4.2), but there may also be interactions of the cells with the extracellular matrix (ECM) and/or interactions with growth factors, such as transforming growth factor β (TGF-β1), which may influence cellular sensitivity and tumor response (Bouquet et al, 2011). Interactions between the tumor cells and the ECM can also influence cellular signaling, such as the EGFR/MEK/ERK (extracellular signal regulated kinase) or phosphatidylinositol-3 kinase (PI3K)/AKT pathways (see Chap. 8, Sec. 8.2.5) that can affect cellular sensitivity to radiation (see Chap. 15, Sec. 15.4.3). Knowledge of the role that such factors may play in tumor response is limited, but there is increasing evidence that cell contact and expression of certain integrins can affect the radiation sensitivity of cells (Eke and Cordes, 2011). Also, vascular damage and radiation-induced apoptosis of endothelial cells in tumors may play a role in response to radiation treatment (Garcia-Barros et al, 2010) through (opposing) effects of death of tumor cells from nutrient deprivation, or increase in hypoxia and radioresistance of surviving tumor cells. Recent work also points to the possibility that bone-marrow derived myeloid populations of cells, particularly monocytes/macrophages, may play a role in repair of the vasculature in tumors, thereby increasing their resistance to irradiation (Kioi et al, 2010; Zaleska et al, 2011).
16.3.2 Predicting the Response of Tumors
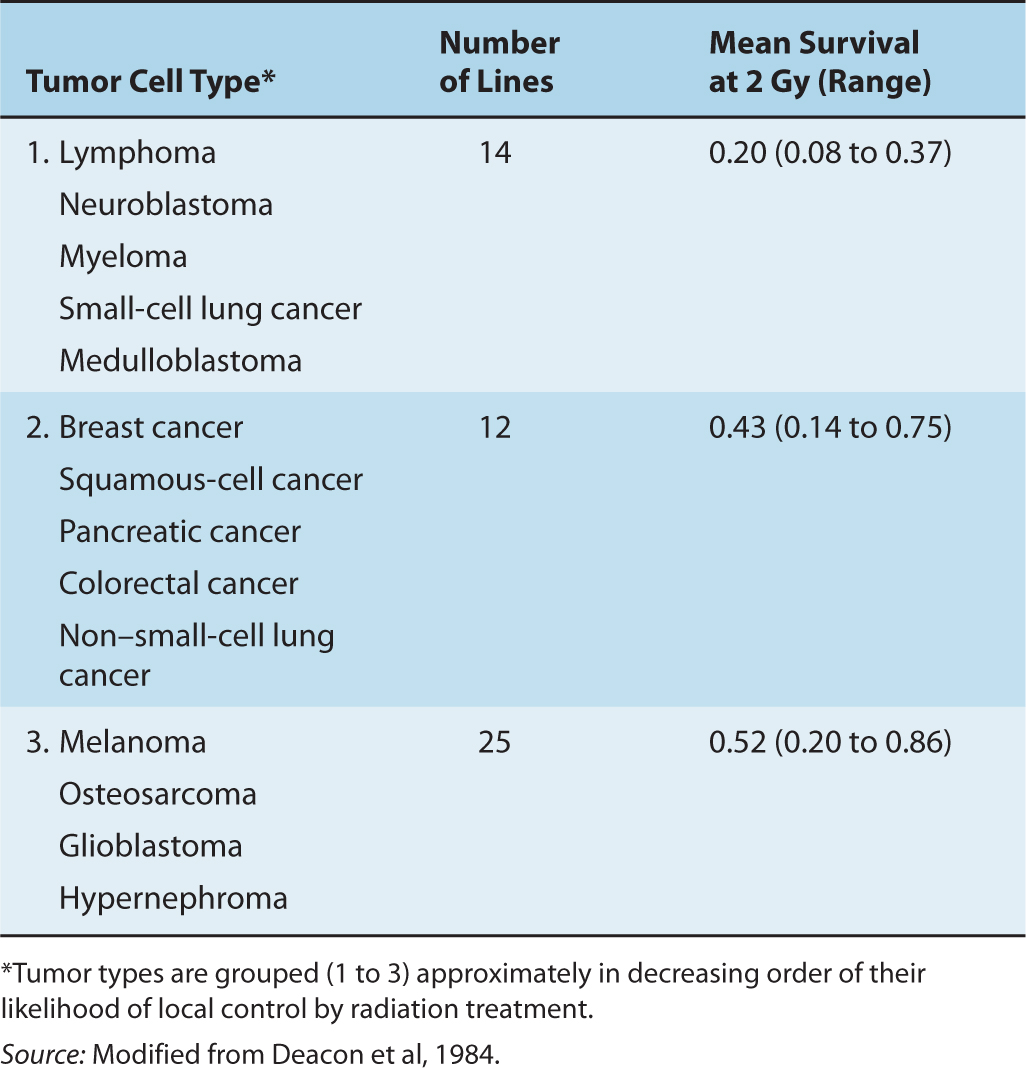
Even tumors of the same size and histopathological type are likely to vary in their proportion of CSCs. Thus, a dose-control curve for a group of human tumors will be a composite of the simple ones shown in Figure 16–6; the slope of the composite dose-control curve will be less than that for the individual simple curves (see Fig. 16–6, dashed line). Fractionation of the radiation treatment (see Sec. 16.6) and heterogeneity in the radiosensitivity of CSCs (either intrinsic or as a result of their microenvironment) will also result in a decrease in the slope of the dose-control curve. Thus, the slope of the dose-control curve derived from a clinical study is likely to be quite shallow. It is therefore desirable to seek a way of assigning the tumors to more homogeneous groups, so that patients with differences in prognosis can be identified. This is a major motivation for attempts to develop predictive assays. In vitro studies of a wide range of cell lines derived from human tumors have shown intrinsic variations in radiation sensitivity. Survival curves can vary considerably even for cells of similar histopathological types, particularly in the width of the shoulder region (Fig. 16–7). Even small differences in the shoulder region can be important because they are magnified during the multiple fractionated daily doses of 1.8 to 2 Gy given in clinical radiotherapy. Estimates of the surviving fraction following a dose of 2 Gy for different human tumor cell lines growing in culture may be grouped according to histopathological type and compared with the likelihood that such tumors will be controlled by radiation treatment (Table 16–2). There is a trend toward higher levels of survival at 2 Gy for the cells from tumor groups that, by experience, are less radiocurable.
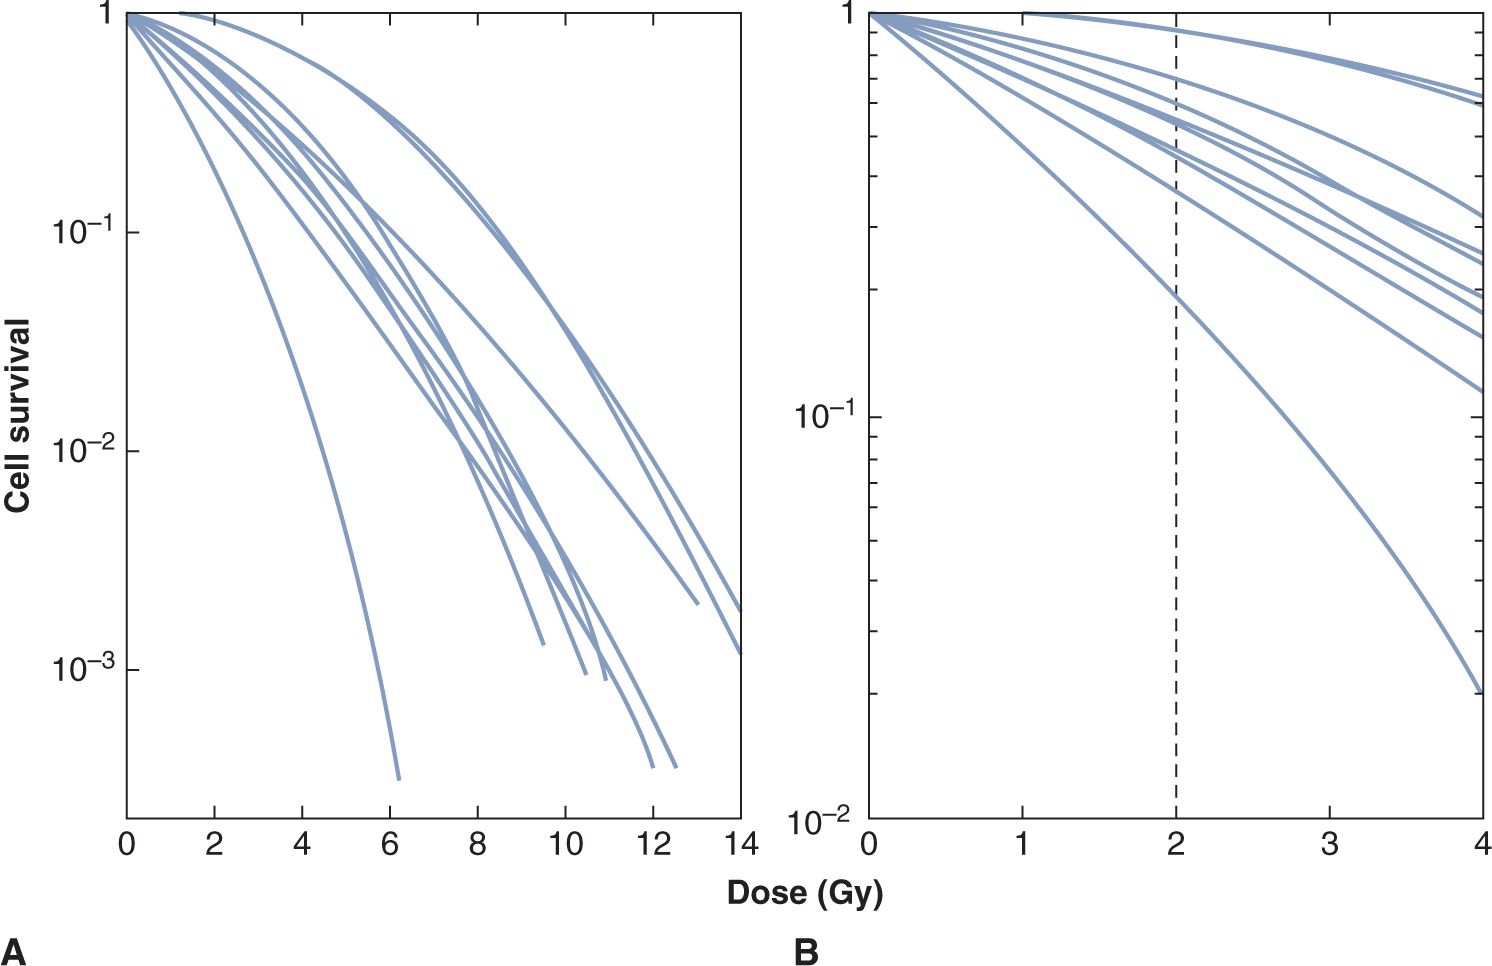
FIGURE 16–7 A) Survival curves for a number of different human melanoma cell lines. The lines were drawn to be continuously curving and conform to the linear-quadratic model (see Chap. 15, Appendix 15.1). B) The low-dose region of the curves is illustrated, demonstrating the range of cell survival values at 2 Gy. (Adapted from Fertil and Malaise, 1981.)
TABLE 16–2 Values of the surviving fraction (cell survival) at 2 Gy for human tumor cell lines.
The concept that tumor response for an individual patient can be predicted has been tested using the survival following 2 Gy (SF2) for cells from primary human cervix tumor biopsies grown in soft agar. West et al (1997) found that patients with tumors containing radioresistant cells (SF2 > median) had significantly worse local control and survival than those with tumors containing more radiosensitive cells (SF2 < median; Fig. 16–8) and similar results were reported for head and neck cancers (Bjork-Eriksson et al, 2000). However, other groups have had difficulty confirming the generality of these findings. Furthermore, the widespread application of such assays has been limited by technical problems; for example, the soft agar assay requires 5 to 6 weeks before scoring, and measurements could not be obtained in 25% to 30% of tumors. Other potential limitations of such assays are (a) they do not account for microenvironmental factors influencing radiosensitivity; (b) tumors may contain clonogenic (CSC) subpopulations of different intrinsic radiosensitivity; (c) the assay relies on colony formation in agarose to identify CSCs, and many of them may not proliferate in this artificial environment; and (d) if other (progenitor) tumor cells can also form small colonies, the assay may not be measuring the radiosensitivity of the CSCs alone.
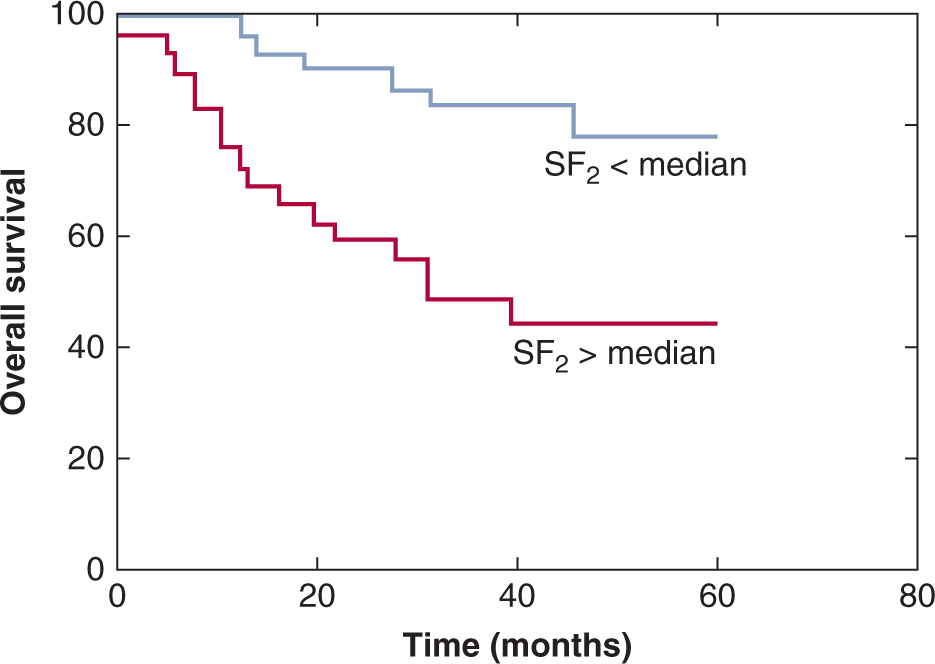
FIGURE 16–8 Actuarial survival in patients with cervical cancer treated by radical radiotherapy as a function of intrinsic radiosensitivity of tumors stratified as above (red line) or below (blue line) the median survival following 2 Gy (SF2) of 0.41. Overall survival and local control (not shown) are significantly worse for patients with SF2 > 0.41. (Redrawn from Levine et al, 1995.)
More recently, genetic profiling is being investigated as an approach to prediction of treatment response and identification of possible therapeutic targets to enhance response (eg, Miyamoto and Harris, 2011; Settle and Sulman, 2011). Mutations associated with DNA repair (such as ATM [ataxiatelangiectasis mutated]) can affect radiation sensitivity, and as discussed in Chapter 5, Section 5.4, inhibitors of DNA repair in combination with radiotherapy might be used to take advantage of inherent defects in DNA repair in tumor cells. This field is evolving rapidly and studies have identified other pathways such as PI3K/AKT in cervix cancer that might be predictive of response to radiotherapy (Schwarz et al, 2012). A potential problem is that most genetic analyses are being undertaken on the bulk tumor population and largely reflect changes in the majority population of tumor cells, and thus may miss critical changes in a small proportion of the tumor cells, particularly populations of CSCs.
16.4 HYPOXIA AND RADIATION RESPONSE
16.4.1 The Oxygen Effect and Radiosensitivity
The biological effects of radiation on cells are enhanced by oxygen. The primary mechanism (called the oxygen fixation hypothesis) is believed to be that oxygen can interact with (secondary) radicals, on cellular molecules such as DNA, formed by their interaction with the (primary) hydroxyl radicals produced by radiation effects on water in the cell (Fig. 16–9A). These interactions result in damage to DNA that is initially permanent or “fixed” and must be repaired by the cell enzymatically. For this effect, oxygen must be present in the cells at the time of or within a few milliseconds of the radiation exposure (because of the short lifetime of the radicals). At low levels of oxygen, free sulfhydryls in the cells can effectively compete with oxygen to interact with the radicals and can cause an immediate chemical repair. Cells irradiated in the presence of air are about 3 times more sensitive than cells irradiated under conditions of severe acute hypoxia (Fig. 16–9B). The sensitizing effect of different concentrations of oxygen is shown in Figure 16–9C. At very low levels of oxygen the cells are resistant but, as the level of oxygen increases, their sensitivity rises rapidly to almost maximal levels at oxygen concentrations above approximately 35 μmoles/L (equivalent oxygen partial pressure –25 mm of mercury [mm Hg]). The oxygen concentration at which the sensitizing effect is one-half of maximum (the Km value) varies among cell lines (probably as a result of free sulfhydryl levels in the cells) but is usually in the region 5 to 15 μmoles/L (4 to 12 mm Hg equivalent partial pressure).
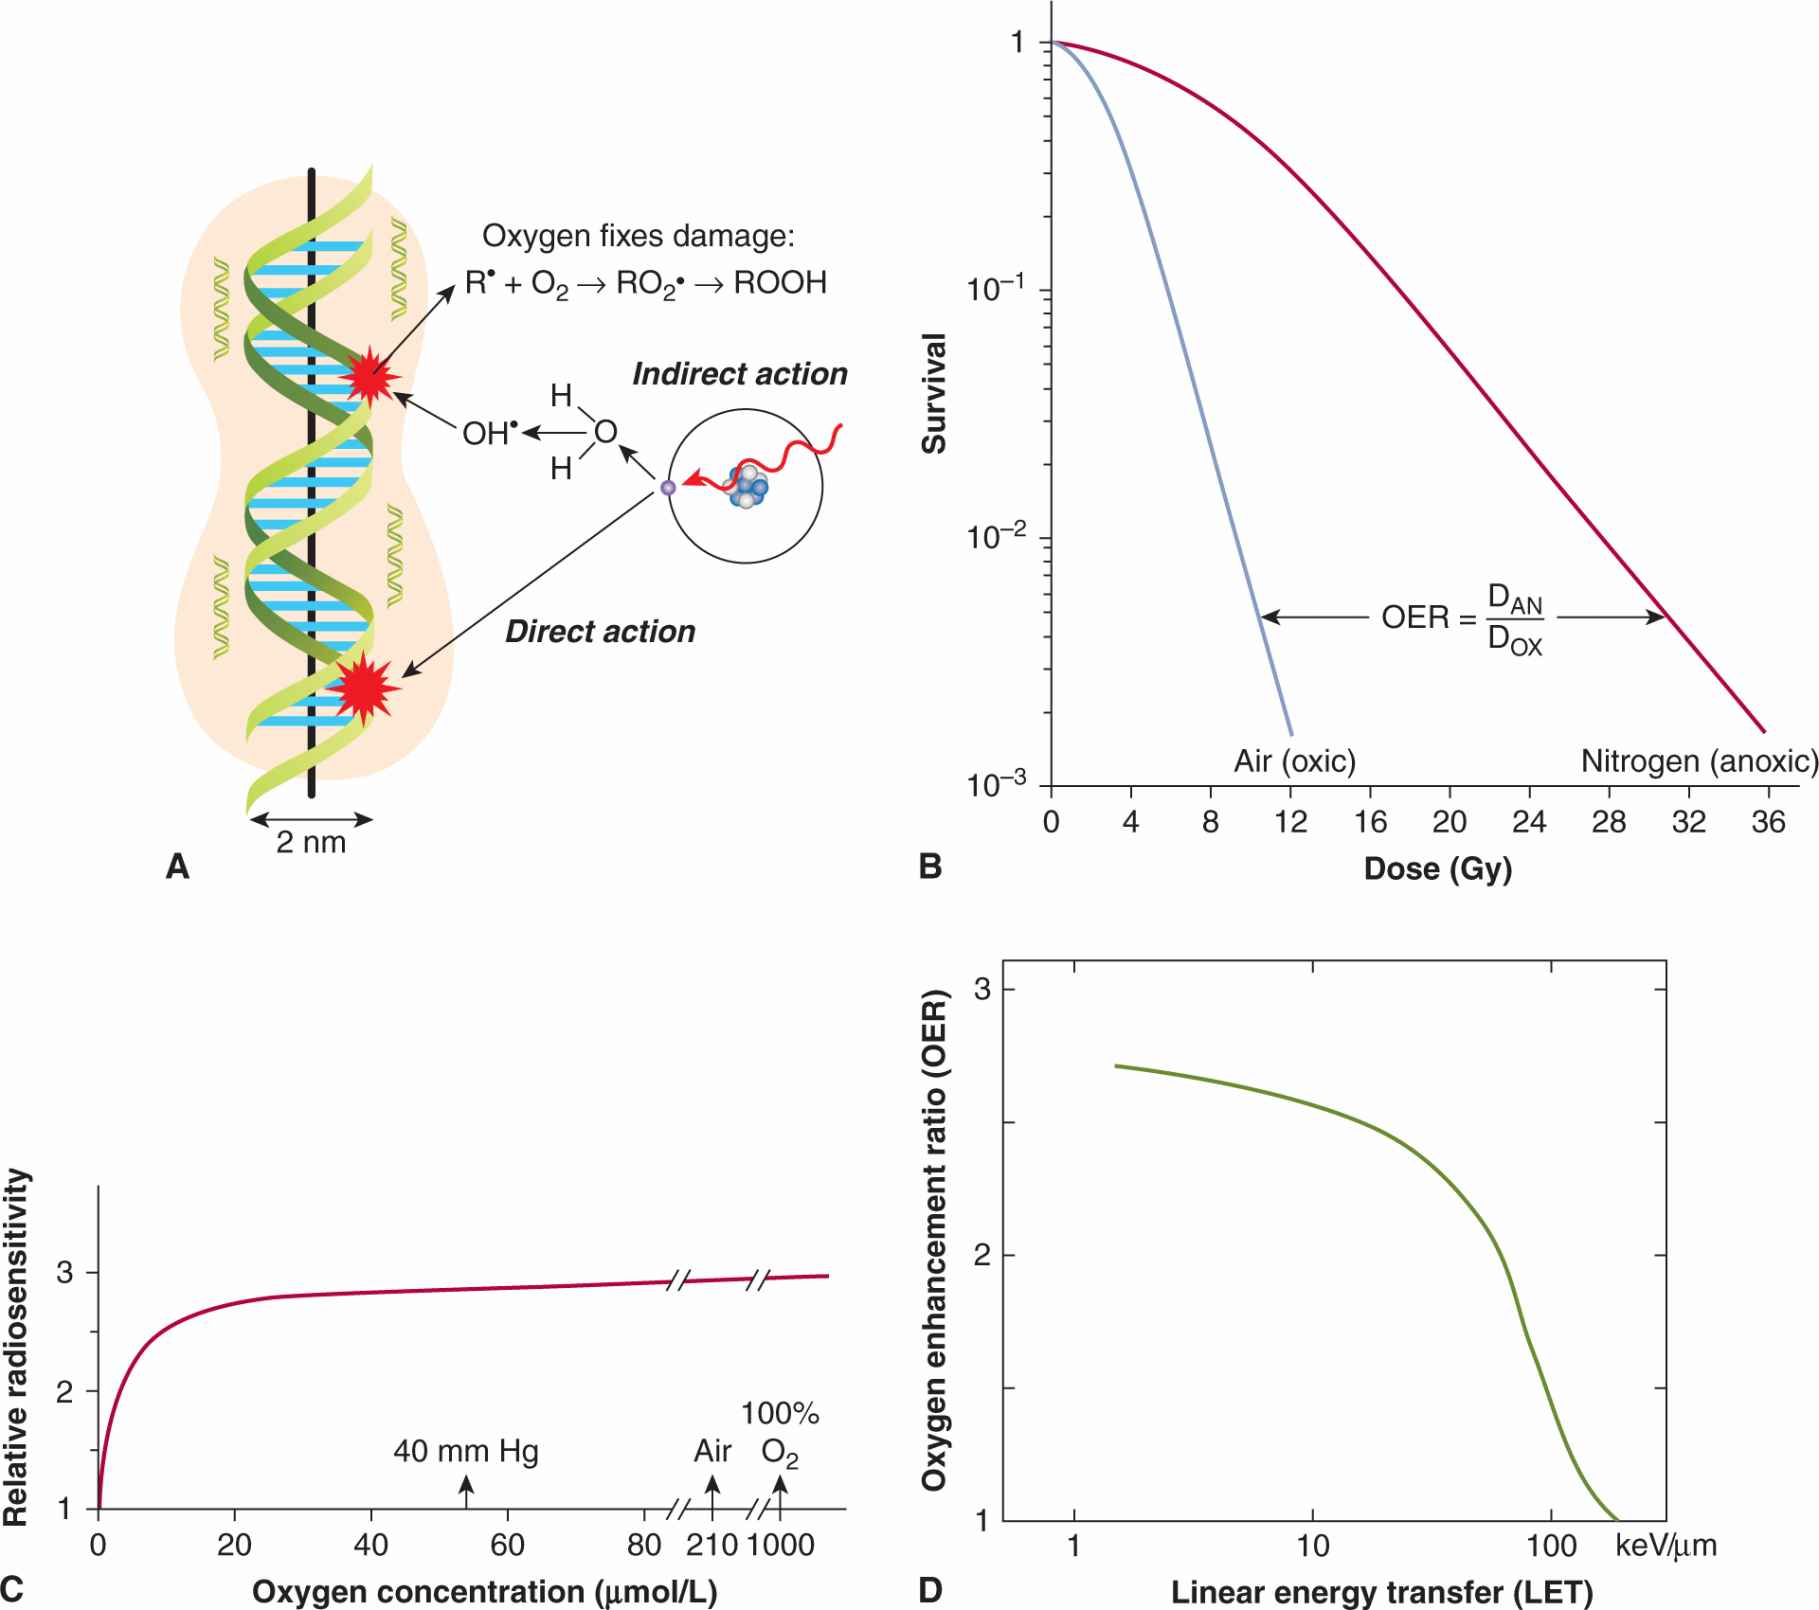
FIGURE 16–9 Effect of oxygen as a radiosensitizer. A) Illustration of oxygen interacting with damage to DNA caused by hydroxyl (OH) radicals created by the effects of radiation on water molecules (Modified from Hall, 2000). B) Survival curves obtained when cells are treated with low-LET radiation in the presence (air) or absence (nitrogen) of oxygen. The OER is calculated as indicated (DOX = dose in air, DAN = dose in nitrogen) and as described in the text. C) The relative radiosensitivity of cells is plotted as a function of oxygen concentration in the surrounding medium to illustrate the dependence of the sensitizing effect on oxygen concentration. (Adapted from Chapman et al, 1974.) D) Illustration of the dependence of the OER on the LET of the radiation.
The degree of sensitization afforded by oxygen is characterized by the OER, which is defined (see Fig. 16–9B) as the ratio of doses required to give the same biological effect in the absence or the presence of oxygen. For doses of X- or y-radiation greater than approximately 3 Gy, the OER for a wide range of cell lines in vitro, and for most tissues in vivo, is in the range of 2.5 to 3.3. For X- or γ-ray doses less than approximately 3 Gy (ie, in the shoulder region of the survival curve), the OER is reduced in a dose-dependent manner. A reduction of the OER at low doses is clinically important because the individual treatments of a fractionated course of treatment are usually 2 Gy or less. The OER is also dependent on the type of radiation, declining to a value of 1 for radiation with LET values greater than approximately 200 kiloelectron volts per micrometer (keV/μm) (see Fig. 16–9D).
16.4.2 Tumor Hypoxia
The cells in a tumor are influenced both by their interactions with the ECM (see Chap. 10, Sec. 10.2), and by their microenvironment, which is characterized by regions of nutrient deprivation, low extracellular pH, high interstitial fluid pressure (IFP), and hypoxia (see Chap. 12, Sec. 12.2). The oxygen level (pO2) in most normal tissues ranges between approximately 20 and 80 mm Hg, whereas tumors often contain regions where the pO2 is less than 5 mm Hg. These conditions in solid tumors are primarily caused by the abnormal vasculature that develops during tumor angiogenesis (see Chap. 11). The blood vessels in solid tumors have highly irregular architecture, and are more widely separated than in normal tissues. A proportion of tumor cells may lie in chronically hypoxic regions beyond the diffusion distance of oxygen (Fig. 16–10; see also Chap. 12, Figs. 12–5 and 12–6). Tumor cells may also be exposed to shorter (often fluctuating) periods (minutes to a few hours) of acute hypoxia as a result of intermittent flow in individual blood vessels (see Fig. 16–10). Tumor hypoxia has been observed in a majority of tumors both human and experimental (see Sec. 16.4.3 and Chap. 12, Sec. 12.2.1), but has been found to be very heterogeneous both within and among tumors, even those of similar histopathological type, and it does not correlate simply with standard prognostic factors such as tumor size, stage, and grade (Vaupel et al, 2001). Acute and chronic hypoxia can coexist in the same tumor and hypoxic regions in tumors are often diffusely distributed throughout the tumor (see Fig. 16–10) and are rarely concentrated only around a central core of necrosis.
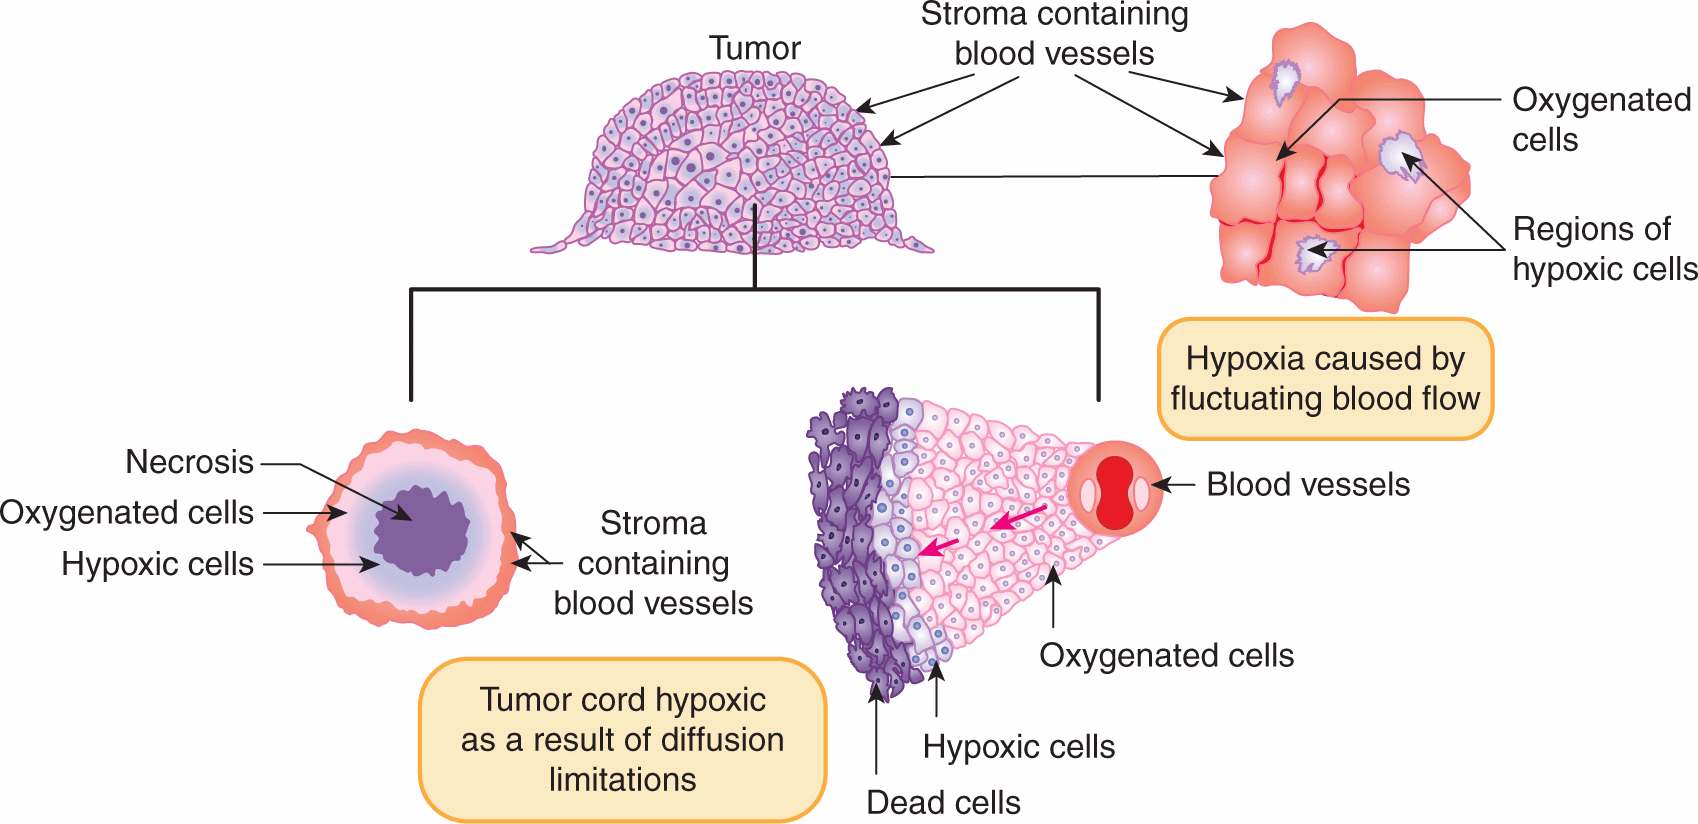
FIGURE 16–10 Schematic of 2 models for the development of hypoxia in tumors. Hypoxia may arise as a result of fluctuating blood flow (as illustrated in the diagram on the upper right) or as a result of diffusion limitations in the tumor cord model (inward or outward diffusion from vessels as illustrated in the lower 2 diagrams).
Evidence that cells in the hypoxic regions of tumors growing in experimental animals are viable and capable of regrowing the tumor is provided by analysis of cell survival curves generated by irradiating the tumor in situ and then plating the cells in vitro. For most tumors the terminal slope of such curves is characteristic of that for hypoxic cells (Fig. 16–11). The proportion of viable hypoxic cells in tumors can be estimated (Fig. 16–11) from the ratio (SAir/SAnox) of the cell survival obtained for tumors in air-breathing animals irradiated with a large dose to the cell survival obtained for tumors irradiated with the same dose under anoxic conditions (eg, tumor blood supply clamped). As discussed below, substantial levels of hypoxia in human tumors have been shown to be a poor prognostic indicator. However, cells exposed to acute versus chronic hypoxia in the tumor may exhibit different degrees of resistance. In cells exposed to longer periods of (chronic) hypoxia, gene expression changes may occur (see Chap. 12, Sec. 12.2.3) which can reduce the OER value as a consequence of a reduced ability to repair radiation-induced DNA damage. Thus acutely hypoxic cells may be the more resistant of the hypoxic cell populations in tumors. Hypoxia may play an important role in treatment outcome for many tumor types and can affect the metastatic ability of some tumor cells (see Chap. 10, Sec. 10.5.7) as well as the response of the primary tumor to treatment.
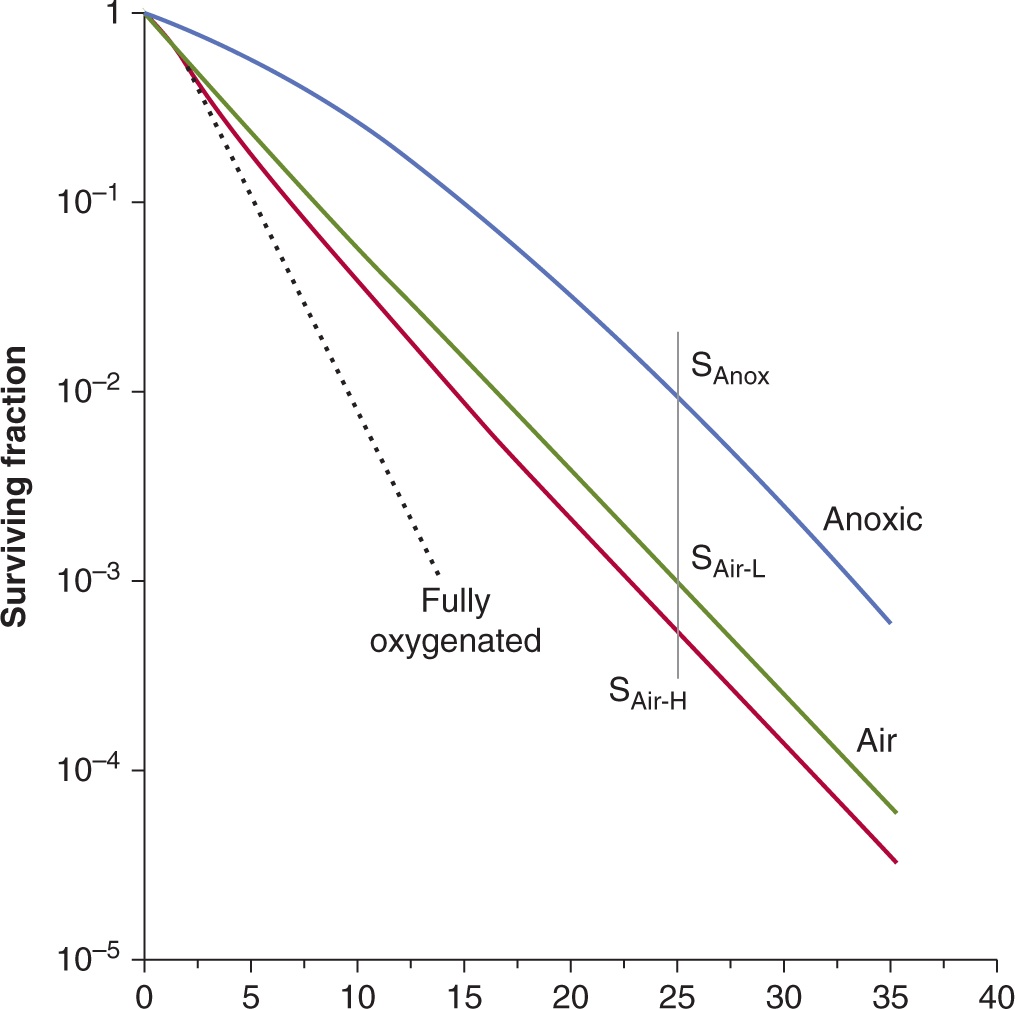
FIGURE 16–11 The influence of a subpopulation of hypoxic cells on the survival curve obtained for an irradiated tumor. The 4 curves shown are for a well-oxygenated population of cells (dotted line), 2 curves derived from tumors irradiated under airbreathing conditions, and a curve for tumors irradiated under anoxic conditions (blue line). The 2 curves for irradiation under air-breathing conditions are for tumors in animals with high (H-red line) or low (L-green line) hemoglobin levels. The hypoxic fraction can be estimated by taking the ratio of the survival obtained under air-breathing conditions (SAir) to that obtained under anoxic conditions (SAnox) at a dose level where the survival curves are parallel, as illustrated. For the tumors in animals with a high hemoglobin this value is approximately 0.06 (6%) and for the tumors in animals with low hemoglobin it is approximately 0.12 (12%). (Modified from Hill et al, 1971.)
16.4.3 Measuring Hypoxia in Tumors
Table 16–3 lists techniques to determine oxygenation in individual tumors. A common method for human tumors has been polarographic oxygen electrodes (eg, the Eppendorf oxygen electrode) to measure microregional pO2 (estimated to be in a volume equivalent to approximately 500 cells) in multiple locations. This technology has revealed wide pO2 variations both within and between tumors (Fig. 16–12 A, B). Results from clinical studies in cervix and head and neck carcinomas (see Fig. 16–12C and Chap. 12, Fig. 12–8) treated by radiotherapy indicate that hypoxic tumors have a worse prognosis (Nordsmark et al, 2005; Fyles et al, 2006). It should be noted that hypoxic cervix tumors treated by surgery also had a worse prognosis, consistent with the fact that hypoxic tumors tend to be more aggressive and have increased metastasis (Hockel et al, 1996). The oxygen electrode has the disadvantage that it is invasive and it is difficult to distinguish between measurements made in viable versus nonviable tissue regions.
TABLE 16–3 Assays for intratumoral hypoxia.
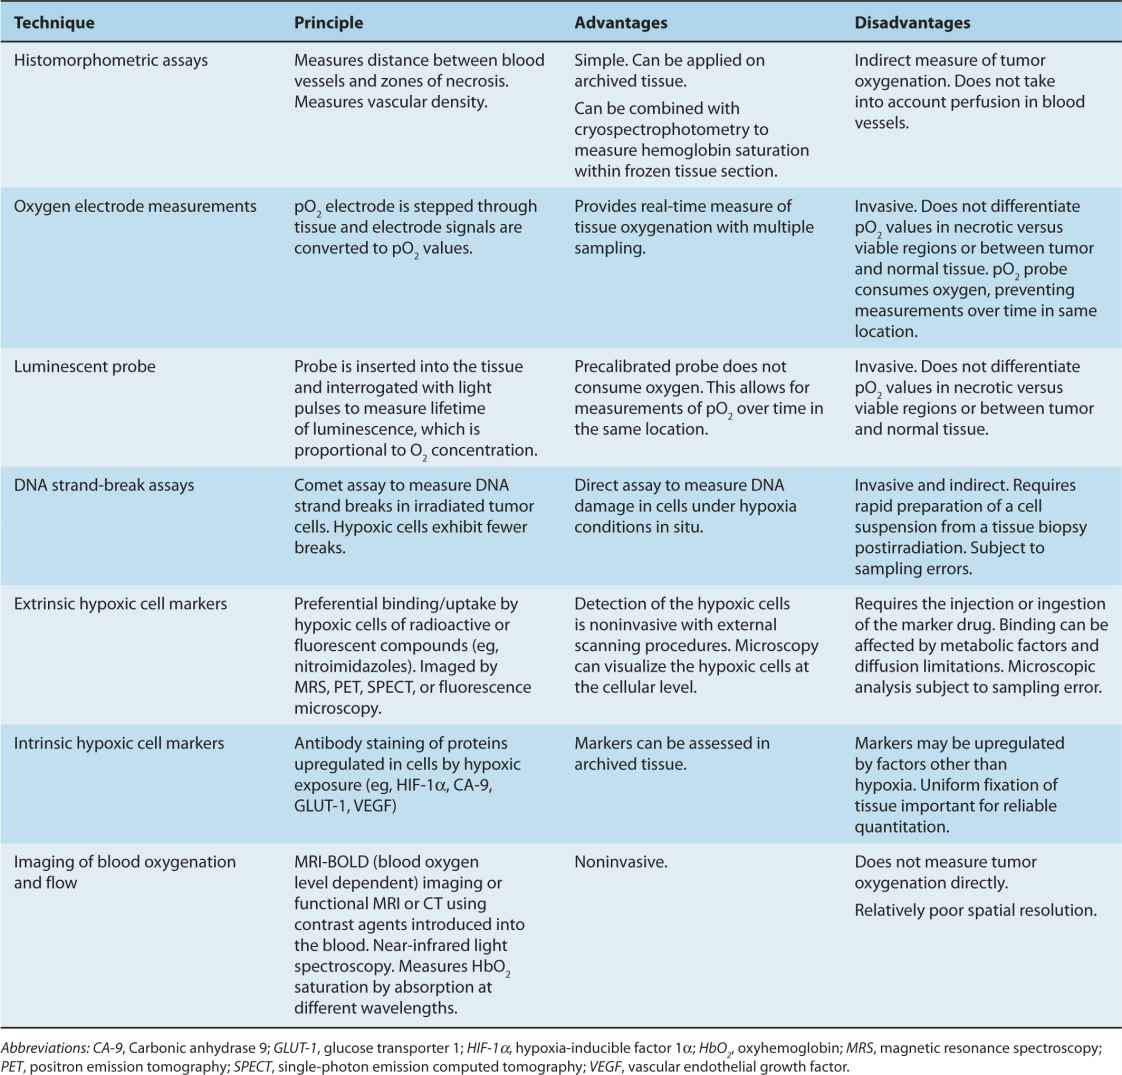
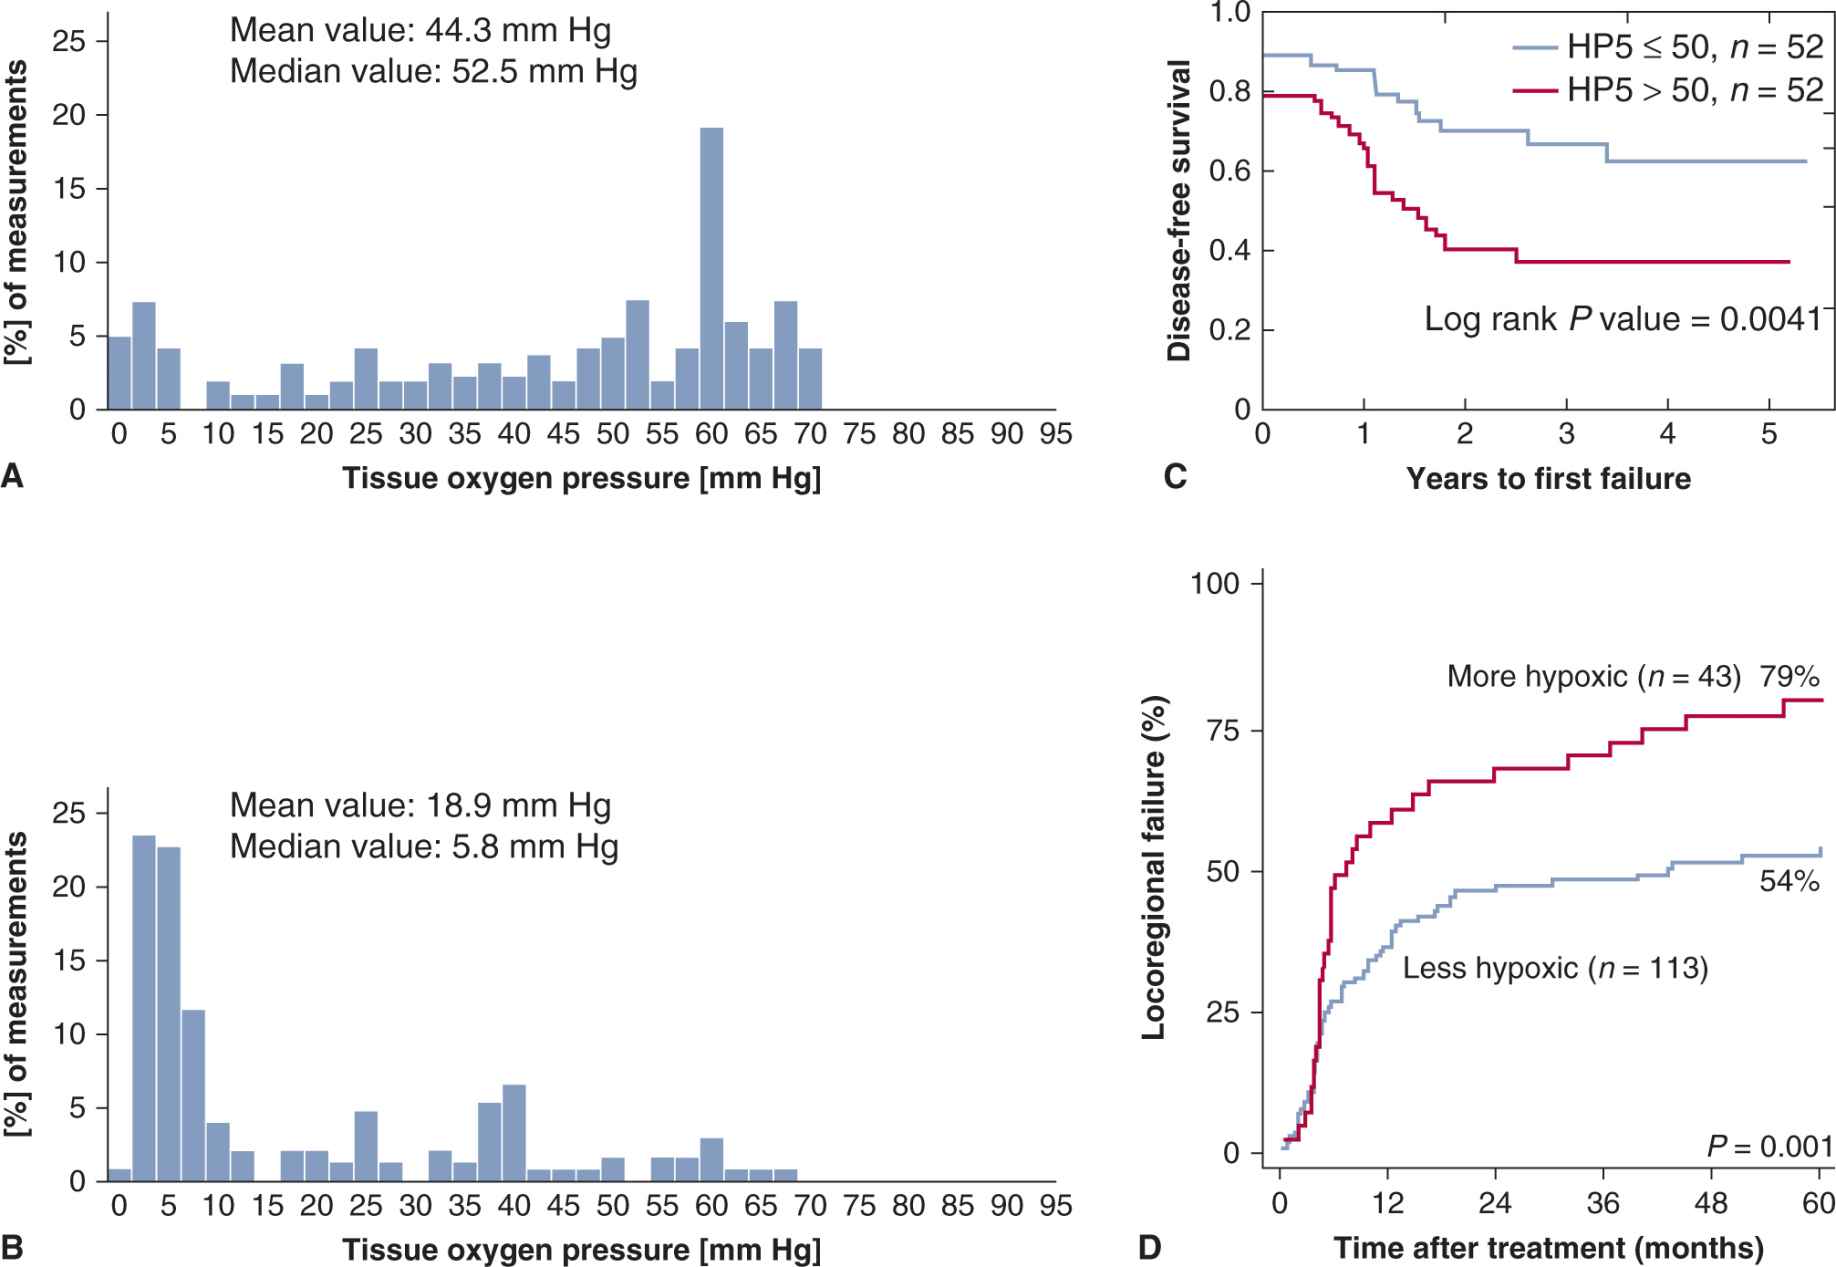
FIGURE 16–12 Distribution of tumor pO2 in 2 human cervix carcinomas as measured by the Eppendorf oxygen electrode and treatment outcome for patients with high/low levels of hypoxia in their tumors. (A, B) Each distribution represents 160 individual measurement points in the tumor. Tumor in (A) is less hypoxic and shows fewer regions with low pO2 measurements than tumor in (B) (courtesy of Fyles, unpublished). Panel (C) shows results for cancer of the cervix treated with radiotherapy and demonstrates that patients with tumors with a higher degree of hypoxia (HP5 > 50%) have poorer disease-free survival. HP5 is the percentage of pO2 measurements in the tumor that were below 5 mm Hg. (Redrawn from Fyles, Milosevic, Hedley et al, 2002.) Panel (D) shows the cumulative incidence of locoregional tumor failure in head and neck cancer patients treated with conventional radiotherapy alone and separated into “more” and “less” hypoxic tumors by a 15-gene hypoxia signature. (Reprinted by permission from the American Association for Cancer Research: Toustrup et al, 2011.)
More recent studies have focussed on noninvasive imaging or immunohistochemical (IHC) staining of biopsies using extrinsic or intrinsic markers of hypoxia. Commonly used extrinsic markers are pimonidazole and [18F]-labeled nitroimidazoles such as [18F]-misonidazole or [18F]-fluoroazomycinarabinofuranoside ([18F]FAZA), which can be injected into patients and form protein adducts within hypoxic regions in the tumor. To assess the regions of hypoxia in the tumor the [18F]-labeled compounds can be imaged with positron emission tomography (PET; see Chap. 14, Sec. 14.3.3), while staining with antibodies to the (pimonidazole) adducts is used on tissue sections (Ljungkvist et al, 2007; Chitneni et al, 2011). Both pimonidazole and another nitroimidazole (EF5) have also been used widely in animal models. Such studies have provided evidence for substantial heterogeneity in hypoxia both within and between tumors. A recent study in laryngeal cancer using pimonidazole has reported poorer locoregional control in patients with more hypoxic tumors (Janssens et al, 2012). Intrinsic markers of hypoxia (such as hypoxia inducible factor-1a [HIF-1a], glucose transporter-1 [GLUT-1], carbonic anhydrase-9 [CA-9] and osteopontin [OPN]; see Chap. 12, Sec. 12.2.3) are proteins that are upregulated in the cells exposed to hypoxia and can be detected by IHC staining with appropriate antibodies. Intrinsic markers have the advantage that they can be applied to existing tissue blocks for retrospective analysis of previous clinical studies, but because their expression can be affected by other mechanisms in the cell, they have imperfect correlation with hypoxic regions identified with extrinsic markers. Increased levels of these various markers have, however, been associated with poorer treatment outcome in different tumor types (Bussink et al, 2003; Vordermark and Brown, 2003; Lim et al, 2012).
The heterogeneity in levels of hypoxia throughout tumors poses a problem for techniques using tissue sections, as assessment of multiple biopsies is necessary to achieve an overall assessment of hypoxia in the tumor. PET imaging of the binding of radiolabelled nitroimidazoles can be used to evaluate the whole tumor, although the volume resolution of such imaging is much lower than that achieved in tissue sections (see Chap. 14, Sec. 14.3.3). Use of this technique in patients with head and neck tumors was predictive for treatment outcome with radiochemotherapy (Rischin et al, 2006).
The recent development of whole-genome analysis has allowed for the identification of specific gene signatures associated with hypoxia. Initial studies suggest that such signatures can have predictive power for radiation treatment of HPV-negative head and neck cancer (Toustrup et al, 2011; see Fig. 16–12D) and other cancers (Buffa et al, 2010).
16.4.4 Targeting Hypoxic Cells in Tumors
Because hypoxic cells represent a radiation-resistant subpopulation in tumors that is not present in most normal tissues, the therapeutic ratio might be improved by techniques to reduce the influence of hypoxic cells on tumor response. Various approaches have been investigated over the last 50 years, including (a) attempts to increase oxygen delivery to tumors; (b) use of drugs to modify oxygen consumption of the tumor cells to increase oxygen diffusion distances in the tumor; (c) use of drugs that mimic the radiosensitizing properties of oxygen; (d) use of drugs that are specifically toxic to hypoxic cells; (e) use of high-LET radiations that have a reduced OER (see Sec. 16.4.1 and Fig. 16–9D); and (f) use of drugs that exploit the reduced DNA repair capacity of chronically hypoxic cells. Some of these approaches are discussed in this section.
16.4.4.1 Increasing Oxygen Delivery Clinical studies demonstrate the negative effect of anemia on prognosis (Fyles et al, 2000; Hoff et al, 2011), and blood transfusions are often used to maintain patients at normal hemoglobin levels during radiotherapy. A small randomized study in patients with carcinoma of the cervix showed improvement of local control with blood transfusions (Bush, 1986) but this was not observed in head and neck cancers (Hoff et al, 2011). The administration of erythropoietin has also been used to correct anemia (Seidenfeld et al, 2001), but there is little evidence that it can improve local control or disease-free survival following radiotherapy (Henke et al, 2003). Experimental studies suggest that carbon monoxide in cigarette smoke, which can reduce the oxygen-carrying and -unloading capacity of the blood, may result in reduced tumor oxygenation. Patients with head and neck cancer who continue to smoke during radiotherapy have decreased local control and survival after radiation treatment (Hoff et al, 2012), although results in cervix cancer were not significant (Fyles, Voduc et al, 2002).
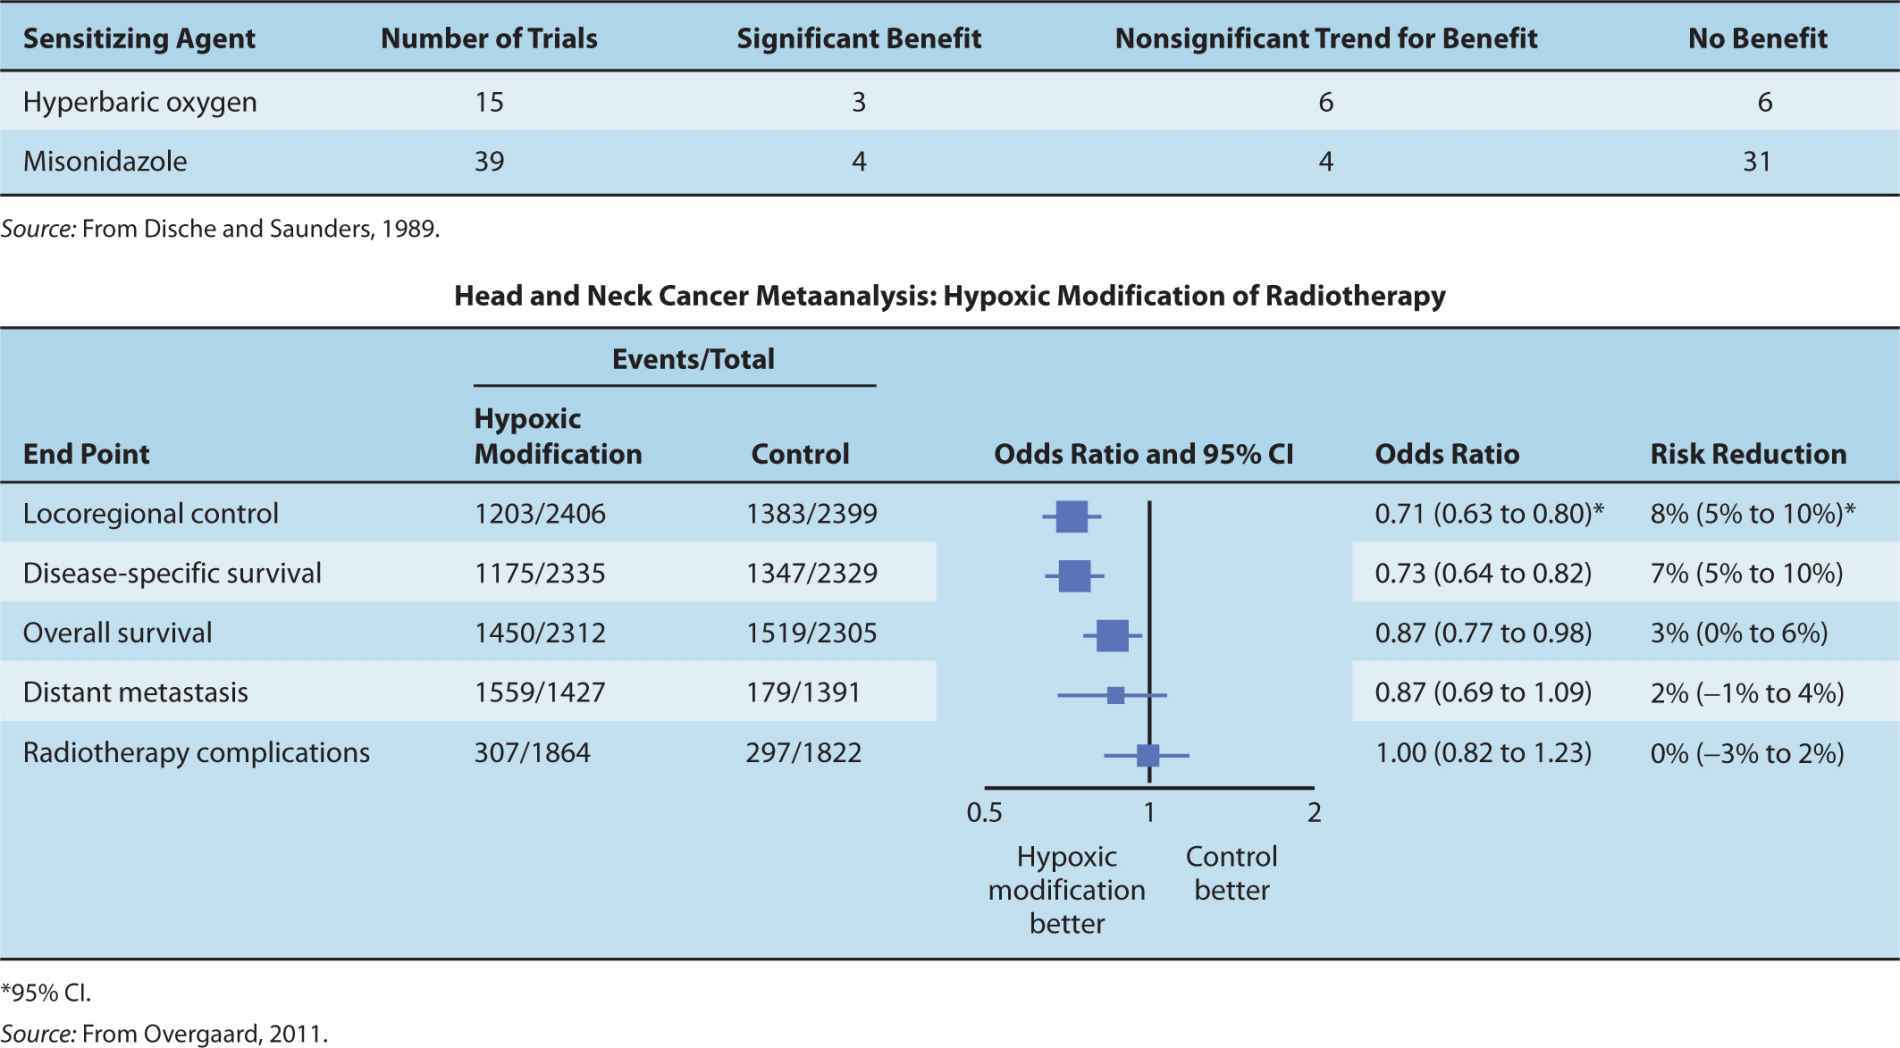
Oxygen delivery to tumor cells may be increased by giving animals or patients oxygen under hyperbaric conditions (200 to 300 kPa) during radiation treatment and early clinical studies with high-pressure oxygen (HPO) as an adjuvant to radiation therapy did demonstrate significant improvement in local tumor control and survival for patients with cancers of the head and neck and cervix (Table 16–4), but this has not been observed in the limited studies of tumors at other sites (Overgaard and Horsman, 1996). The technical difficulties of giving modern radiation treatments with the patient in an HPO chamber have led to this technique being abandoned in favor of other strategies. One such strategy is the use of a combination of nicotinamide, which has been shown to increase tumor perfusion, and carbogen (95% O2 and 5% CO2) breathing. This combination has been reported recently to improve local outcome in laryngeal and bladder cancers treated with radiation therapy (Hoskin et al, 2010; Janssens et al, 2012).
TABLE 16–4 Summary of clinical trials testing sensitization of hypoxic cells.
Paradoxically, there is evidence in animal tumor models that treatment with antiangiogenic agents (see Chap. 11, Sec. 11.7.1) can improve oxygenation in some tumors, possibly as a result of regularization of the vasculature. Studies combining such agents with radiation treatment of experimental tumors have indicated improved treatment response (Goel et al, 2011). It remains uncertain whether these improved responses are a result of improved oxygenation or of factors such as direct tumor cell kill induced by the antiangiogenic treatment. Reducing oxygen consumption in cells by modifying mitochondrial respiration has been demonstrated to increase oxygenation of tumors in experimental models, and this might be an effective way to decrease hypoxia in tumors (Secomb et al, 2004; Diepart et al, 2011).
16.4.4.2 Hypoxic Cell Sensitizers and Cytotoxins The development of drugs that mimic the radiosensitizing properties of oxygen, known as hypoxic cell radiosensitizers, was based on the idea that the radiosensitizing properties of oxygen are a consequence of its electron affinity and that other electronaffinic compounds might act as sensitizers. Certain nitromidazoles, such as misonidazole, were able to sensitize hypoxic cells both in vitro and in animal tumors. The extent of the sensitization can be assessed in terms of a sensitizer enhancement ratio (SER) that is analogous to the OER discussed in Section 16.4.1. SERs depend on the drug concentration in the tumor at the time of radiation. There is a good correspondence between the values obtained for tumors and the results from in vitro studies. If misonidazole is combined with fractionated radiation doses, the SER is reduced both because of reoxygenation occurring between the fractions (see Sec. 16.6.4) and because lower individual doses of the drug are tolerated when it is given as multiple doses during fractionated treatment.
The results from the clinical trials using misonidazole were disappointing (see Table 16–4), possibly because the dose of misonidazole was limited by dose-dependent peripheral neuropathy, although many of the individual trials had small numbers of patients included, and therefore low statistical power to detect differences in outcome (see Chap. 22, Sec. 22.2.6). Studies using the lesstoxic drug, nimorazole, have been associated with improved tumor control in head and neck cancer in the Danish Head and Neck Cancer Study (DAHANCA) trial (Overgaard et al, 1998). Furthermore, a recent metaanalysis of results for patients with head and neck cancer treated in randomized trials, using radiotherapy with HPO or hypoxic cell sensitizers (see Table 16–4) has indicated a small but significant improvement in local control and survival (Overgaard, 2011). Greater benefits might have been observed if there had been selection of patients with high levels of hypoxia in their tumors; reanalysis of a trial using plasma osteopontin levels as an intrinsic marker for hypoxia suggested that only the one-third of patients with the most hypoxic tumors benefitted from treatment with nimorazole (Overgaard et al, 2005).
Another approach to reducing the influence of hypoxia on the radiation response of tumors has been to use (bioreductive) drugs that are toxic under hypoxic conditions (see Chap. 19; Sec. 19.3.2). The most extensively studied of these drugs is tirapazamine, which is cytotoxic to hypoxic cells at oxygen concentrations up to approximately 10 μmoles/L (equivalent partial pressure of approximately 7 mm Hg) (Brown, 1999). Under hypoxia, tirapazamine is metabolized to an agent that produces DNA damage, including double-strand breaks, probably by interacting with topoisomerases. In the presence of oxygen, the active form is converted (by oxidation) back to the parent compound. The drug also interacts with the chemotherapeutic agent cisplatin to increase its toxicity. Tirapazamine has shown efficacy in some clinical trials when used with cisplatin, but a large randomized Phase III trial of tirapazamine with chemoradiotherapy for head and neck cancers failed to show significant benefit, although this may have been related to the quality of the radiotherapy delivered (Peters et al, 2010; Rischin et al, 2010). This trial did not select for patients with more hypoxic tumors and analysis of a small subset in whom hypoxia imaging was performed suggested benefit only for those with the most hypoxic tumors (Rischin et al, 2006), similar to the retrospective analysis for nimorazole described above. This has important implications for clinical studies of other hypoxic cytotoxins currently under development (Wilson and Hay, 2010). One such drug is TH–302, a 2-nitroimidazole with a bromoisophosphoramide mustard side chain that is released following reduction under hypoxic conditions to give a diffusible toxic product that can diffuse to kill less hypoxic (bystander) cells as well as the producing cell. Studies in animal tumor models with this agent in combination with conventional chemotherapy have shown promising results and clinical studies are in progress (Liu et al, 2012).
16.5 NORMAL TISSUE RESPONSE TO RADIOTHERAPY
16.5.1 Cellular and Tissue Responses
Radiation treatment can cause loss of function in normal tissues. In renewal tissues, such as skin, bone marrow, and the gastrointestinal mucosa, loss of function may be correlated with loss of proliferative activity of stem cells. In these and other tissues, loss of function may also occur through damage to more mature cells and/or through damage to supporting stroma and vasculature, the influx of immune cells, and the induction of inflammatory responses (Stewart and Dorr, 2009). Traditionally, the effects of radiation treatment on normal tissues has been divided, based largely on directly observable functional and histopathological end points, into early (or acute) responses, which occur within 3 months of radiation treatment, and late responses that may take many months or years to develop. It should be noted that such endpoints do not assess early changes in gene expression associated with irradiation that occur in all tissues (see below). Acute responses occur primarily in tissues where rapid cell renewal is required to maintain the function of the organ. Because many cells express radiation damage during mitosis, there is early death and loss of cells killed by the radiation treatment. Late responses tend to occur in organs whose parenchymal cells divide infrequently (eg, liver or kidney) or rarely (eg, central nervous system or muscle) under normal conditions. Depletion of the parenchymal cell population as a result of entry of cells into mitosis, with the resulting expression of radiation damage and cell death, will thus be slow. Damage to the connective tissue and vasculature of the organ (which also proliferates slowly under normal conditions) may lead to progressive impairment of its circulation and secondary parenchymal cell death may occur as a consequence of nutrient deprivation. The loss of functional cells may induce other parenchymal cells to divide, causing further cell death as they express their radiation damage, leading eventually to functional failure of the organ. Consequential late effects may also occur where severe early reactions have led to impaired tissue recovery and/or development of infection. Several systems for documenting normal tissue responses (side effects) to irradiation in patients have been developed to facilitate cross-comparisons between investigators and institutions. These include the Radiation Therapy Oncology Group (RTOG)/European Organization for Research and Treatment of Cancer (EORTC) classification, the Common Terminology Criteria for Adverse Events (CTCAE v4) scale devised by the National Cancer Institute (NIH/NCI, 2009) and the Late Effects Normal Tissue Task Force Subjective, Objective, Management, and Analytic (LENT/SOMA) system, specifically designed to score late reactions (Hoeller et al, 2003).
The radiosensitivity of the cells of some normal tissues can be determined directly using in situ assays that allow the observation of proliferation from single surviving cells in vivo. One such assay determines the fraction of regenerating crypts in the small intestine following radiation doses sufficient to reduce the number of surviving stem cells per crypt to 1 or less, and analysis of the results allows the generation of a survival curve (Tucker et al, 1991). Survival curves obtained for the cells of different normal tissues in mice and rats are shown in Figure 16–13. Considerable variability in sensitivity is apparent, and as with tumor cells, most of the difference appears to be in the shoulder region of the survival curve, suggesting differences in repair capacity.
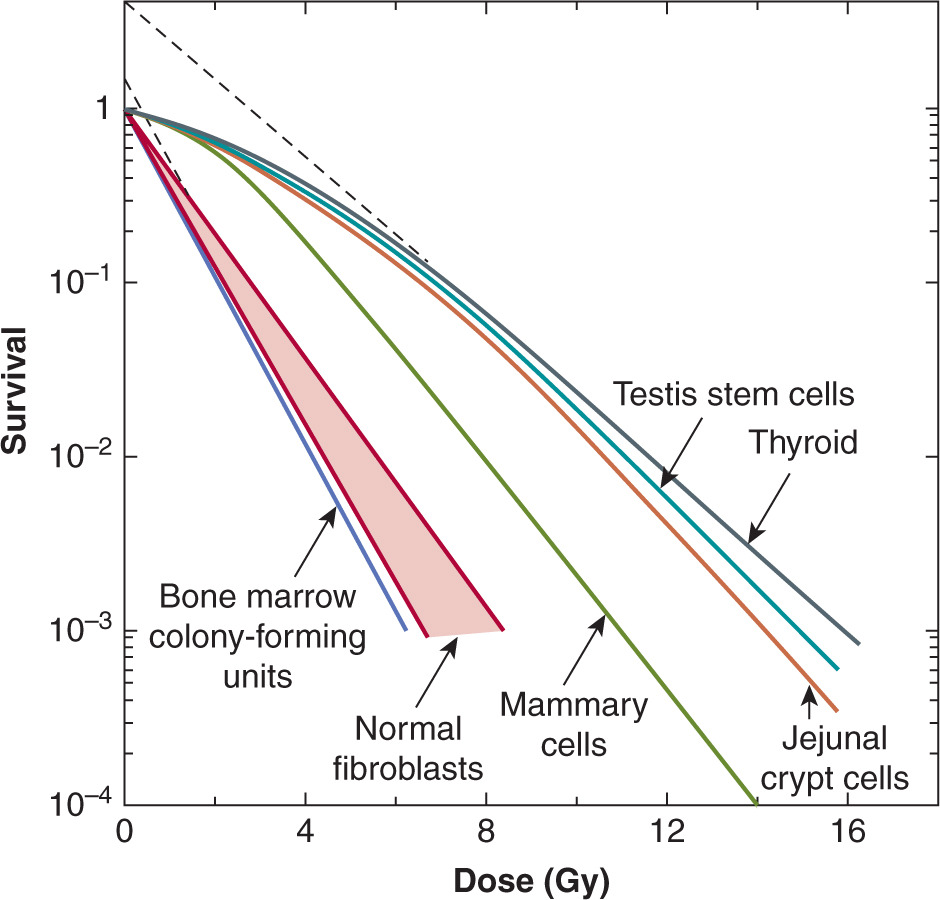
FIGURE 16–13 Survival curves for cells from some normal tissues. Most of the curves are for cells from rodent tissues and the curves were produced using in vivo or in situ clonogenic assays. Survival curves for normal human fibroblasts are for cultured cell strains. (Data compiled by Dr. J.D. Chapman, Fox Chase Cancer Center, Philadelphia.)
Alternative experimental analyses of normal tissue radiation damage most often use functional assays. The crudest functional assay is the determination of the dose of radiation given either to the whole body or to a specific organ that will cause lethality in 50% of the treated animals within a specified time (LD50). The relationship between lethality and single radiation dose is usually sigmoidal in shape, and some experimentally derived relationships for different normal tissues in mice are shown in Figure 16–14.
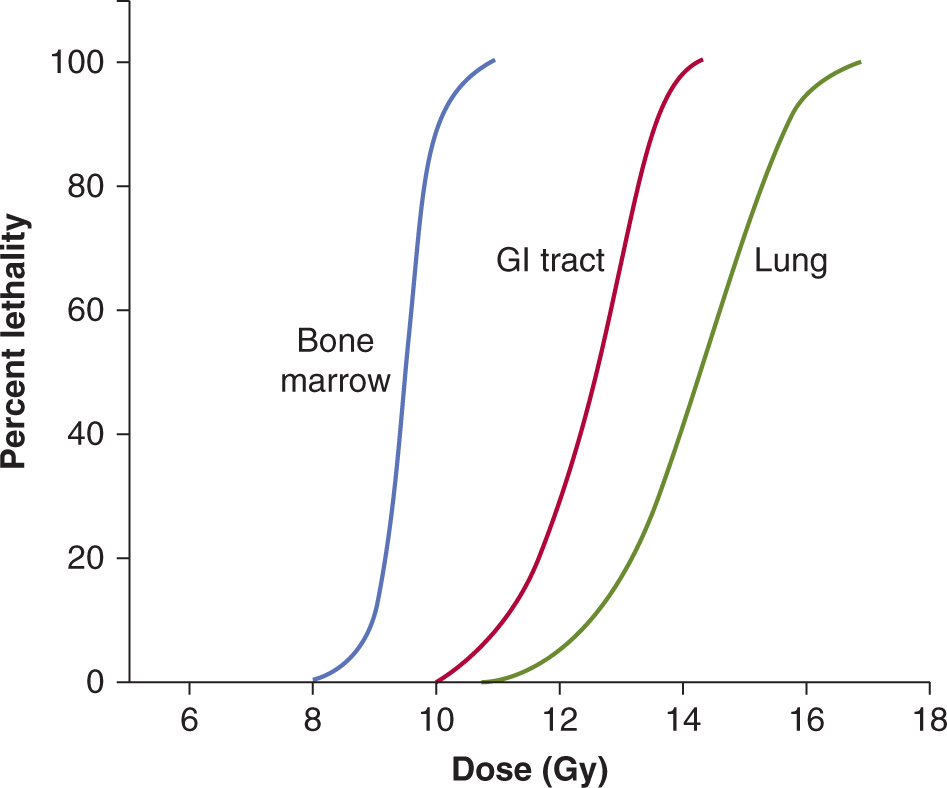
FIGURE 16–14 Three different curves indicating percentage lethality plotted as a function of radiation dose for the same strain of mouse. The “bone marrow” (blue) and “GI tract” (red) curves were obtained using whole-body irradiation and assessing lethality prior to day 30 or prior to day 7, respectively, because death as a result of damage to the gastrointestinal tract occurs earlier than that as a result of bone marrow failure. The green curve labeled “lung” was obtained by assessing lethality 180 days after local irradiation to the thorax.
For individual organs, a level of functional deficit is defined and the percentage of irradiated subjects that express at least this level of damage following different radiation doses is plotted as a function of dose. A tolerance dose for a specific organ can be defined as the dose above which more than 5% of patients express that level of functional deficit (TD5). In animal models, complete dose–response curves have usually been obtained and an example for the rat spinal cord using forelimb paralysis as the end point is shown in Figure 16–15. These curves are sigmoidal in shape and generally quite steep. Similar results have been reported for specific functional deficits in many other tissues (eg, increased breathing rate in lung, reduced flexibility as a result of increased fibrosis in subcutaneous tissue, elevated clearance rates in kidney).
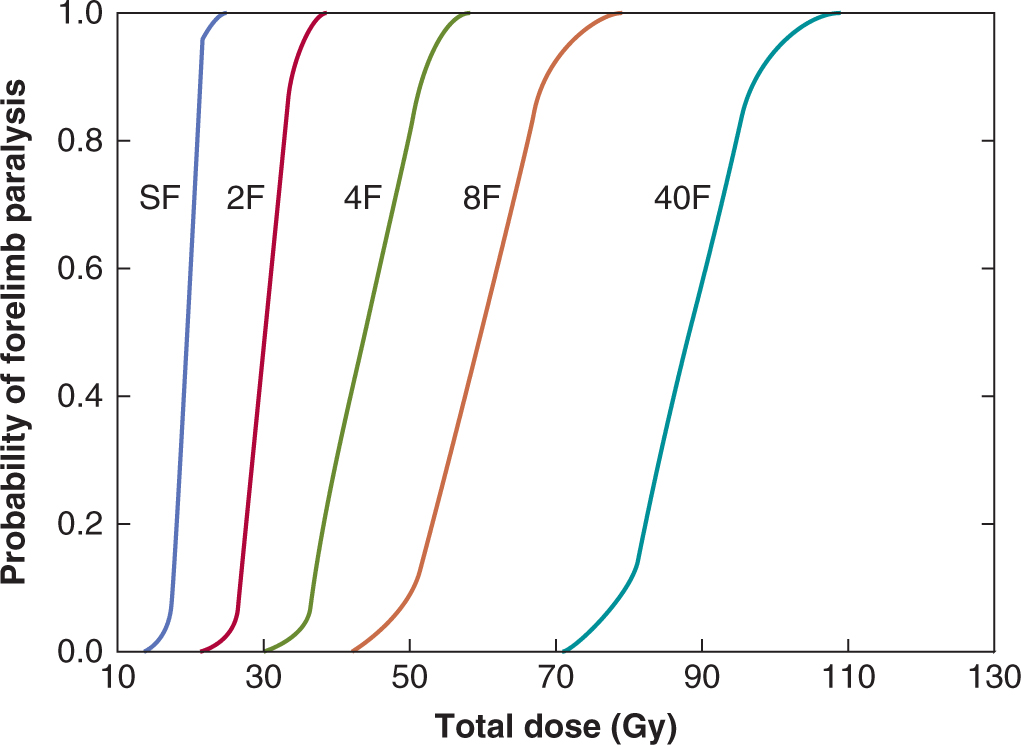
FIGURE 16–15 Dose-response curves for forelimb paralysis following fractionated radiation treatments to the rat spinal cord. The fractions (F) were given once daily to allow for repair of radiation damage between fractions. SF, Single fraction. (Redrawn from Wong et al, 1992.)
An influx of immune cells (macrophages, lymphocytes, and neutrophils) into irradiated tissue and increased cytokine and chemokine expression have been observed within hours after irradiation when there are no apparent functional changes, and aspects of this inflammatory response may persist over months as the irradiated tissue transits to regeneration and repair (Schaue and McBride, 2010). Early increases in cytokine expression can occur after low doses of radiation (~1 Gy), but longer-term changes have been observed after larger doses (5 to 25 Gy). A wide range of cytokines is involved including proand anti-inflammatory factors, such as tumor necrosis factor alpha (TNF-α), interleukin 1 (IL-1α and IL-1β), and TGF-β. In specific tissues, the response to radiation may include other growth factors that are associated with collagen deposition, fibrosis, inflammation, and aberrant vascular growth. These inflammatory factors may induce production of damaging radicals, such as reactive oxygen species, independently of those caused directly by the radiation treatment. The interplay between cell killing, cell repopulation, cytokine production, vascular damage, and immune cells infiltrates in producing the overall tissue damage remains poorly understood and is likely to vary from one organ to another (Stewart and Dorr, 2009).
16.5.2 Acute Tissue Responses
Acute radiation responses occur mainly in renewal tissues and have been related to death of critical cell populations such as the stem cells in the crypts of the small intestine, in the bone marrow, or in the basal layer of the skin. These responses occur within 3 months of the start of radiotherapy (in humans) but are not usually limiting for fractionated radiotherapy because of the ability of the stem cells in the tissue to undergo rapid repopulation to regenerate the transit and end cell populations. Radiation-induced cell death in normal tissues generally occurs when the cells attempt mitosis, thus the tissue tends to respond on a time scale similar to the normal rate of loss of functional cells in that tissue and the demand for proliferation of the supporting stem cells. Radiation-induced apoptosis can also be detected in many tissues, but is usually a minor factor in overall radiation-induced cell death, except in lymphoid and myeloid tissue.
Endothelial cells in the vasculature supporting the crypts and villi of the small intestine of mice have been reported to be prone to radiation-induced apoptosis, and prevention of this effect by treatment with basic fibroblast growth factor can protect the animals against radiation-induced gastrointestinal injury, suggesting that dysfunction of the vasculature can reduce the ability of the crypts to regenerate (Paris et al, 2001). Contrary to most cell killing, which involves DNA damage, radiation-induced apoptosis of endothelial cells can occur via a cell membrane effect leading to activation of the ceramide pathway (see Chap. 15, Sec. 15.3.2) (Kolesnick and Fuks, 2003), and blocking this effect can protect the intestine from radiation damage (Rotolo et al, 2012). These effects appear to be more prominent following larger radiation doses (>10 Gy) such as those used in stereotactic body radiotherapy (SBRT) than at the doses used commonly for fractionated radiation therapy (~2 Gy).
Following irradiation of mucosa (and skin), there is early erythema within a few days of irradiation as a result of increased vascular permeability related to the release of 5-hydroxytryptamine by mast cells. Similar mechanisms may lead to early nausea and vomiting observed following irradiation of the intestine. Expression of further acute mucositis (or moist desquamation in skin) and ulceration depends on the relative rates of cell loss and cell proliferation of the transit cells and the (basal) stem cells in the tissue. The time of expression for this damage depends on the time over which (intensity of) the dose is received (Fig. 16–16), and the extent of these reactions and the length of time for recovery is dependent on the total dose received and the volume (area) of mucosa (or skin) irradiated. Early recovery depends on the number of surviving basal stem cells that are needed to repopulate the tissue and these cells can migrate from undamaged areas into the irradiated area. Erythema occurs in humans at single doses greater than 24 Gy in 2 Gy fractions, whereas mucositis occurs after fractionated doses above approximately 50 Gy in 2 Gy fractions. Severe skin reactions in patients are relatively uncommon as high-energy radiation beams have a build-up region that results in a reduced dose at the skin surface (see Sec. 16.2.4 and Fig. 16–3A), but oral mucositis is prevalent during radiation treatment of head and neck cancers.
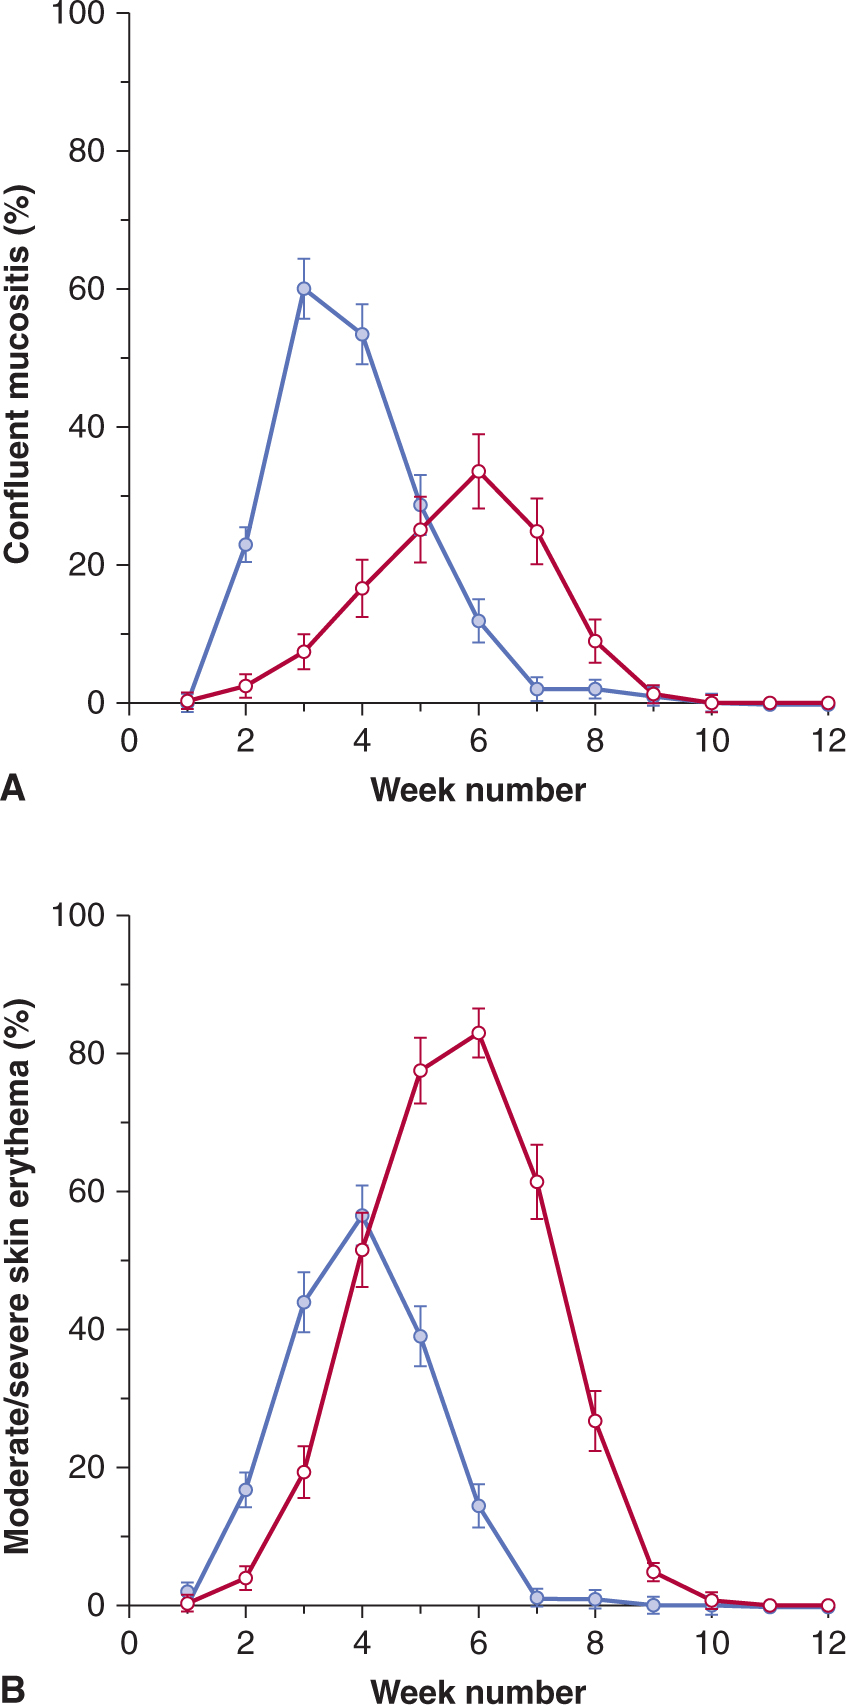
FIGURE 16–16 Estimated prevalence of confluent mucositis (A) or moderate to severe skin reactions (B) in patients following conventional radiotherapy over 5 to 6 weeks (red lines) or accelerated radiotherapy in less than 2 weeks (blue lines) in the CHART (Continuous Hyperfractionated Accelerated Radiotherapy) study. (Modified from Bentzen et al, 2001.)
16.5.3 Late Tissue Responses
Late tissue responses occur in organs whose parenchymal cells normally divide infrequently and hence do not express mitosis-linked death until later times when called upon to divide. They also occur in tissues that manifest early reactions, such as skin/subcutaneous tissue and intestine, but these reactions (subcutaneous fibrosis, intestinal stenosis) are quite different from early reactions in these tissues. Late responses (usually regarded as those which occur more than 3 months after treatment) usually limit the dose of radiation that can be delivered to a patient during radiotherapy. Damage can be expressed as diminished organ function, such as radiation-induced nephropathy (symptoms of hypertension or increased serum creatinine) or myelopathy following spinal cord damage, as illustrated in Figure 16–15, and is usually progressive over time. The nature and timing of late reactions depends on the tissue involved. Damage to stromal and vascular elements of the tissue and the influx of inflammatory cells may cause secondary parenchymal cell death, resulting in increased cell proliferation and further death of parenchymal cells as they attempt mitosis. The latent period to manifestation of organ dysfunction depends on the dose received, because the higher the initial dose the smaller the fraction of surviving parenchymal cells that can repopulate the tissue.
One common late reaction is the slow development of tissue fibrosis that occurs in many tissues (eg, subcutaneous tissue, muscle, lung, gastrointestinal tract), often several years after radiation treatment. Radiation-induced fibrosis is associated with a chronic inflammatory response following irradiation, the aberrant and prolonged expression of the growth factor TGF-β and radiation-induced differentiation of fibroblasts into fibrocytes that produce collagen (Hakenjos et al, 2000; Martin et al, 2000). Transforming growth factor-β also plays a major role in wound healing and the development of radiation fibrosis has similarities to the healing of chronic wounds (Denham and Hauer-Jensen, 2002). Another common late reaction is progressive vascular damage, including telangiectasia that can be observed in skin and mucosa, and loss of microvasculature leading to atrophy (and fibrosis) that is manifest in skin and other tissues. Figure 16–17 shows the development of telangiectasia in patients following fractionated treatment and illustrates that heterogeneity in response between different patients is not limited to tumors but can also occur with normal tissue effects (Turesson et al, 1990).
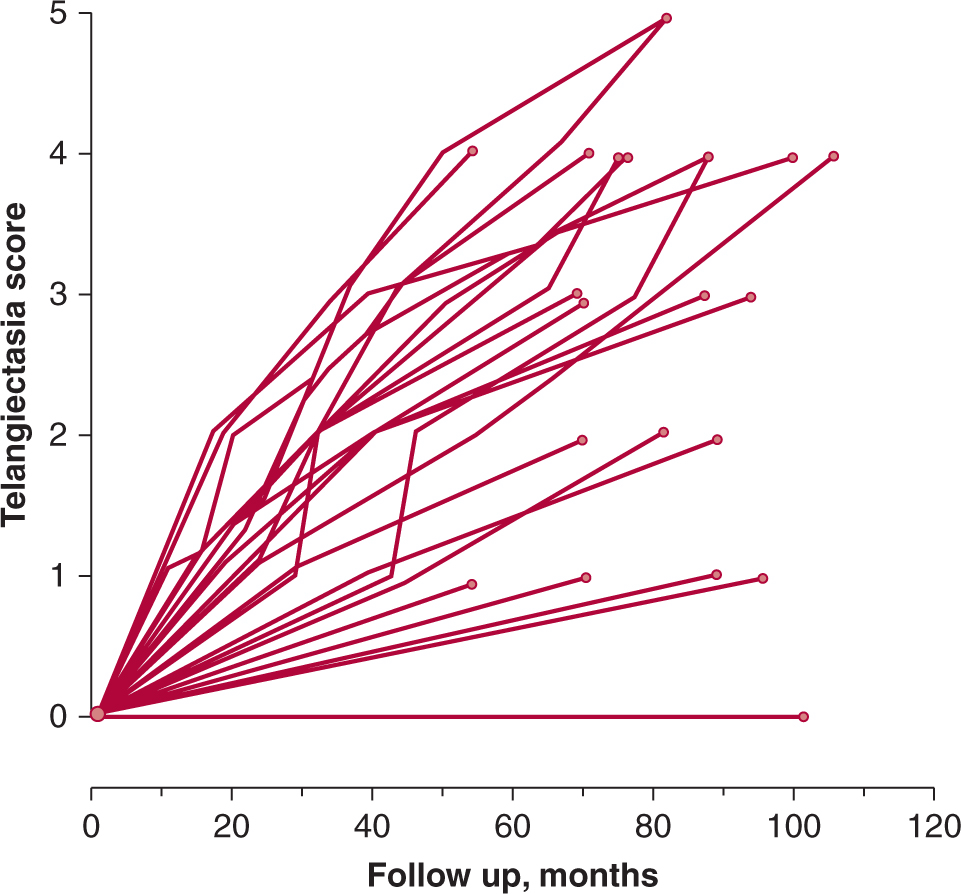
FIGURE 16–17 Clinical manifestations of skin telangiectasis. Progression of telangiectasia in individual patients treated with 5 fractions of 1.8 Gy/wk to a total of 35 fractions. (Redrawn from Turesson, 1990.)
The lung is an important site of late radiation damage. There are 2 types of reactions: pneumonitis that occurs 2 to 6 months after irradiation, and fibrosis that usually occurs more than 1 year after irradiation. These reactions can cause increases in tissue density on CT scans (see Chap. 14, Sec. 14.3.1) and increases in breathing rate if severe. Measuring changes in breathing rate has been used ext ensively to assay the dose–response relationship for radiation-induced lung damage in rats and mice, particularly the development of pneumonitis. Studies in rodents have documented that inflammatory cells and inflammatory cytokines play a major role in lung response to irradiation injury (Fig. 16–18), but the relationship between this inflammatory response and the later development of functional symptoms is unclear. Studies in lung cancer patients suggest that increases in TGF-β levels in plasma following radiotherapy can contribute to the likelihood of developing lung complications (Anscher et al, 1998; Evans et al, 2006).
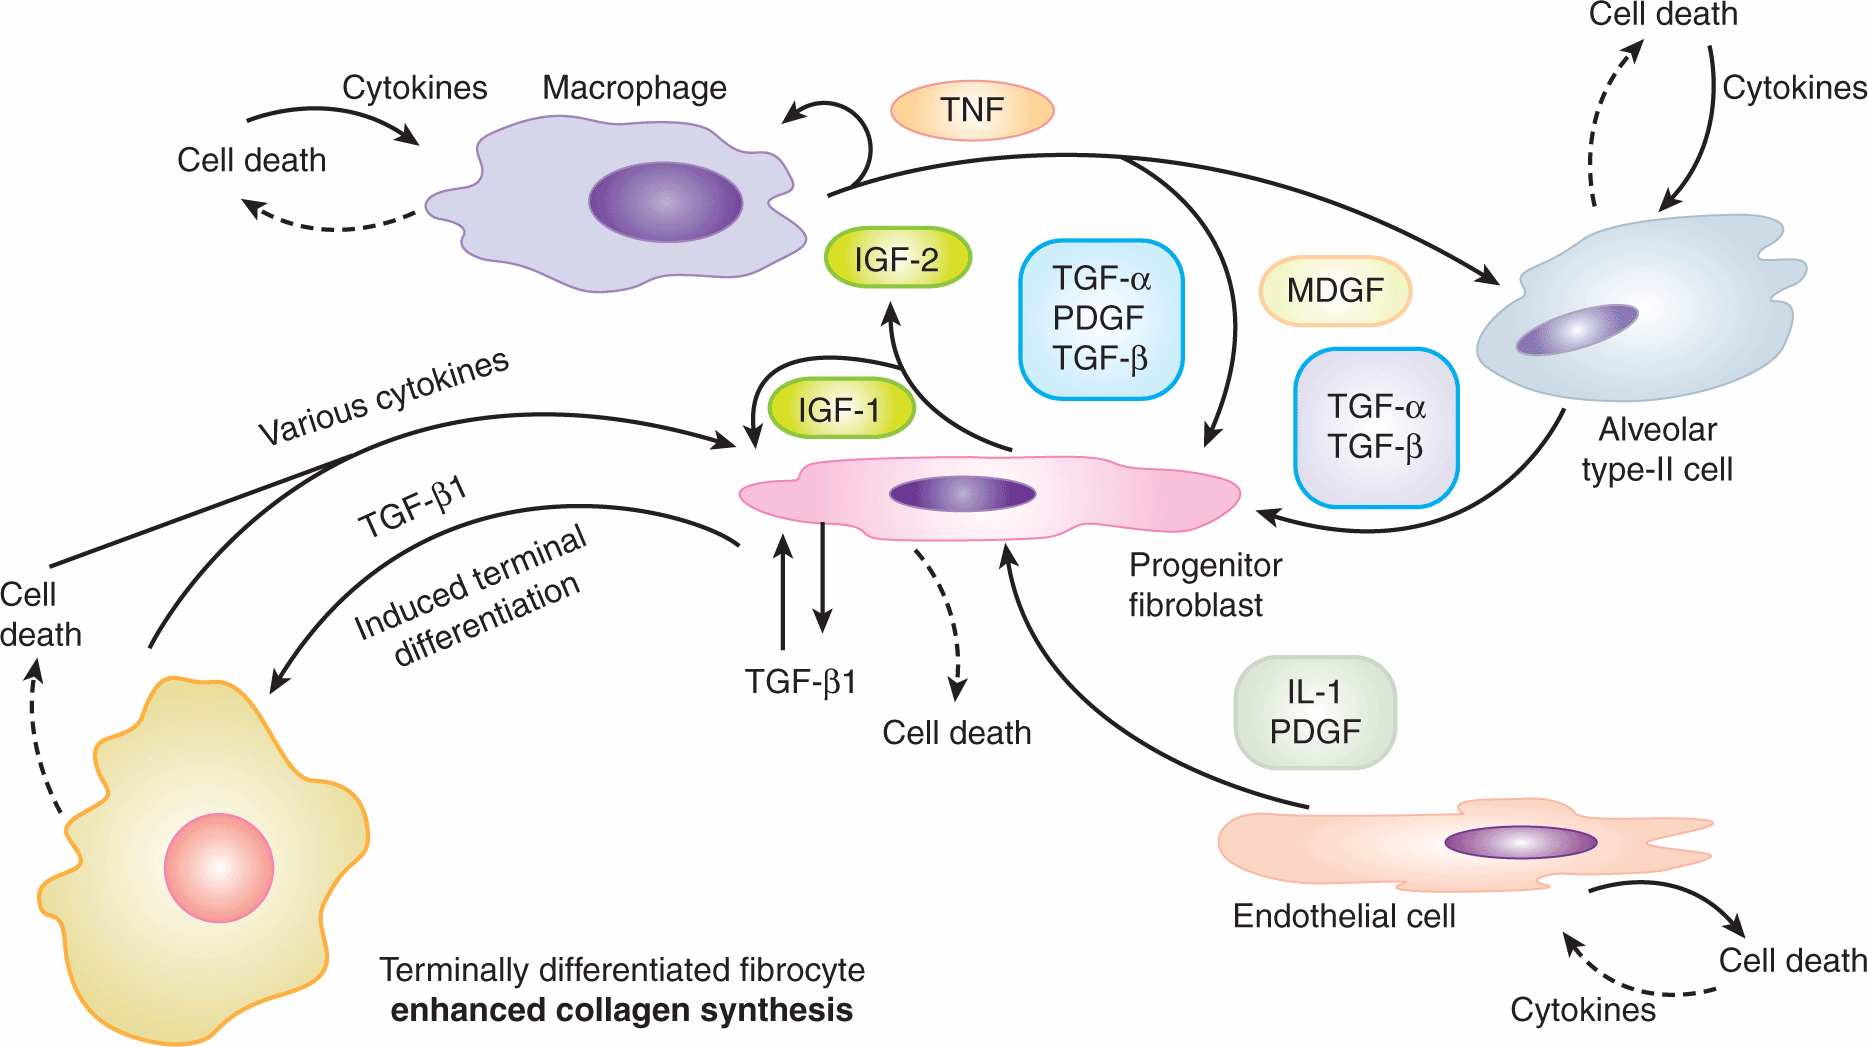
FIGURE 16–18 Potential cellular interactions and cytokine induction after irradiation of lung tissue. The various cell populations and some of the cytokines induced potentially leading to fibrosis (increased collagen levels) are illustrated. (Modified from Rodemann and Bamberg, 1995.)
The dose required to cause functional impairment in lung depends on the volume irradiated, with small volumes being able to tolerate quite large doses (Marks, Bentzen et al, 2010); this is a result of the functional reserve of the remaining lung because the irradiated region will develop fibrosis. Studies in rodents, using the dose required to cause an increased breathing frequency in 50% of animals (ED50) as an end point, have defined a relationship between ED50 and lung volume irradiated, which indicates that the base of the lung is more sensitive than the apex (Travis et al, 1997). The underlying mechanisms may relate to the functional reserve in different regions of the lung and/or to the extent of cytokine production following irradiation of different regions of the lung. There is also evidence for regional effects following irradiation of human lung (Marks, Bentzen et al, 2010).
A theoretical framework introduced by Withers et al (1988b) suggests that late responding tissues can be considered as arrays of functional subunits (FSU) containing groups of cells that are critical for function (eg, bronchioli in lung, nephrons in the kidney). These FSU were postulated to be able to be regenerated from a single surviving tissue stem cell. Furthermore, tissues were considered to have these FSU operating in parallel to achieve overall tissue function (such as occurs in lung, kidney, liver) or in series (such as in spinal cord or intestine) in analogy with electrical circuits. Tissues with a parallel structure of FSU have substantial reserve capacity and, although damage to a small volume may completely inactivate this volume, the remaining regions can maintain function and/or may undergo hypertrophy to replace any loss of function (eg, kidney and liver). Tissues with a series structure of FSU may cease to function if even a small region of the tissue is irreparably damaged, such as may occur in the spinal cord where localized injury can cause complete tissue dysfunction and myelopathy, or in the intestine if severe stenosis causes obstruction. In practice, tissues do not fall neatly into these 2 categories for various reasons, including the common role of the vasculature, the development of inflammatory responses that may extend beyond the treatment field, because FSU may require more than one type of undamaged stem cells for repair and these stem cells may migrate into areas of damage either locally or via the circulation. However, the concept that the volume irradiated to high dose is critical to tissue response and that this varies for different organs is well established and used in mathematical models designed to predict normal tissue complication probabilities (NTCP) (Bentzen et al, 2010; Marks, Yorke et al, 2010).
16.5.4 Whole-Body Irradiation
The response of animals to single-dose whole-body irradiation can be divided into 3 separate syndromes (hematological, gastrointestinal, and neurovascular) that manifest following different doses and at different times after irradiation (Mettler and Voelz, 2002; Dainiak et al, 2003). The neurovascular syndrome occurs following large doses of radiation (>20 Gy) and usually results in rapid death (hours to days) as a consequence of cardiovascular and neurological dysfunction. The gastrointestinal syndrome occurs after doses greater than approximately 5 to 15 Gy and, in rodents, doses at the upper end of this range usually result in death at about 1 week after irradiation as a consequence of severe damage to the mucosal lining of the gastrointestinal tract; this causes a loss of the protective barrier with consequent infection, loss of electrolytes, and fluid imbalance. Intensive nursing with antibiotics, fluid, and electrolyte replacement can prevent early death from this syndrome in human victims of radiation accidents, but these patients may die later as a result of damage to other organs, particularly skin, if large areas are exposed. The hematopoietic syndrome occurs at doses in the range of 2 to 8 Gy in humans (3 to 10 Gy in rodents) and is caused by severe depletion of blood elements as a result of killing of precursor cells in the bone marrow. This syndrome causes death in rodents (at the higher dose levels) between approximately 12 to 30 days after irradiation, and somewhat later in larger animals, including humans. Death can sometimes be prevented by bone marrow transplantation (BMT) and cytokine therapy (eg, GM-CSF [granulocyte-macrophage colony-stimulating factor], G-CSF [granulocyte colony-stimulating factor], stem cell factor) provided that the radiation exposure is not too high when damage to other organs may become lethal. Following the Chernobyl accident, 28 of the emergency workers (of 104 identified as showing symptoms of acute radiation syndrome) died within 4 months. Most of these workers received bone marrow doses greater than 4 Gy and much higher doses to the skin (10 to 30 times). Bone marrow failure was the primary cause of death, particularly for those dying within the first 2 months. Although 13 of these patients had BMT, most died, probably because of serious radiation damage to the skin (UNSCEAR, 2008). There are substantial differences in the doses required to induce death from the hematopoietic syndrome (ie, LD50 value) between different species of animals and even between different strains of the same species. The LD50 value for humans has been estimated at 4 to 7 Gy, depending on the available level of supportive care (excluding BMT). Following doses greater than approximately 2 Gy, humans will develop early nausea and vomiting within hours of irradiation (prodromal syndrome), which may be controlled with 5-hydroxytryptamine antagonists.
16.5.5 Retreatment Tolerance
Although tissues may repair damage and regenerate after irradiation, previously irradiated tissues may have a reduced tolerance for subsequent radiation treatments, indicating the presence of residual injury. For tissues that undergo only an early response to radiation, there is almost complete recovery in a few months, so that a second high dose of radiation can be tolerated. For late-responding tissue damage, the extent of the residual injury depends on the level of the initial damage and is tissue dependent. There is substantial recovery in skin, mucosa, spinal cord, and lung over a period of 3 to 6 months, but kidney and bladder show little evidence of recovery (Stewart and Dorr, 2009). Clinical studies have demonstrated that retreatment to high doses with curative intent is possible depending on the tissues involved but usually entails increased risk of normal tissue damage.
16.5.6 Predicting Normal Tissue Response
Patients receiving identical radiation treatments may experience differing levels of normal tissue injury (see, eg, Fig. 16–17). Thus predictive assays might be useful in identifying those patients who are at greater risk of experiencing the side effects of radiotherapy. The enhanced radiosensitivity of patients with ataxia telangiectasia (AT) and other DNA repair-deficiency syndromes (see Chap. 5, Sec. 5.5) supports a genetic contribution to individual variability in radiosensitivity, although other factors, such as diet or environment, could also play a role. Studies of women with breast cancer show individual correlation of acute and late skin reactions in one treatment field with those in a different treatment field (Bentzen et al, 1993). Several studies have quantified the in vitro radiosensitivity of fibroblasts and peripheral lymphocytes as a potential predictive assay for normal tissue damage. These studies show variations in the radiosensitivity of fibroblasts from individual patients, but are inconsistent in predicting late radiation fibrosis (Russell and Begg, 2002). Fibro-blasts from people who are heterozygous for mutations in the ATM gene are reported to have increased radiosensitivity, but it has not been possible to directly link severity of normal tissue reactions to heterozygosity in this gene. Thus, although cellular sensitivity is an important contributor to normal tissue damage, other factors, such as cytokine induction and the response of the tissue stroma and vasculature, likely also play an important role in normal tissue injury. In rodents, genetic differences associated with different strains have been reported to influence the development of normal tissue damage, for example, pneumonitis and fibrosis following lung irradiation, although these factors do not affect the radiosensitivity of lung fibro-blasts directly (Haston et al, 2002). Extensive genetic screening of large populations is underway to identify genetic alterations or gene signatures that may predict patients predisposed to differential responses to irradiation (West et al, 2010).
16.5.7 Radioprotection
Many agents can protect against radiation damage to cells in culture (Weiss and Landauer, 2009). These include agents that can scavenge radiation-produced radicals, such as dimethyl sulfoxide (DMSO), or the superoxide dismutase enzymes (SODs), or sulfhydryl-containing compounds, such as glutathione, and cysteine. These latter compounds can also donate a hydrogen atom back to a radical site created on a macromolecule such as DNA by hydroxyl radicals produced by water radiolysis. Because of the short lifetimes of radiation-induced radicals, exogenously added agents have to be present in the cell at the time of the irradiation. They are equally effective for tumor and normal cells in vitro; thus specificity for therapeutic application in vivo depends largely on preferential uptake of such agents into the normal tissue. One agent that appears to fulfill this criterion is amifostine, a prodrug that is converted into a sulfhydryl-containing compound in vivo by the action of alkaline phosphatases. The selective activity of this compound in normal tissue is believed to be a result of poor penetration from tumor blood vessels and reduced levels of alkaline phosphatase in tumors. Amifostine was shown to protect a variety of normal tissues with variable, mostly small, protection of tumors in animal models (for review, see Lindegaard and Grau, 2000). Studies in patients with head and neck and lung cancers show substantial protection of normal tissue, including salivary gland, lung, and mucosa, without detectable change in tumor response (Brizel et al, 2000; Antonadou et al, 2003), although the compound is not widely used clinically because of unrelated toxicities.
Another strategy for protection of normal tissue is to block the development of late radiation effects with treatment given after the end of the radiation. The use of steroids after irradiation to prevent lung injury is an example, although this treatment appears to delay the development of symptoms rather than prevent them. Agents that block angiotensin-converting enzyme (ACE) activity (eg, captopril, enalapril) or that block directly the action of angiotensin II mitigate the development of radiation-induced pulmonary fibrosis and nephropathy, respectively (Cohen et al, 2011). Various strategies, including antiinflammatory agents and antioxidants, are being studied in patients to determine whether they can reverse the progressive nature of radiation-induced fibrosis and necrosis (Delanian and Lefaix, 2007; Delanian et al, 2011). Extensive efforts are underway to develop agents to mitigate multiple organ damage in cases of accidental radiation exposure (Williams and McBride, 2011).
16.5.8 Therapeutic Ratio
The concept of therapeutic ratio is illustrated in Figure 16–19, which shows theoretical dose–response curves for tumor control and normal tissue complications as described in Sections 16.3.1 and 16.5.1 (see also similar curves for systemic therapy in Chap. 17, Fig. 17-9). Tumor-control curves (red lines) tend to be shallower than those for normal tissue response (blue lines) because of the large heterogeneity among tumors as discussed in Section 16.3.1. The therapeutic ratio is often defined as the percentage of tumor cures that are obtained at a given level of normal tissue complications (ie, by taking a vertical cut through the 2 curves at a tolerance dose, eg, at 5% complications after 5 years). In experimental studies, an alternative approach is to define the therapeutic ratio as the ratio of radiation doses Dn/Dt required to produce a given percentage of complications and tumor control (usually 50%). It is then a measure of the horizontal displacement between the 2 curves. It remains imprecise, however, because it depends on the shape of the dose–response curves for tumor control and normal tissue complications. The curves shown in Figure 16–19A depict a situation in which the therapeutic ratio is favorable because the tumor-control curve is displaced to the left of that for normal tissue damage. The greater this displacement, the more radiocurable the tumor. Because the tumor-control curve is shallower than that for normal tissue damage, the therapeutic ratio tends to be favorable only for low and intermediate tumor-control levels. If the 2 curves are close together or the curve for tumor control is displaced to the right of that for complications (Fig. 16–19B), the therapeutic ratio is unfavorable because a high level of complications must be accepted to achieve even a minimal level of tumor control.
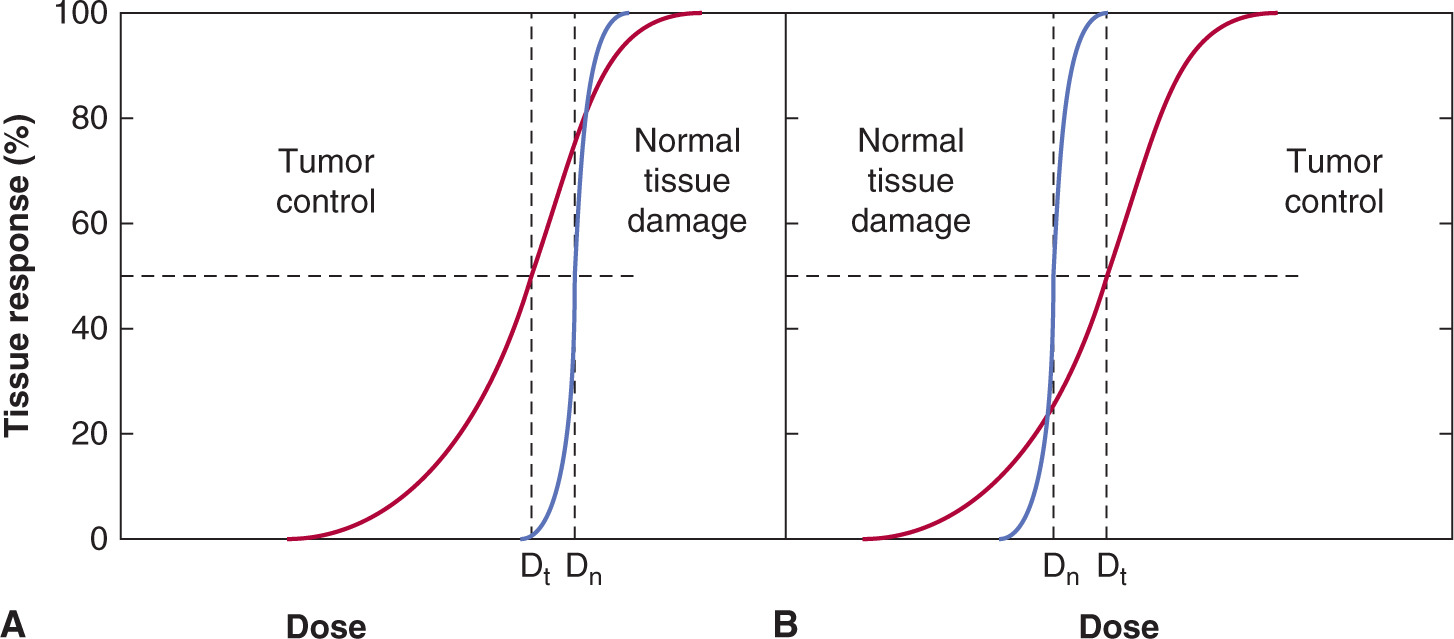
FIGURE 16–19 Illustration of the concept of a therapeutic ratio in terms of dose–response relationships for tumor control and normal tissue damage. The red curves represent dose response for tumor control, and the blue curves represent dose response for critical normal tissue damage. See the text for specific discussion of the 2 parts of the figure.
16.6 RADIOTHERAPY FRACTIONATION
It is generally accepted that the therapeutic ratio is improved by fractionating radiation treatments. Many of the underlying biological effects occurring during fractionated radiation treatment have been identified, and improvement of the therapeutic ratio may be explained in terms of the biological response of tissue. The most important biological factors influencing the responses of tumors and normal tissues to fractionated treatment are often called the “five Rs”: radiosensitivity, repair, repopulation, redistribution, and reoxygenation. These biological factors were introduced in Chapter 15, and radiosensitivity of tumors and normal tissues is discussed in Sections 16.3 and 16.5 above. Here these concepts are discussed further in the context of fractionated irradiation.
16.6.1 Repair
The shoulder on a survival curve after single radiation doses is usually indicative of the capacity of the cells to accumulate and repair radiation damage. If multiple doses are given with sufficient time between the fractions for repair to occur (4 to 24 hours, depending on the cells or tissue involved) survival curves for cells treated with fractionated irradiation will be similar to those illustrated in Figure 16–20. The dashed lines in this figure represent the effective survival curves for different fractionated treatments. The effective slope depends on the size of the individual dose fractions, becoming shallower as the fraction size is reduced (eg, blue curve vs green curve). This effect is also illustrated by the dose-response curves shown in Figure 16–15 for forelimb paralysis of rats following irradiation with different numbers of fractions to the spinal cord, where the curves for higher numbers of (smaller) fractions are displaced to higher total doses.
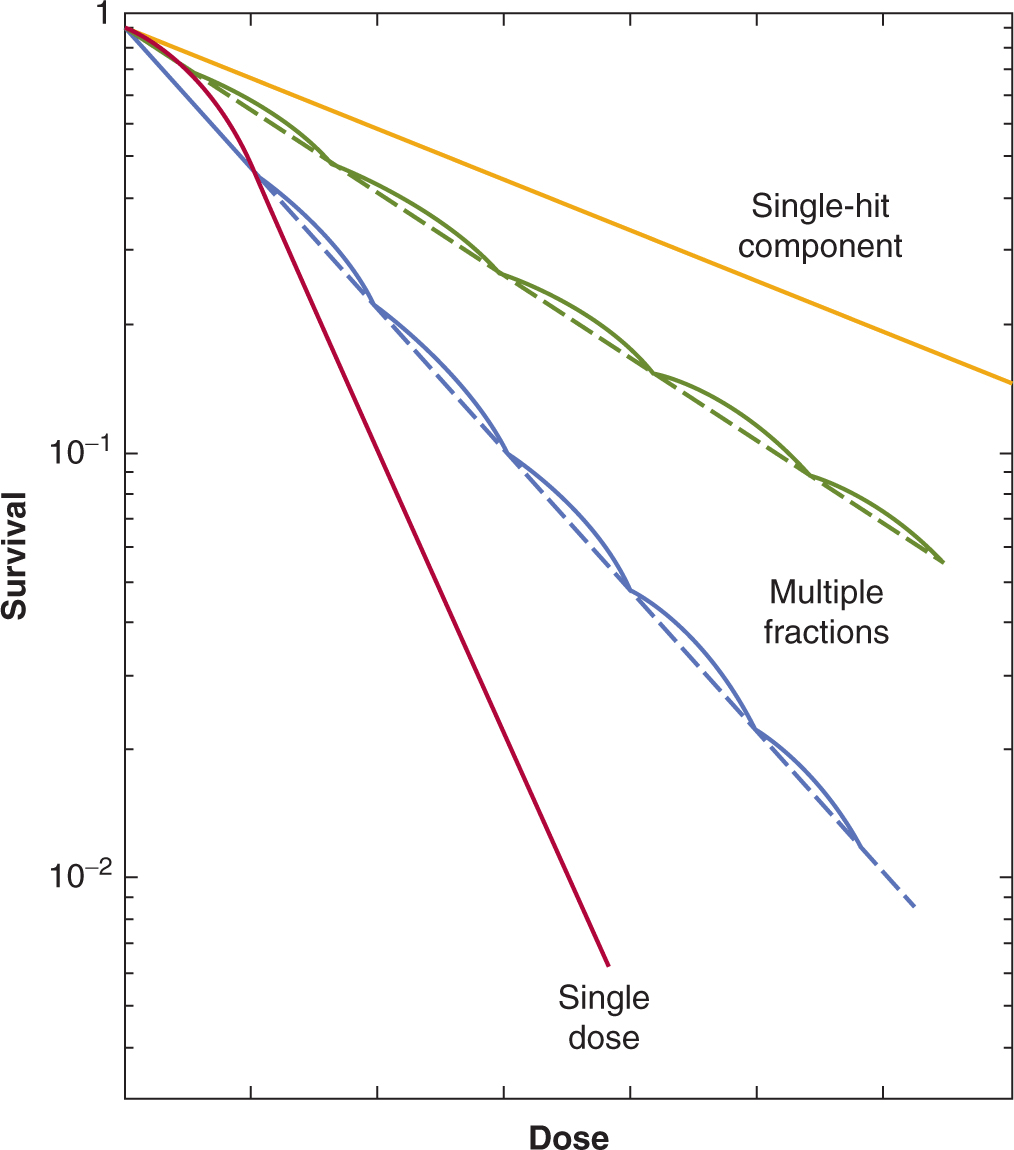
FIGURE 16–20 The influence of fractionating the radiation treatment on the shape of cell-survival curves. When repair occurs between the fractions, the shoulder of the survival curve is repeated for every fraction resulting in curves that are shallower for smaller fraction sizes (eg, blue vs green curves). The curve labeled “single-hit component” (orange curve) is discussed in the text.
The single-dose (red) survival curve for most cells has a finite initial slope, apparently as a result of a nonrepairable component of radiation damage (see Chap. 15, Appendix 15.1), so there is a limit below which further reduction of the fraction size will no longer reduce the effective slope of the survival curve (see orange curve in Fig. 16–20); this limit differs among cell populations. When the size of the individual dose fraction is such that survival is represented by the curvilinear shoulder region of the survival curve, as for most dose fractions used clinically, then repair will be maximal when equal-sized dose fractions are given. Thus, if a certain total dose is given with unequal fraction sizes, it would produce more damage than the same total dose given in equal fraction sizes.
16.6.2 Repopulation
In both tumors and in normal tissues, proliferation of surviving cells may occur during the course of fractionated treatment. Furthermore, as cellular damage and cell death occur during the course of the treatment, the tissue may respond with an increased rate of proliferation of the surviving cells. The effect of this cell repopulation, will be to increase the number of surviving cells during the course of the treatment and reduce the overall response to irradiation. This effect is most important in early responding normal tissues (eg, skin, gastrointestinal tract) or in tumors whose stem cells are capable of rapid proliferation. In contrast, it will be of little consequence in late-responding, slowly proliferating tissues (eg, kidney, liver, spinal cord), which do not suffer much early cell death and hence do not produce an early proliferative response to the radiation treatment. Figure 16–21 illustrates the effect of repopulation for early skin reactions versus (lack of repopulation) for late kidney response. Regenerative responses are particularly important in reducing acute normal tissue responses during prolonged treatments, such as those involving a period without irradiation (split-course treatment), but this effect can also be important in decreasing tumor response as discussed below.
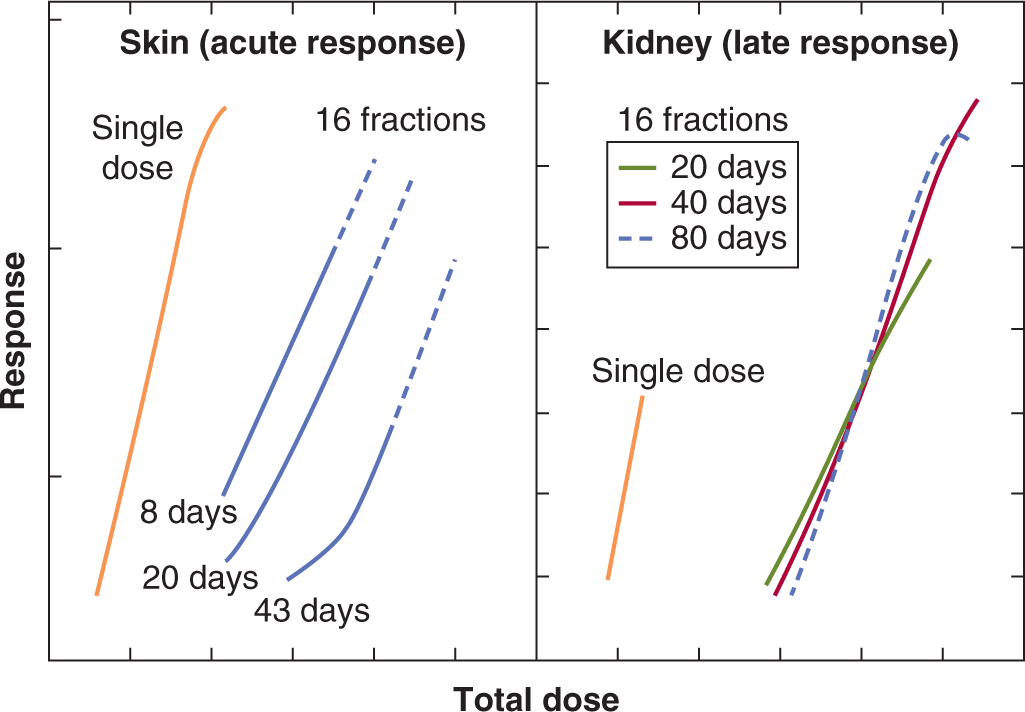
FIGURE 16–21 Illustration of the effect of repopulation during fractionated treatment of skin or kidney. Treatment was a single dose or 16 equal fractions given in different overall times as indicated. Acute skin response was assessed using a numerical scoring technique and kidney response was determined by reduction in ethylenediaminetetraacetic acid (EDTA) clearance. For both tissues the fractionated treatment results in the curves moving to the right (higher doses) due to repair. For the acute skin reactions, extending the time over which a course of 16 fractions is given (from 8 days to 43 days) results in a further increase in the total dose required for a given level of response (isoeffective dose). In contrast, for late response of kidney there is no change in the isoeffective dose for 16 fractions regardless of whether the treatment is given over 20 or 80 days. (Modified from Denekamp, 1986.)
Repopulation is likely to be more important toward the end of a course of treatment, when sufficient damage has accumulated (and cell death occurred) to induce a robust regenerative response. This is consistent with clinical observations that oral mucosa can start to heal toward the end of a 6- to 7-week course of therapy, despite the continued treatment, because of rapid proliferation of basal (stem) cells in the mucosa. Similar increases in proliferation of surviving (stem) cells can also occur in tumors. Evidence that accelerated repopulation can occur in human tumors during a course of fractionated therapy is shown in Figure 16–22. Here the (normalized) total dose required to give 50% control of head and neck cancers is plotted as a function of the overall duration of the fractionated treatment. For overall times less than approximately 3 to 4 weeks, there is little change in the dose required for 50% tumor control; at longer times, however, there is a substantial increase in the total dose required as the duration of treatment increases. This observation suggests that the initial part of the fractionated therapy has resulted in increased proliferation of the surviving tumor stem cells, which for head and neck tumors becomes apparent at 3 to 4 weeks after the start of the treatment. The data are consistent with an (accelerated) doubling time of approximately 4 days for the clonogenic tumor cells, compared to a median volume doubling time of approximately 2 to 3 months for unperturbed tumor growth (see Chap. 12, Sec. 12.1.1). Repopulation of tumor cells during a conventional course of radiotherapy is an important factor influencing local tumor control in patients with rapidly growing tumors and is the reason why it is preferable to avoid treatment delays during therapy. Repopulation provides the biological rationale for accelerated fractionated radiation therapy (see Sec. 16.7.4). Overall treatment time would be expected to be less important for slower-growing tumors such as prostate or breast cancer.
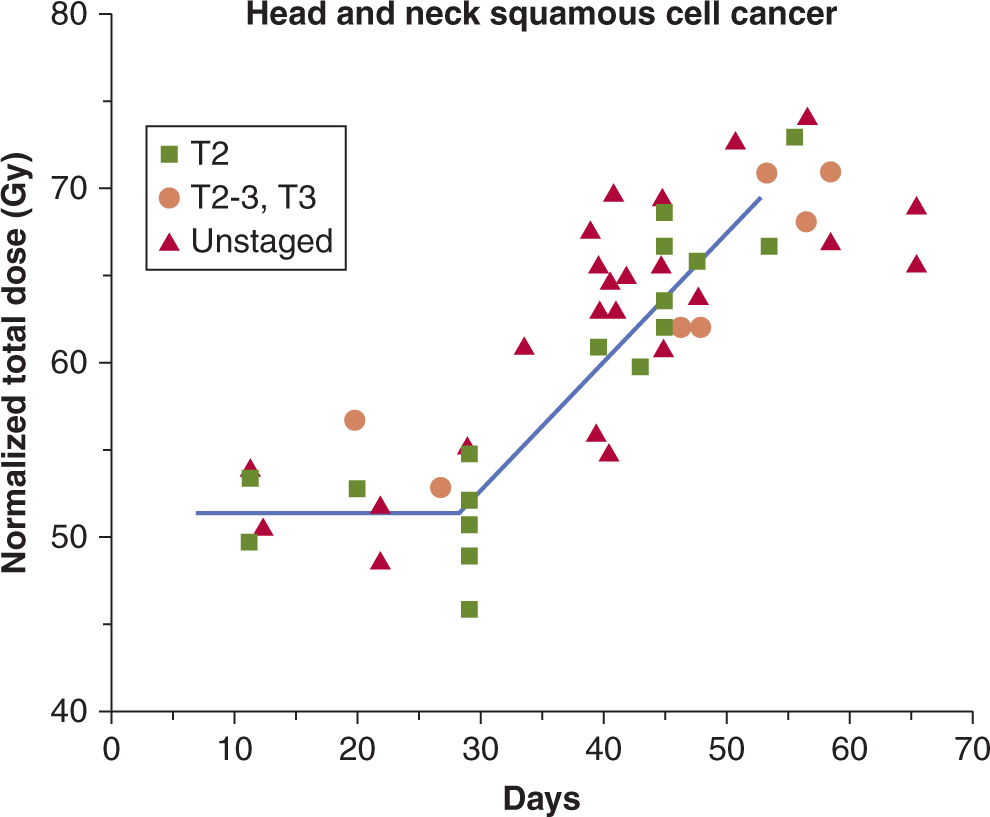
FIGURE 16–22 Estimated total doses of fractionated irradiation required to achieve 50% probability of tumor control for squamous cell carcinomas of the head and neck (various stages) plotted as a function of the overall treatment time. Each point is for a different group of patients and is obtained from published results. The actual doses used to treat the different groups of patients were normalized to a standard schedule of 2 Gy per fraction using the technique described in Section 16.7.3. (Modified from Withers et al, 1988a.)
Attempts to predict the effects of accelerated repopulation in tumors have focused on measurements of the potential doubling time (Tpot), which assesses the underlying rate at which new tumor cells are added to the tumor cell population, ignoring cell loss. Values of Tpot for human tumors can be estimated using methods described in Chapter 12, Section 12.1.2; such values vary widely for different tumors, but the median is in the range of 4 to 5 days (Begg, 1995). The pretreatment T might reflect the proliferative rate of the surviving tumor cells following radiotherapy, and a trend for an adverse treatment outcome associated with short Tpot values has been reported in patients with head and neck cancer and cervical cancer. However, subsequent studies have not confirmed its utility in predicting the benefit of reducing overall treatment time (Begg et al, 1999; Wilson, 2007), perhaps because the assay measures the proliferation of all the cells (both progenitor and stem cells) and may thus not assess the proliferation of the cell population critical for tumor control. In the context of individualized therapy, new approaches to directly measure tumor stem cell proliferation may help to identify which patients have tumors needing accelerated therapy. An alternative approach may be combination with systemic therapy (see Sec. 16.2.5 and Chap. 17, Sec. 17.6.4) to reduce repopulation during treatment, although this may exacerbate early normal tissue reactions.
16.6.3 Redistribution
Variation in the radiosensitivity of cells in different phases of the cell cycle results in the cells in the more resistant phases being more likely to survive a dose of radiation (see Chap. 15, Sec. 15.4.1). Two effects can make the cell population more sensitive to a subsequent dose of radiation. Some of the cells will be blocked in the later (sensitive) part of G2 phase and some of the (more resistant) surviving cells will redistribute into other parts of the cell cycle (which by definition are more sensitive). Both effects will tend to make the whole population more sensitive to fractionated treatment as compared with a single dose. Because redistribution inevitably involves cell proliferation, cell survival also will be influenced (in the opposite direction) by repopulation. Both redistribution and repopulation are important primarily in proliferating cell populations. Also, not all cell lines show large differences in radio-sensitivity between different cell-cycle phases, and the effect of redistribution will be correspondingly less for these types of cells. In many normal tissues (and probably in some tumors), stem cells can be in a resting phase (G0) but can be recruited into the cell cycle to repopulate the tissue. There is some evidence that cells in cycle are slightly more sensitive to radiation than G0 cells, possibly because G0 cells may repair more potentially lethal damage (see Chap. 15, Sec. 15.4.2). Recruitment of resting cells into the proliferative cycle during the course of fractionated treatment may, therefore, tend to increase the sensitivity of the whole population. Neither recruitment nor redistribution would be expected to have much influence on late responses, as these occur predominantly as a result of injury to tissues in which the proportion of cells in proliferative phases of the cell cycle is low.
16.6.4 Reoxygenation
The response of tumors to large single doses of radiation is dominated by the presence of hypoxic cells within them, even if only a very small fraction of the tumor stem cells are hypoxic (see Sec. 16.4.2). Because hypoxic cells are resistant to radiotherapy, the proportion of the surviving cells (those retaining long-term proliferative ability; see Chap. 15, Sec. 15.3.1) that is hypoxic will be elevated immediately after a dose of radiation. However, with time, some of the surviving hypoxic cells may gain access to oxygen (reoxygenate) and become more sensitive to a subsequent radiation treatment. Reoxygenation can result in a substantial increase in the sensitivity of tumors during fractionated treatment. The survival curve following fractionated irradiation for a tumor containing 10% hypoxic cells that do not reoxygenate would be dominated at higher doses by the radioresistant hypoxic cells (Fig. 16–23, blue (b) and green (a) dashed lines), whereas that for a tumor cell population that has complete reoxygenation between dose fractions (Fig. 16–23, turquoise (d) dashed line) lies close to the curve for a fully oxygenated population. In practice there will also be many cells at intermediate oxygen levels in tumors, and as seen in Fig. 16–23 (orange (c) dashed line) these cells will dominate the survival curve when reoxygenation occurs during fractionated treatment (Wouters and Brown, 1997). Reoxygenation has been shown to occur in almost all rodent tumors that have been studied, but the extent and timing of reoxygenation are variable. One mechanism for this effect is the fluctuations of blood flow and the resulting short-term (acute) hypoxia that is caused (see Sec. 16.4.2). Cells that were (acutely) hypoxic at the time of the radiation will be reoxygenated by this process, probably within a few hours. Other potential mechanisms include reduced oxygen utilization by radiation-damaged cells, or rapid death and removal of radiation-damaged cells so that the hypoxic cells become closer to functional blood vessels.
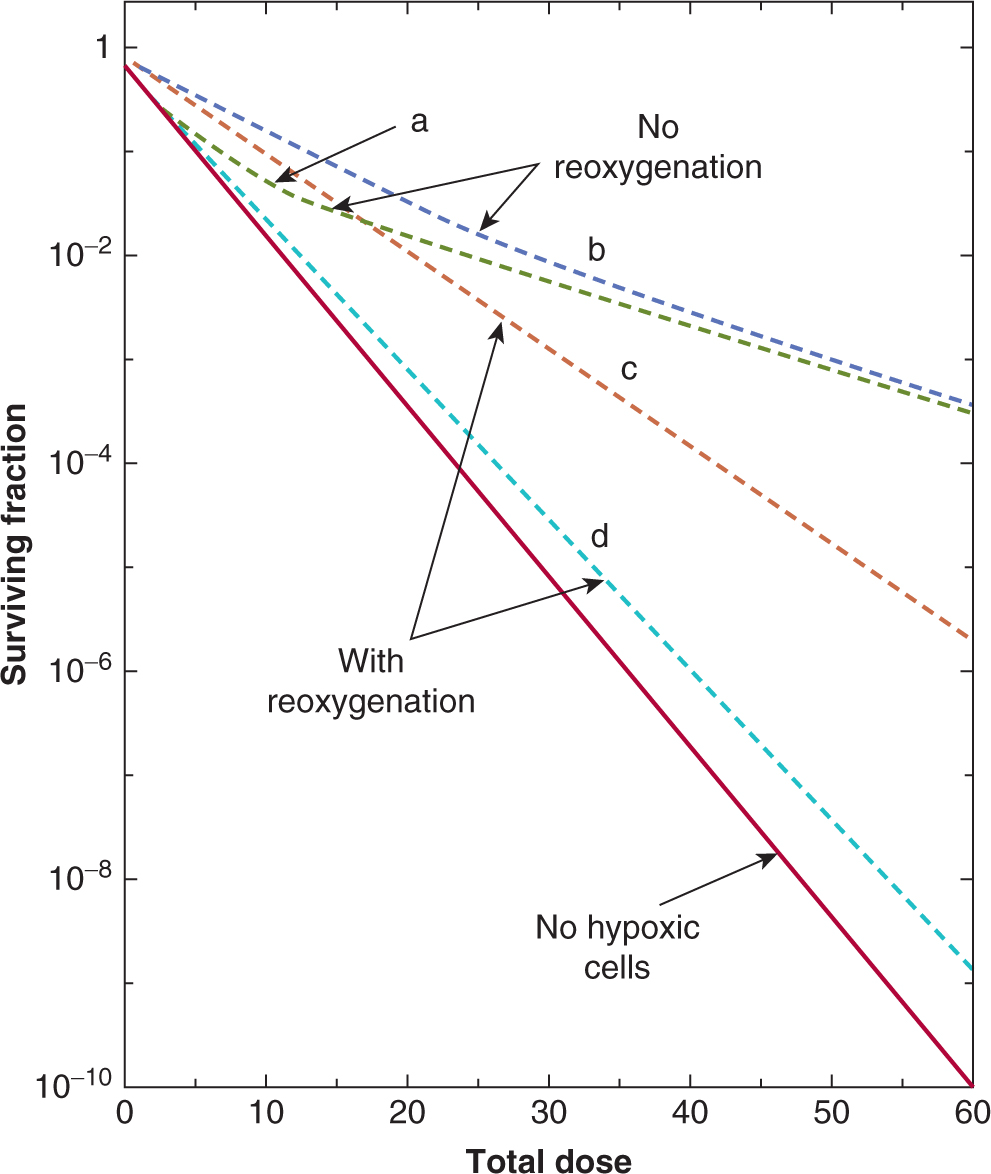
FIGURE 16–23 Theoretical survival curves calculated to illustrate the influence of reoxygenation on the level of cell killing in a tumor following treatment with 2-Gy fractions. The solid red line illustrates the expected survival curve for a tumor with no hypoxic cells. For a tumor with hypoxic cells, it was assumed that the tumor initially had 10% hypoxic cells and either 90% well-oxygenated cells (green (a) and turquoise (d) dashed lines representing survival without and with reoxygenation respectively) or a proportion of well-oxygenated cells and cells at intermediate oxygen concentrations calculated using a radial diffusion model (blue (b) and orange (c) dashed lines representing survival without and with reoxygenation respectively). It was assumed that reoxygenation was sufficient to maintain the same proportions of hypoxic cells among the surviving cells during the fractionated treatment. (Redrawn from Wouters and Brown, 1997.)
It is probable that reoxygenation is a major reason why fractionating treatment leads to an improvement in therapeutic ratio (as compared to a few large doses) in clinical radiotherapy. There is limited direct information about reoxygenation of cells in human tumors during treatment, but measurements of the pO2 in human tumors using Eppendorf oxygen electrodes (see Sec. 16.4.3) during fractionated radiotherapy have demonstrated increasing oxygen levels in some tumors (Dunst et al, 1999). Although this is consistent with reoxygenation, these measurements do not distinguish between oxygen levels of surviving cells and those of cells already inactivated by the treatment. Evidence that the oxygen status of tumors can predict treatment outcome following radiation therapy (see Sec. 16.4.3) suggests that reoxygenation is inadequate to eliminate the effects of hypoxia during standard fractionated treatment for at least some tumors (eg, head and neck cancers) in humans. Shortening treatment schedules as in stereotactic body radiotherapy (SBRT) (see Sec. 16.1) may exacerbate this problem as data from animal models demonstrate that treatments with larger fraction sizes are more prone to the protective effects of hypoxia. Administration of hypoxic cell sensitizers might enhance such treatments.
16.7 MODELING THE EFFECTS OF FRACTIONATION
16.7.1 Time and Dose Relationships
Repair and repopulation increase the total dose required to achieve a given level of biological damage (an isoeffect) from a course of fractionated radiation treatment. In contrast, redistribution and reoxygenation would be expected to reduce the total dose required for an isoeffect. It is often difficult to dissect the influence of these factors, but reoxygenation applies mostly to tumors (because they contain hypoxic cells), whereas repopulation and redistribution apply both to tumors and proliferating normal tissues. Repair is an important factor in the response of virtually all tissues. Experimental studies from 50 years ago, examining acute reactions in pig skin, established that fraction number (reflecting repair of sublethal damage between fractions) was a more important factor than overall treatment time (reflecting repopulation) in determining isoeffect in fractionation schedules extending out to 4 weeks (Fowler and Stern, 1963). Further studies established that fraction size (which is linked to fraction number in therapy regimes) is the critical parameter regarding normal tissue response, as illustrated for cell killing in Figure 16–20. For early normal tissue reactions (and tumors) the contribution of repopulation increases as the fractionated treatment is extended to longer times, as illustrated in Figures 16–21 and 16–22. Repopulation makes a lesser contribution for late normal tissue reactions but repair plays the major role, as illustrated in Figure 16–21 and discussed in Section 16.6.2. Redistribution reduces the effect of repopulation, but is probably a minor factor affecting tissue response to fractionated treatment, as discussed in Section 16.6.3.
That the biological effect of radiation depends on the fractionation schedule has important clinical implications for the planning of therapy. To obtain the maximum dose to a tumor while minimizing dose to surrounding normal tissue, modern radiotherapy will often use a number of overlapping radiation beams. The dose at any given location will be calculated by summing the doses given by the various individual beams, and the dose distribution will be represented by a series of isodose curves (like contours on a map) joining points that are expected to receive equal percentages of the dose at a particular point. As noted in Section 16.6.1, equal-size dose fractions allow for maximum repair; thus, if different beams are delivered over times sufficient for significant repair to occur (0.5 to 5.0 hours depending on the tissue) the tissues that receive unequal contributions from different beams (usually normal tissue surrounding the tumor) would have less-optimal repair than those where the contributions from the different beams are equal (usually the tumor). Thus the biological effect could be different at different points on the same isodose line; that is, isodose does not necessarily imply isoeffect.
16.7.2 Isoeffect Curves
Different fractionation schedules that give the same level of biological effect can be presented in the form of an isoeffect curve. Isoeffect curves are generated by plotting the total radiation dose to give a certain biological effect against the overall treatment time, fraction number, or fraction size, as illustrated in Figure 16–24. Experimental studies, performed mainly in rodents, have established isoeffect curves for different normal tissues using end points of either early or late radiation damage. Some of these isoeffect curves are shown in Figure 16–25, with the dashed blue lines representing early tissue responses and the red solid lines late responses. The isoeffect lines for late responses are steeper than those for early responses, meaning that a larger increase in total dose is required to give the same level of late toxicity as the dose per fraction is reduced and the number of fractions increased. This implies a greater capacity for the repair of damage in tissues where it is expressed late than for damage in tissues where it is expressed early after radiation treatment. Possible reasons for this difference include a greater contribution of potentially lethal damage repair because of limited proliferation early after treatment in late responding tissues (see Chap. 15, Sec. 15.4.2) but exact reasons remain unclear and may differ for different tissues. Nevertheless, the observation that late-responding normal tissues demonstrate greater repair capacity than early responding normal tissues is a fundamental radiobiological principle underlying altered fractionation schedules using multiple daily fractions in clinical radiotherapy. This is discussed in more detail in Section 16.7.4.
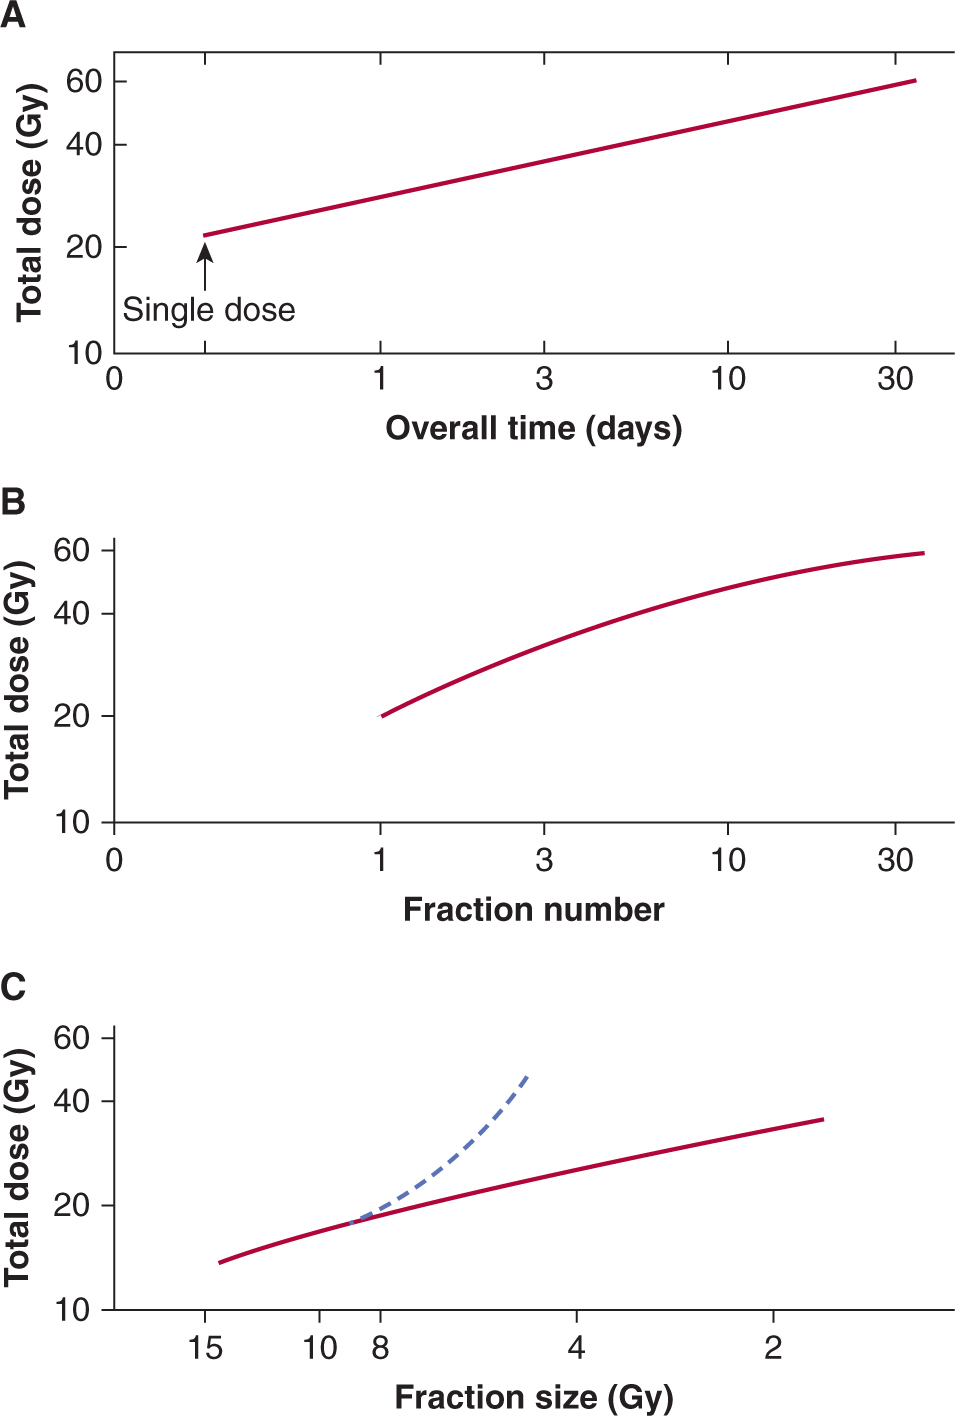
FIGURE 16–24 Isoeffect curves for fractionated treatments plotted in three different formats. A) Line plotted by Strandqvist, (1944) to define normal tissue tolerance and control of carcinoma of the skin and lip using the axes of total dose and overall treatment time. B) Isoeffect curve for damage to pig skin plotted as total dose versus number of fractions. (Adapted from Fowler, 1971.) C) Isoeffect curve for the crypt cells of the mouse intestine plotted as total dose versus fraction size using an inverted scale. The solid (red) line is for fractions given 3 hours apart and the dashed (blue) line for fractions given 24 hours apart. All three curves illustrate that the total (isoeffective) dose increases with fractionated treatment. (Adapted from Withers and Mason, 1974.)
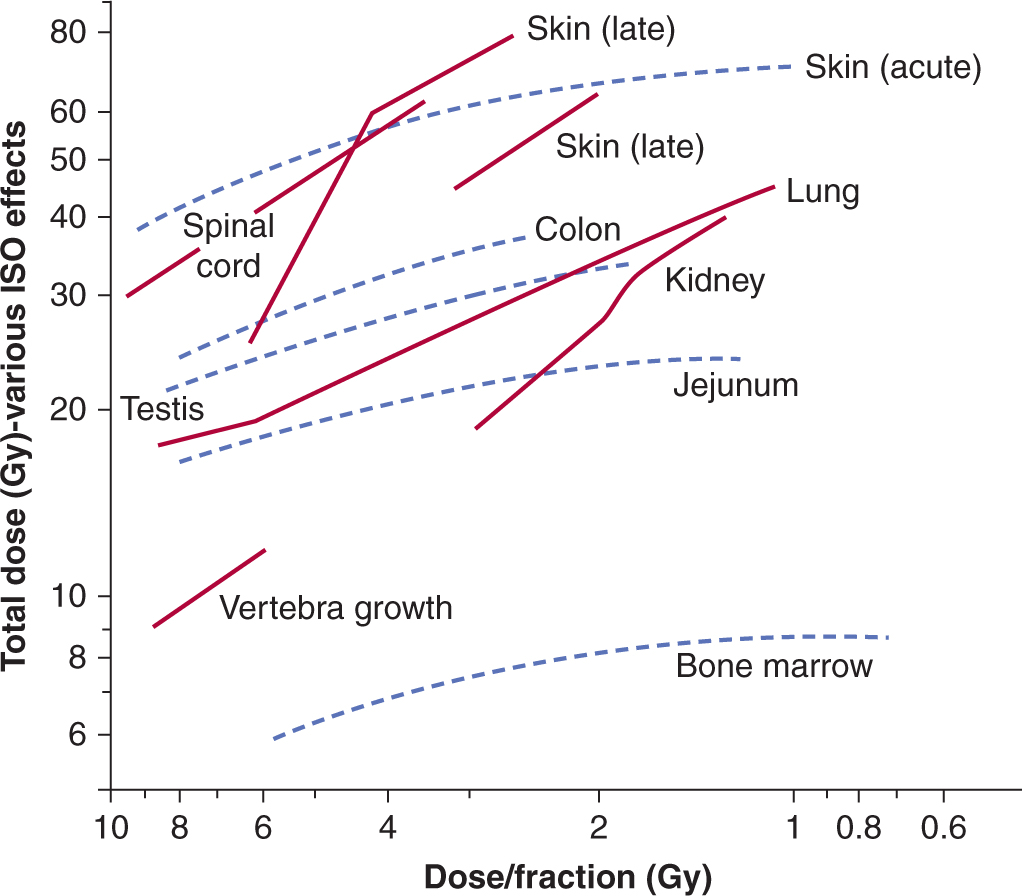
FIGURE 16–25 Isoeffect curves for a number of rodent tissues obtained using a variety of different cell survival or functional assays. The total dose required to obtain a fixed level of tissue damage is plotted as a function of the dose/fraction. The displacement of the curves on the vertical axis is a result of the fact that different isoeffective end points were used for the different tissues. (Modified from Thames et al, 1982.)
16.7.3 The Linear Quadratic Equation and Models for Isoeffect
Modeling isoeffect relationships (particularly for normal tissues) can allow appropriate choice of dose and schedule when changing fractionation schedules. Several models have been proposed, but most modeling is currently based on the linearquadratic (LQ) equation (see Chap. 15, Appendix 15.1). In using the LQ model, it is assumed that each fraction has an equal effect, thus for a fractionated regime (n fractions of size d):
![]()
where SF = surviving fraction. This reduces to:
![]()
It is further assumed that if different fractionation regimes (eg, n1 fractions of size d1 and n2 fractions of size d2) are isoeffective for a given tissue, they lead to the same SF. Thus we have:
![]()
Equation (16.5) can then be simplified to give:
![]()
From this relationship and knowing the values of n1, d1, n2, and d2, the constant α/β can be determined for a particular tissue and used in the equation to predict other isoeffective treatment schedules.
Data similar to those shown in Figure 16–25 have been used to estimate α/β values for different normal tissues in rodents. In general, late-responding normal tissues have α/β values in the range of 2 to 5 Gy, while early responding normal tissues have α/β values in the range of 8 to 12 Gy. Tumors generally have values similar to or greater than early responding normal tissues. The available data for human tissues suggest values in the same ranges but confidence limits are large and the available data suggest that grouping the responses of different tissues as described above is an oversimplification. Similarly there are exceptions to the general rule that all tumors have α/β values similar to or greater than those for early responding tissues as some (slowly growing) tumors, for example, prostate cancer, may have low α/β values between 1 and 3 Gy, suggesting a large repair capacity (see Bentzen and Joiner, 2009).
Critical to the original derivation of the LQ model was the underlying assumption that the primary factor underlying normal tissue responses to irradiation was killing of the relevant parenchymal cell population. As discussed in Section 16.5, normal tissue response to irradiation is now recognized as multifactorial, and this assumption is unlikely to be correct. Nevertheless, the model has proven to be valuable in the clinic provided that it is not extrapolated to predict the effects of fractionation schedules that are very different from clinical experience (eg, fraction sizes outside the range of 1 to 5 Gy). In the original model, there was no consideration of the effect of treatment time: This is a limitation that applies primarily to early normal tissue (and tumor) responses, where repopulation plays a substantial role. In the original LQ model, it was also assumed that there is complete repair between the fractions, which is incorrect when the interfraction interval is too short or where repair of sublethal damage is slow, as occurs in some late-responding tissues, such as neural tissues. Modifications to the model allow corrections to be made for these factors, but there remains uncertainty in their ability to predict outcome when dose and schedule are modified. More detailed discussion can be found in the books listed in the bibliography.
16.7.4 Altered Fractionation Schedules
The possibility of obtaining a therapeutic gain by exploiting the higher capacity for repair of radiation damage in late-responding normal tissues, as compared with early responding normal tissues and many tumors, has been investigated by reducing the fraction size below that used conventionally (from approximately 2 Gy to 1 to 1.5 Gy) and increasing the number of fractions. The increase in dose that can be tolerated at the isoeffective level of late normal tissue damage should be greater than that required to maintain the same level of tumor control, meaning that the tumor would receive a larger biologically effective dose and hence the control rate should be higher. The larger number of fractions required must be given more than once per day (or over weekends) if the treatment time is not to be prolonged. Such a treatment protocol is termed hyperfractionation. Clinical trials for patients with head and neck cancers evaluating a larger total dose delivered by hyperfractionation (2 fractions per day with 4- to 6-hour intervals) have reported an increase in local control with no difference in late normal tissue damage (see Horiot et al, 1992), although others (Fu et al, 2000) reported increased late effects as well as improved tumor control in their study.
The intent of hyperfractionation is to reduce late effects while achieving the same or better tumor control and the same or slightly increased early effects. The time interval between the fractions must be sufficiently long to allow for complete repair to occur. Repair kinetics have been estimated in normal rodent tissues, and half-times for repair ranged from 0.5 hours in jejunum to 1 to 2 hours in skin, lung, and kidney, so that repair will be complete in most normal tissues after an interfraction interval of 6 to 8 hours. However, for some late-responding tissues in humans, including nervous tissue, estimated repair half-times are in the range of 3 to 5 hours, so repair may not be complete even with an interfraction interval of 8 hours (Bentzen et al, 1999; Lee et al, 1999). Thus, an increase in late morbidity would be expected when multiple fractions per day are given to fields that include the spinal cord, as was observed in the CHART (Continuous Hyperfractionated Accelerated Radiotherapy) trials in which patients were given 3 fractions per day (Dische and Saunders, 1989). An increase in early normal tissue reactions would be expected with hyperfractionation because the larger α/β; value for early responding tissues implies a smaller change in the amount of repair as fraction size is reduced relative to that occurring in late-responding tissues (that have smaller α/β; values). Severe mucositis was observed in the CHART trial (see Fig. 16–16), but it is likely that this was a result of the very short total treatment time limiting the possibility for repopulation to occur in the mucosa.
Shortening of the overall treatment time has also been investigated as an approach to improving the therapeutic ratio because it reduces the time for repopulation to occur in the tumor during treatment (see Sec. 16.6.2). A similar effect might be achieved by blocking growth factors or their receptors, which are required for tumor cell proliferation (see Sec. 16.2.5). The tolerance of late-responding normal tissues should be little affected because cell proliferation is slow within them. Reduced treatment time is achieved by giving more than 1 fraction per day with standard dose fractions of 1.8 to 2.5 Gy, usually given 6 to 8 hours apart to allow for repair (although these time intervals may be insufficient to allow full repair in some late-responding tissues, as discussed above). This strategy is called accelerated fractionation. Randomized trials of accelerated compared to conventional fractionation for treatment of head and neck cancer have provided evidence supporting the importance of repopulation as a cause of treatment failure. A CHART study gave a reduced total dose in the experimental arm of the study, but maintained the same tumor control level, with a slight reduction in late morbidity (Dische et al, 1997). A second study, which gave a similar total dose in both arms, reported increased tumor control in the accelerated fractionation arm, but there was also increased late toxicity (Horiot et al, 1997). This increased toxicity was likely a result of the short (4-hour) interfraction interval, which was probably not sufficient to allow for complete repair between the fractions. Table 16–5 outlines factors relating to altered fractionation schedules. A metaanalysis of studies of altered fractionation regimes in head and neck squamous cell cancers concluded that hyperfractionation had a greater benefit than accelerated fractionation (Bourhis et al, 2006).
TABLE 16–5 Summary of normal tissue responses to altered schedules of fractionated radiation.

Accelerated radiotherapy, carbogen, and nicotinamide (ARCON) protocols involve accelerated radiotherapy combined with carbogen (95% oxygen plus 5% carbon dioxide) breathing and nicotinamide and are designed to limit repopulation and decrease the influence of hypoxia, because reoxygenation may be less during short treatment schedules. Phase I and II clinical trials showed the feasibility of ARCON therapy and produced promising results in terms of tumor control in cancers of the head and neck and bladder. A Phase III trial in larynx cancer has been completed and an initial report indicates that the early toxicities associated with the treatment are not significantly enhanced, whereas local tumor outcome is improved (Janssens et al, 2012).
A more extreme form of accelerated therapy involves stereotactic radiosurgery (SBRT) to treat some tumors, including those in the brain, in which large single doses or a few large fractions are given (3 to 5 fractions of 8 to 20 Gy each). This technique has been applied for localized treatments of small primary lesions and isolated metastases, particularly in the lung. Such treatments are expected to cause complete loss of normal tissue function in the high-dose region of the beam, and tolerability of such treatments depends on the small volume irradiated, its location, and the reserve capacity of the normal tissues involved (see Sec. 16.5.3). Results and appropriate applications of this accelerated form of radiation treatment have been reviewed (Kavanagh et al, 2011).
16.8 RADIATION-INDUCED SECOND MALIGNANCIES
As cancer patients treated with radiotherapy can be cured or may have prolonged survival after treatment, an effect of increasing concern is the induction of second malignancies. Most information about radiation-induced cancers has come from the long-term life span study (LSS), set up in 1950, that is tracking cancer incidence and mortality in a cohort of more than 85,000 Japanese atomic (A)-bomb survivors who were exposed in 1945. Cancer survivors, nuclear workers, uranium miners, and people exposed during radiation accidents, such as that at Chernobyl, have been, and are being, followed to provide better assessments of risk.
The most recent analysis of results from the LSS of the A-bomb survivors is Report 14, which covers the period from 1950 to 2003 (Ozasa et al, 2012). Subjects of this study were estimated to have received doses of less than 4 Gy, with most receiving doses of less than 0.2 Gy. This report indicates that the incidence of most types of solid cancers is elevated with a linear dose–response relationship up to a dose of approximately 3 Gy (Fig. 16–26). Radiation risk is defined as the increase in the number of cancer deaths over that expected for an unirradiated population. Excess absolute risk (EAR) is expressed as the increased number of cancers per 104 person-years after exposure to 1 Sievert (1 Sv is equivalent to 1 Gy of X- or γ-radiation). Excess relative risk (ERR) is the increase in cancers above that expected in an unirradiated population expressed as a fraction of the level in the unirradiated population. There was elevated risk for all doses of radiation in the A-bomb survivors with no evidence for a threshold. The effects are dependent on sex, age at exposure, and attained age (Fig. 16–27), with females and those exposed at younger ages showing higher ERR. The EAR increases throughout life and was 0.42 for all solid cancer at age 70 years, after exposure at age 30 years based on a linear model. There was also an increased risk of other diseases, including those of the circulatory, respiratory, and digestive systems. An analysis of mortality as a consequence of leukemia in the A-bomb survivors over the period 1950 to 2000 demonstrated a curvilinear (LQ) dose–response relationship with an estimated ERR at 1 Sv of 4.7 (Richardson et al, 2009). Again, the risk was age- and dose-dependent and much higher for those exposed at younger than 10 years of age. The predominant type of leukemia was acute myeloid leukemia (AML) and the relative risk rose rapidly in the first 5 to 10 years after exposure and then declined, so that after 25 years the excess risk was small. General observations from the LSS are that radiation tends to increase the incidence of tumors, which arise naturally in the population and the increased incidence is seen primarily at ages when spontaneously arising tumors of the same type would occur.
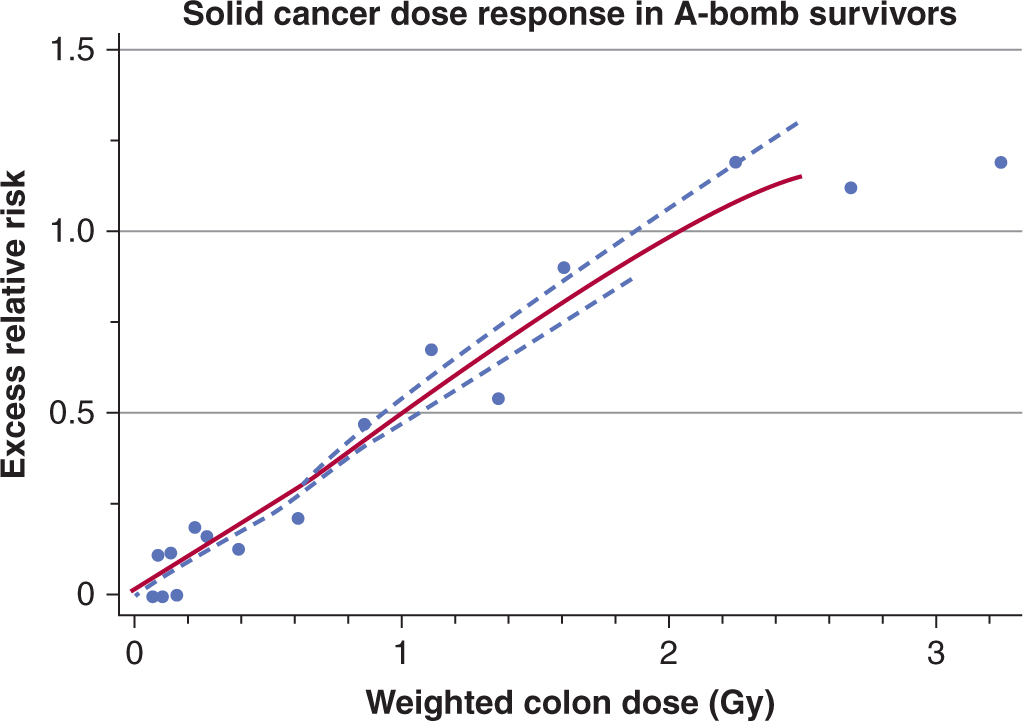
FIGURE 16–26 Incidence of solid cancer as a function of dose from the A-Bomb survivor incidence data. The solid (red) line is the estimated gender-averaged excess relative risk (ERR) at age 70 years after exposure at age 30 years. The blue dashed lines are 1 standard error above or below the line. (Redrawn from Preston et al, 2007.)
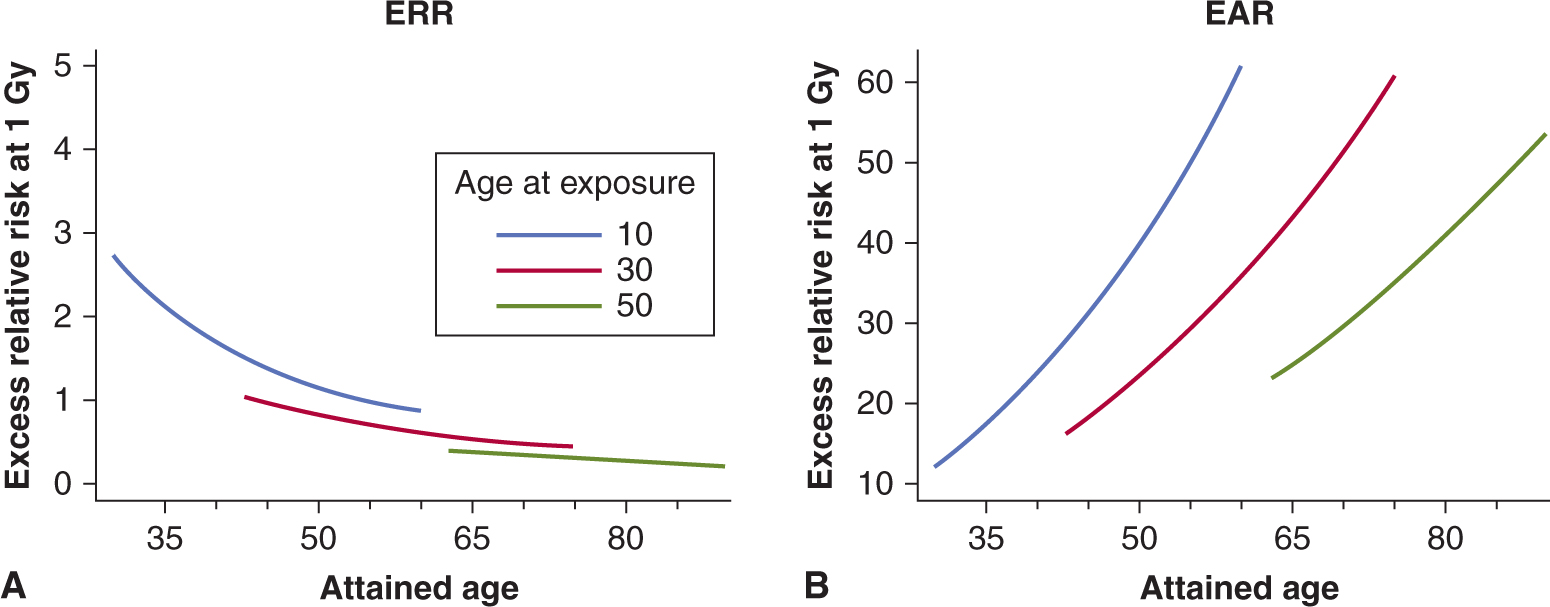
FIGURE 16–27 Effects of age at exposure on the excess risks of solid cancers. Panel (A) shows the excess relative risk (ERR) gender-average for exposure to 1 Gy and panel (B) shows the excess absolute risk (EAR) for the same groups. (Redrawn from Preston et al, 2007.)
The risk of second malignancies in cancer survivors has been reviewed by a number of groups over the last few years. A metaanalysis of 26 studies of childhood cancer survivors demonstrated induction of different types of cancer and estimated an overall ERR of second malignancy of 0.6 (Doi et al, 2011). A report from the Childhood Cancer Survivor Study (CCSS) reported a cumulative incidence at 30 years after diagnosis of childhood cancer of 20.5%, with the most frequent being nonmelanoma skin cancers and breast cancer. A specific analysis of thyroid cancer from this study demonstrated that the relative risk increased up to (fractionated) doses of 20 to 25 Gy and then declined at higher doses (Fig. 16–28).
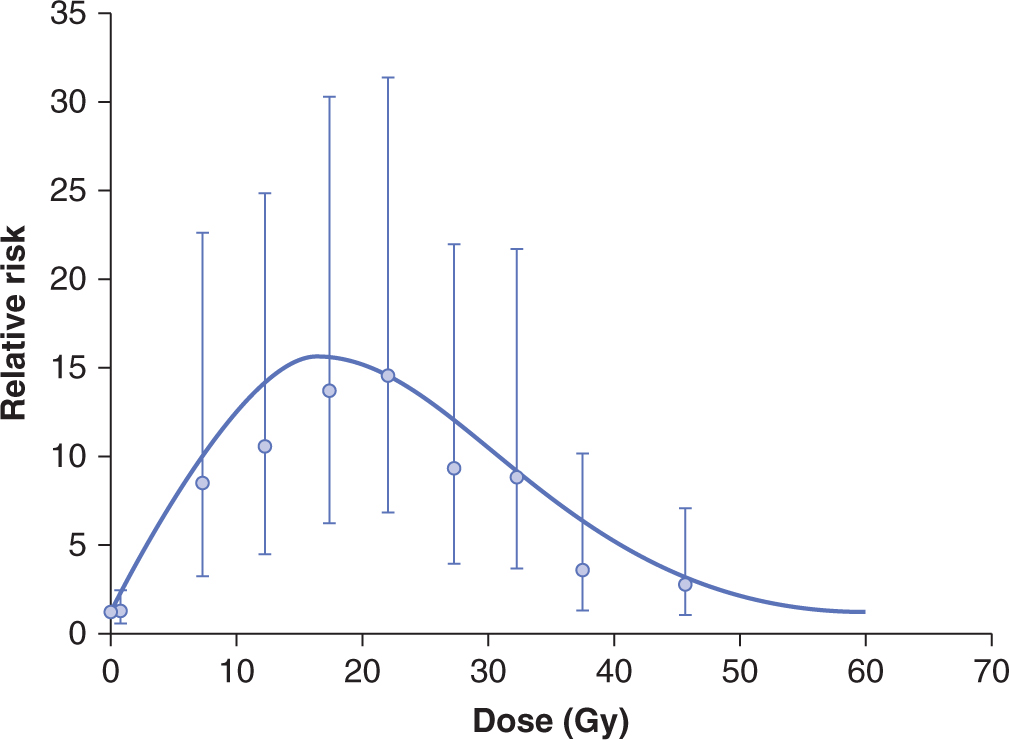
FIGURE 16–28 Observed relative risk of developing secondary thyroid cancer in childhood cancer survivors as a function of mean radiation dose to the thyroid during radiotherapy for the initial cancer. Line is based on a model adjusted for attained age, sex, and type of first cancer. The points represent the dose categories and are shown with 95% confidence intervals. (Modified from Bhatti et al, 2010.)
A detailed report on cancer survivors of all ages by the National Council on Radiation Protection and Measurements (NCRP) showed an elevated risk of breast and lung cancers in particular for patients treated for Hodgkin lymphoma (Travis et al, 2012). The increased risk for breast cancer extends to at least 30 years after treatment, with incidence rising to 20% to 30% of patients given radiotherapy. There is dependence on dose to the breast and age at treatment with greater risk for women who received radiation at young ages; incidence is lower in patients who received only chemotherapy. Some of the increased incidence of second cancers may be a result of underlying genetic predisposition, as may occur with BRCA1 2 carriers, but this does not account for the majority of such second malignancies. A population of patients that may be at increased risk are patients treated with the newer IMRT techniques rather than 3D conformal therapy. Their risk was estimated to be almost 2-fold higher, because IMRT requires many more fields from different angles than conformal therapy and a larger volume of normal tissue is exposed to radiation (Hall, 2006). However, it will require 1 to 2 decades of careful follow-up to see if this is the case and assays to determine genetic predisposition to undergo radiation-induced carcinogenesis would be required to assess individual patient risk (Hussein et al, 2012).
The first 20 years of studies of carcinogenesis in people exposed to fallout after the Chernobyl accident in 1986 show a large increase in the incidence of thyroid cancers in young people (Williams, 2008), most of whom have been treated successfully. There was early incidence (within 4 years) in those exposed at a very young age and longer latency for those exposed at older ages. These tumors are associated with exposure to radioactive iodine, much of it probably ingested from contaminated milk. Iodine is concentrated in the thyroid, giving much higher exposures to the gland (~1000-fold the average whole-body dose). The developing thyroid gland is more sensitive than the mature gland in older children and adults, probably because of a higher level of proliferation. Most of these tumors are associated with rearrangements in chromosome 10 involving the RET oncogene, which differ for early (RET-PTC–3 involving the ELE-1 gene) and later (RET-PTC1 involving the H4 gene) incidence tumors; mutations of the BRAF gene (see Chap. 7, Sec. 7.5.5) have also been observed. No increases in other malignancies have yet been associated unequivocally with radiation exposure as a consequence of the Chernobyl fallout, although there is some indication of increases in breast cancer incidence in young women. Experience from the LSS study indicates that longer follow-up will be necessary to assess how radiation-induced cancer incidence varies with the different types of exposures involved (acute single external exposures for the A-bomb survivors vs. prolonged exposures to ingested radioisotopes for the Chernobyl survivors).
Experimental models to evaluate carcinogenic effects of ionizing radiation are based on concepts similar to those for the study of chemical carcinogens, particularly the multistep carcinogenesis model (see Chap. 4, Sec. 4.2.1). Radiation is both an initiator and promoter of carcinogenesis. Single doses of X- or γ-rays in the range of 0.25 to 8 Gy given to the whole body increase the frequency of tumors in irradiated animals. Different tissues have different sensitivities for tumor induction, and genetic characteristics, age, environment, dietary factors, and modifying agents all affect the incidence of radiation-induced cancers in animals (Kennedy, 2009). The relationship between tumor induction and radiation dose given to the whole body appears to be sigmoid (Fig. 16–29): At low doses there is little induction, but as the dose increases there is a steep increase in the number of tumors followed by saturation or a decrease at high doses likely caused by cell killing (red line). High LET radiations are more effective (green line) and fractionation of low LET exposure is less effective in inducing cancer (blue line).
FIGURE 16–29 Schematic of induction of a specific tumor type in mice exposed to various doses of ionizing radiation given to the whole body based on a review of a number of different in vivo results. Red curve: Tumors induced by single acute doses of low-LET radiation. Green curve: Tumors induced by single acute doses of high-LET radiation. Blue curve: Tumors induced by fractionated doses (eg, 1 Gy/day) of low-LET radiation.
The initial effect of radiation is assumed to be induction of genetic instability associated with DNA damage, which can result in genetic changes in the descendants of irradiated cells including (a) mutations in genes involved in control of DNA synthesis or DNA repair; (b) the induction of chromosome instability; (c) persisting aberrant production of oxygen radicals that can damage DNA; (d) prolonged inflammatory processes in tissues; (e) epigenetic effects (Aypar et al, 2011; Mukherjee et al, 2012). These “initiator” effects would allow for a higher probability of developing further “rare” mutations, leading to malignant transformation by the activation of (proto)oncogenes or inactivation of tumor-suppressor genes. The observations that radiation tends to increase the incidence of tumors that arise naturally, and that the increased incidence is seen primarily at ages when spontaneously arising tumors of the same type would occur, are consistent with radiation acting to induce an increased likelihood of the occurrence of processes that naturally lead to cancer development, such as activation of oncogenes or inactivation of suppressor genes. However, in irradiated cultured cell populations, genetic instability has been detected over many generations and can apparently arise de novo, supporting the idea of late secondary effects (and possibly bystander effects; see Chap. 15, Sec. 15.2.4). Furthermore, so-called clastogenic factors, molecules that can induce chromosome damage in unirradiated cells (and may reflect aberrant production of oxygen radicals and underlying chronic inflammatory processes), have been detected in the blood of radiotherapy patients, Japanese A-bomb survivors, and the Chernobyl liquidators. This suggests a prolonged effect of irradiation that is also consistent with a classic promoter role.
Stay updated, free articles. Join our Telegram channel

Full access? Get Clinical Tree


