Prediction tool, URL
Risk factors
Outputs
Risk factors amenable to intervention
Risk factors responsive to anti-osteoporosis treatment
FRAX (Fracture Risk Assessment Tool) [26]
• Age, sex, BMI
• Prior fragility fracture, glucocorticoid use >3 months, secondary osteoporosis, rheumatoid arthritis, parental hip fracture, current cigarette smoking, alcohol intake of >3 units/day (yes/no)
• Femoral neck BMD or T-score (optional)
• 10-year major osteoporotic fracture (clinical vertebrae, hip, forearm, proximal humerus)
• 10-year hip fracture
• BMI
• Glucocorticoid use
• Smoking
• Alcohol intake
• Femoral neck BMD
• Femoral neck BMD
• Age, sex
• Fractures after age 50 (none, 0, 1, 2, >3)
• History of falls in the previous 12 months (none, 0, 1, 2, >3)
• Femoral neck BMD (or T-score) or weight
• 5 or 10 years of any osteoporotic fracture (hip, clinical vertebrae,
wrist, metacarpal, humerus, scapula, clavicle, distal femur,
proximal tibia, patella, pelvis, and sternum)
• 5- or 10-year hip fracture
• Falls in the previous 12 months
• Weight
• Femoral neck BMD
• Femoral neck BMD
• Age, sex, 10 ethnic origins
• Height, weight
• Smoking (4 levels), alcohol intake (5 levels), diabetes (type 1, type 2), previous fracture, parental osteoporosis or hip fracture, living in a nursing or care home, history of falls, dementia, cancer, asthma/COPD, cardiovascular disease, chronic liver disease, chronic kidney disease, Parkinson’s disease, rheumatoid arthritis/SLE, malabsorption, endocrine problems, epilepsy or anticonvulsant use, antidepressant use, steroid use, HRT use
• 1- to 10-year osteoporotic fracture (clinical spine, hip, distal forearm; humerus fracture was included with the 2012 version)
• 1- to 10-year hip fracture
• Weight
• Smoking
• Alcohol intake
• Anticonvulsant use
• Antidepressant use
• Steroid use
• HRT use
• None
FRAX (www.shef.ac.uk/FRAX)
FRAX was developed by the WHO Collaborating Centre for Metabolic Bone Diseases to estimate an individual’s 10-year probability of major osteoporotic fracture (composite of the clinical spine, hip, forearm, and proximal humerus) and hip fracture [25]. The input variables were selected following a series of meta-analyses using data from nine prospective international population-based cohorts [26]. In addition to age, sex, and body mass index (BMI), additional clinical risk factors (CRFs) for fractures include prior fragility fracture, a parental history of hip fracture, prolonged use of glucocorticoids, rheumatoid arthritis, current cigarette smoking, alcohol intake of 3 or more units/day, and secondary osteoporosis (Fig. 4.1). Femoral neck BMD is an optional input that can refine the risk estimate, though even in its absence FRAX performs very well [27, 28]. Interactions among CRFs are also incorporated into the FRAX algorithm.
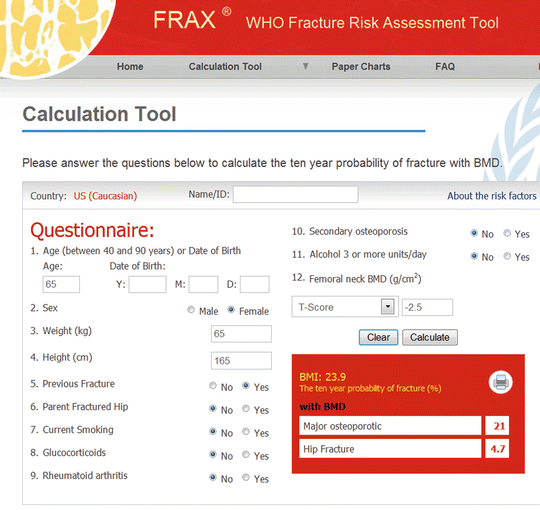

Fig. 4.1
Sample screenshot for FRAX® (US Caucasian tool). 10-year probability for major osteoporotic fracture is 21 % and for hip fracture is 4.7 % in a woman age 65 years, weight 65 kg, height 165 cm, previous fracture and femoral neck T-score −2.5. (Note that more than one fracture, type 2 diabetes, or fall in the prior year do not affect the calculation)
In survival analysis, the time at which a subject experiences an event of interest may be altered by another event, known as competing risk events [29]. For fracture, competing death is particularly important to consider in order to produce unbiased estimates of fracture risk since, following death, fracture is no longer possible. FRAX adjusts for competing mortality, and the competing mortality approach used by FRAX is unique among the risk prediction models. Individuals may have equivalent hazards for fracture, but if they differ in terms of hazard for death, then this will affect the 10-year fracture probability. For example, smoking is a risk factor for fracture but also increases the risk for death. Thus, the increased mortality associated with smoking reduces the importance of smoking as a risk factor for fracture. The 10-year major fracture probability tends to increase with age to peak around 80–85 years and then declines as the death hazard rises faster than the fracture hazard. Failure to account for competing mortality has been shown to overestimate major fracture probability by 15–56 % and hip fracture probability by 17–36 % in those with high mortality: men, age >80 years, high fracture probability, and diagnosed diabetes [30].
In recognition of the large international variability in fracture and mortality rates [31], population-specific FRAX tools are customized to the fracture and mortality epidemiology in a specific region [25]. The initial release of FRAX in 2008 covered nine countries (including four ethnic calculators for the USA), while the most recent version (3.8) includes over 50 countries. Minimum data requirements for constructing a new FRAX tool are sex- and age-specific mortality and hip fracture rates (5-year subgroups). In many countries, such data are relatively easy to obtain. In contrast, non-hip fracture data considered by FRAX (the clinical spine, distal forearm, proximal humerus) are difficult to accurately collect at the population level. Where high-quality data are not available, country-specific FRAX tools can be calibrated under the assumption that the ratio of these non-hip to hip fracture rates is similar to that observed in historical Swedish data (1987–1996) [32, 33]. Whether these ratios are universally applicable in all populations has been questioned. Population-based data from Canada suggest that these ratios may underestimate the rate of major osteoporotic fractures, possibly due to recent declines in hip fracture rates [34]. Although Swedish vertebral to hip fracture ratios were similar to Canadian ratios, those for other skeletal fracture sites were significantly lower (in men and women, respectively: 46 % and 35 % lower for forearm/hip ratios, 19 % and 15 % lower for humerus/hip ratios, and 19 % and 23 % lower for any MOF/hip ratio).
Fracture discrimination with FRAX was initially assessed in 9 primary derivation cohorts (46,340 subjects with 189,852 person-years follow-up) and then in 11 additional validation cohorts (230,486 persons with 1,208,528 person-years of follow-up) [35]. Risk stratification with FRAX including BMD was superior to FRAX without BMD or to BMD alone. In the primary derivation cohorts, the gradient of risk for hip fracture increased from 1.84 to 2.91 (area under the curve [AUC] from 0.67 to 0.78) with the inclusion of BMD and for major osteoporotic fractures increased from 1.55 to 1.61 (AUC from 0.62 to 0.63) with the inclusion of BMD. In the validation cohorts, the averaged hip fracture gradient of risk (1.83 without BMD and 2.52 with BMD) and AUC (0.66 without BMD and 0.74 with BMD) was similar to that of the derivation cohorts, but the gradient of risk for other osteoporotic fractures (1.53 without BMD, 1.57 with BMD) and AUC (0.60 without BMD and 0.62 with BMD) was slightly lower.
A potential explanation for the lower AUC measurements for major osteoporotic versus hip fractures was described in a recent publication from the Global Longitudinal Study of Osteoporosis in Postmenopausal Women (GLOW) [36]. Varying associations with age were seen for 10 different bone fracture sites in 53,896 women age 55 years and older, with clinical fractures of the hip, pelvis, upper leg, clavicle, and spine (designed the F5 sites) each exhibiting a strong association with advanced age. In contrast, five other fracture sites, which include the upper arm/shoulder and wrist, had much weaker associations with age. As a result, an age-related fracture prediction model for the F5 sites performed better than FRAX for all major osteoporotic fractures (Harrell’s c-index 0.75 and 0.67, respectively).
A number of studies have performed independent assessments of FRAX to predict subsequent fracture, but they differ widely in sample size, methodology (particularly incorporation of competing mortality risk), and techniques used to assess the performance of the fracture prediction tool (discrimination versus calibration) [10], which can affect the validity of these validation studies [17]. In 2010, Sornay-Rendu et al. [37] examined 867 French women age 40 years and over from the OFELY (Os des Femmes de Lyon) cohort which included 95 incident major osteoporotic fractures. Predicted probabilities of fracture were considerably greater in women with incident fractures than in women without incident fractures. The observed incidence of major osteoporotic fractures was found to be higher than the predicted FRAX probability, but the analysis did not account for the effect of competing mortality. Fracture discrimination for major osteoporotic fractures was good (AUC 0.75 [95 % CI 0.71–0.79] without BMD, 0.78 [95 % CI 0.72–0.82] with BMD). Trémollieres et al. [38] examined a separate group of 2651 French women from the MENOS (Menopause et Os) cohort who sustained 145 major osteoporotic fractures (13 hip fractures) during the follow-up period. Once again, fracture discrimination was good for major osteoporotic fractures, but the study was underpowered to show an improvement in risk assessment with FRAX (AUC 0.63, 95 % CI 0.56–0.69) over BMD alone (AUC 0.66, 95 % CI 0.60–0.73).
A FRAX tool for Canada was developed from national hip fracture and mortality data [39]. The accuracy of fracture predictions was assessed in two large, independent cohorts: the Canadian Multicentre Osteoporosis Study (CaMos) (one of the population-based FRAX derivation cohorts) and the Manitoba Bone Density Program (a long-term observational clinical cohort not included in FRAX derivation cohorts) [40, 41]. Analyses for the Manitoba BMD cohort (36,730 women and 2873 men) and CaMos cohort (4778 women and 1919 men) were similar and showed that the Canadian FRAX tool generated fracture risk predictions that were consistent with observed fracture rates across a wide range of risk categories in both clinical and average populations. In the Manitoba cohort [40], discrimination for incident hip fracture (AUC 0.83, 95 % CI 0.82–0.85) and major osteoporosis-related fractures (AUC 0.69, 95 % CI 0.68–0.71) was similar to the derivation and validation cohorts studied by the WHO Collaborating Centre [35]. Fracture discrimination using FRAX with BMD was better than FRAX without BMD (hip fracture AUC 0.79, major osteoporosis fracture AUC 0.66) or femoral neck BMD alone (hip fracture AUC 0.80, major osteoporosis fracture AUC 0.68). In CaMos [41], results were similar with the FRAX estimates using BMD and CRFs superior to BMD alone or CRFs alone for both major osteoporotic fractures and hip fractures. For major osteoporotic fractures, FRAX with BMD gave an AUC 0.69 (95 % CI 0.67–0.71) vs. FRAX without BMD 0.66 (95 % CI 0.63–0.68) versus femoral neck T-score alone 0.66 (95 % CI 0.64–69). For hip fractures, FRAX with BMD gave AUC 0.80 (95 % CI 0.77–0.83) vs. FRAX without BMD 0.77 (95 % CI 0.73–0.80). The average 10-year probability for major osteoporotic fractures, with BMD, was not significantly different from the observed value in men [predicted 5.4 % vs. observed 6.4 % (95 % CI 5.2–7.5 %)] and only slightly lower in women [predicted 10.8 % vs. observed 12.0 % (95 % CI 11.0–12.9 %)]. FRAX with BMD was well calibrated for hip fracture assessment in women [predicted 2.7 % vs. observed 2.7 % (95 % CI 2.2–3.2 %)] but underestimated risk in men [predicted 1.3 % vs. observed 2.4 % (95 % CI 1.7–3.1 %)].
The importance of correct calibration was noted when the UK FRAX tool was used to assess fracture risk in a convenience sample of 501 Polish women referred for BMD testing [42]. Self-reported incident fractures 9–12 years later were assessed by telephone interview. The observed/expected ratio for fracture was 1.79 (95 % CI 1.44–2.21) without BMD and 1.94 (95 % CI 1.45–2.54) with BMD suggesting that the UK model significantly underestimated fracture risk in Polish women. However, fractures could only be assessed in long-term survivors, a factor which likely contributed to biased results due to failure to account for competing mortality.
A small Japanese study (43 self-reported major osteoporotic fractures and 4 hip fractures) was reported by Tamaki et al. [43] using the Japanese Population-Based Osteoporosis Study (JPOS) cohort . The numbers of observed major osteoporotic or hip fracture events were found to be consistent with FRAX predictions, with significant stratification in fracture risk (major osteoporotic fracture AUC without BMD 0.67, 95 % CI 0.59–0.75; AUC with BMD 0.69, 95 % CI 0.61–0.76).
Rubin et al. [44] performed a registry linkage study using baseline questionnaire data from 3636 Danish women with FRAX hip fracture probabilities calculated from the Swedish tool. Predicted and observed risk estimates incorporated adjustment for 10-year survival rates. The predicted 10-year hip fracture risk was 7.6 % overall with observed risk also 7.6 %, with similarly good results from age 41–50 years (predicted 0.3 %, observed 0.4 %) to age 81–90 years (predicted 25.0 %, observed 24.0 %).
Premaor et al. [45] examined the question of whether FRAX was applicable to obese older women using 6049 white women from the US Study of Osteoporotic Fractures (SOF) cohort . Fracture discrimination from AUC was similar in obese and nonobese women. Calibration was good in both groups for prediction of major osteoporotic fractures using FRAX with BMD, but hip fracture risk was found to be underestimated, most marked among obese women in the lowest category for FRAX probability with BMD (though only based on a small number of 4 predicted vs. 9 observed hip fractures).
Ettinger et al. [46] examined 5891 men age 65 years and older (374 with incident major osteoporotic fractures, 161 incident hip fractures). Hip fracture discrimination (AUC 0.77 with BMD vs. 0.69 without BMD) was better than for major osteoporotic fractures (AUC 0.67 with BMD vs. 0.63 without BMD). Inclusion of BMD improved the overall net reclassification index for major osteoporotic fractures and hip fractures. Observed to predicted fracture ratios according to probability quintiles showed good calibration for hip fracture prediction without BMD (ratios 0.9–1.1), but hip fracture risk was significantly underestimated in the highest risk quintile when BMD was used in the calculation. Conversely, major osteoporotic fracture risk was underestimated without BMD (predicted ratio 0.7–0.9), and addition of BMD did not significantly affect the results (predicted ratio 0.7–1.1).
Byberg et al. [47] examined 5921 men age 50 years and older from Sweden in the Uppsala Longitudinal Study of Adult Men (ULSAM) in which 585 individuals sustained fracture (189 with hip fractures). FRAX explained 7–17 % of all fractures and 41–60 % of hip fractures. Including comorbidity, medications and behavioral factors improved overall fracture prediction. However, femoral neck BMD was only available in a small subset of those aged 82 years and older.
Gonzalez-Macias et al. [48] examined 5201 women age 65 years and older in a 3-year prospective follow-up study in Spain (201 with major osteoporotic fractures, 50 with incident hip fractures) using data from the Ecografía Osea en Atención Primaria (ECOSAP) study . AUC for FRAX without BMD was 0.62 for major osteoporotic fractures and 0.64 for hip fractures. Estimated to observed fracture ratios of 0.66 and 1.10, respectively, were likely influenced by the limited 3-year study duration of the follow-up, lack of data on clinical vertebral fractures, and lack of adjustment for competing mortality risk. Another Spanish study from Tebe Cordomi et al. [49] conducted a retrospective cohort study of 1231 women aged 40–90 years (222 with at least 1 self-reported fracture after baseline assessment). AUC for major osteoporotic fracture estimated with BMD was 0.61 (95 % CI 0.57–0.65). The number of observed fractures was 3.9 times higher than the expected number. Fractures were self-reported at a follow-up survey at least 10 years after baseline assessment, but there was a large rate of non-response/nonparticipation (855 of 2086). Fractures could only be assessed in long-term survivors, and excluding individuals who died prior to 10 years could bias results.
On balance, these studies confirm the validity of FRAX for fracture risk assessment but highlight the importance of using high-quality fracture data to ensure accurate calibration of the FRAX tool. A set of 28 jointly endorsed positions were developed by the International Society of Clinical Densitometry (ISCD) and International Osteoporosis Foundation (IOF) to facilitate the use of FRAX in clinical practice and provide guidance on its application in specific and challenging circumstances [50, 51]. Specific adjustments can be applied to FRAX-derived risk scores to accommodate discordantly lower or higher lumbar spine BMD (more than 1 SD difference from femoral neck BMD) or glucocorticoid doses that are above or below average (average use defined as daily 2.5–7.5 mg prednisone equivalent) [52, 53].
Garvan Fracture Risk Calculator (www.garvan.org.au/bone-fracture-risk)
The Dubbo Osteoporosis Epidemiology Study (DOES) was initiated in 1989 and involves follow-up of over 3500 participants. Using information on 426 clinical fractures in women (96 hip) and 149 clinical fractures in men (31 hip) excluding digits, 5- and 10-year fracture probability nomograms were constructed [54, 55]. Inputs include age, sex, femoral neck BMD (optional), history of prior fractures after age 50 years (none, 0, 1, 2, 3 or more), and history of falls in the previous 12 months (none, 0, 1, 2, 3 or more) (Fig. 4.2). If femoral neck BMD is not available, then weight is used as a surrogate. Risk factors that are relatively uncommon in the general population (e.g., glucocorticoid use and specific medical conditions) are not included. The model has only been calibrated for the Australian population and does not include an explicit competing mortality risk adjustment.
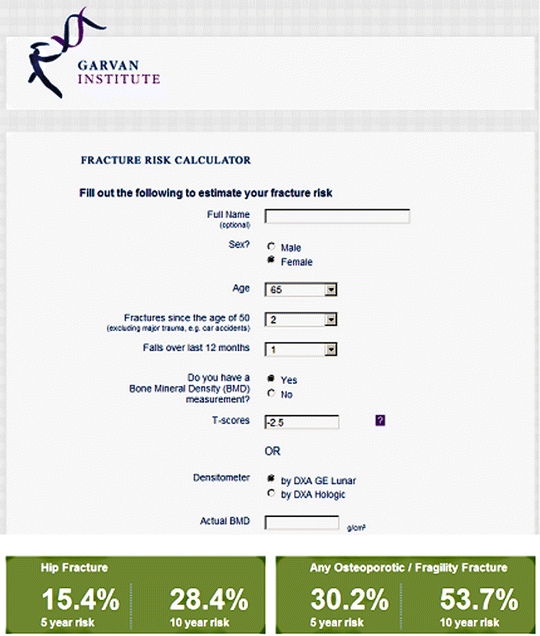

Fig. 4.2
Sample screenshot for Garvan fracture risk calculator. 10-year probability for major osteoporotic fracture is 53.7 % and for hip fracture is 28.4 % in a woman age 65 years, two previous fractures, one previous fall, and femoral neck T-score −2.5. (Note that weight 65 kg, height 165 cm, and type 2 diabetes do not affect the calculation)
The Garvan algorithm has been independently evaluated in the Canadian population (4152 women and 1606 men age 55–95 years at baseline) with 8.6 years of follow-up (699 low-trauma fractures including 97 hip fractures) [56]. Fracture discrimination and calibration were found to be generally good in both women and men. For low-trauma fractures, the concordance between predicted risk and fracture events (Harrell’s C which is similar to AUC) was 0.69 among women and 0.70 among men. For hip fractures, the concordance was 0.80 among women and 0.85 among men. Observed 10-year low-trauma fracture risk agreed with the predicted risk for all risk subgroups except in the highest risk quintile in men and women where observed risk was lower than predicted. Observed 10-year hip fracture risk agreed with the predicted risk for all risk subgroups except in the highest quintile of risk for women (observed risk lower than predicted).
QFracture (www.qfracture.org)
The largest prospective database for osteoporotic fracture prediction is from England and Wales using patients from 357 general practices for derivation and patients from 178 practices for validation in the initial analysis (QResearch Database) [57]. This provided more than one million women and more than one million men age 30–85 years in the derivation cohort with 24,350 incident osteoporotic fractures in women (9302 hip fractures) and 7934 osteoporotic fractures in men (5424 hip fractures). The risk calculator includes numerous CRFs, but not BMD (Fig. 4.3). It provides outputs of any osteoporotic fracture (hip, wrist, or spine) and hip fracture over a user-selected follow-up period from 1 year to 10 years. The QFracture algorithm was updated in 2012, with inclusion of a number of new CRFs, removal of several others, and the addition of humerus fractures as one of the osteoporotic fractures [58]. In addition to age, sex, and ethnicity (10 different ethnic origins), the algorithm includes smoking status (4 levels), alcohol consumption (5 levels), diabetes (type 1 and type 2), previous fracture, parental osteoporosis or hip fracture, living in a nursing or care home, history of falls, dementia, cancer, asthma/COPD, cardiovascular disease, chronic liver disease, chronic kidney disease, Parkinson’s disease, rheumatoid arthritis/SLE, malabsorption, endocrine problems, epilepsy or anticonvulsant use, antidepressant use, steroid use, HRT use, height, and weight.
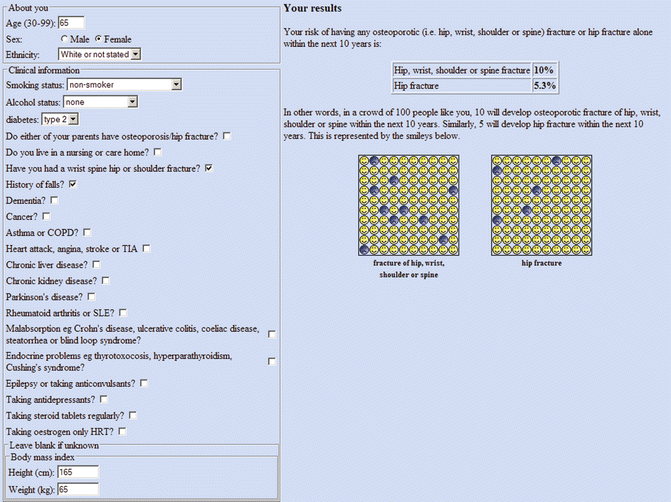

Fig. 4.3
Sample screenshot for QFracture®-2013 risk calculator. 10-year probability for major osteoporotic fracture is 10 % and for hip fracture is 5.3 % in a White woman age 65 years, weight 65 kg, height 165 cm, type 2 diabetes, previous fracture, and history of falls. (Note that more than one fracture and femoral neck T-score do not affect the calculation)
The 2012 version reported very good performance for osteoporotic fracture prediction (AUC 0.79 in women and 0.71 in men) and excellent performance for hip fracture prediction (AUC 0.89 in women and 0.88 in men). An independent validation study was performed using patients from 364 general practices in The Health Improvement Network (THIN) (UK) database (2.2 million adults aged 30–85 years with 25,208 osteoporotic and 12,188 hip fractures) [59]. The validation cohort gave AUC discrimination for osteoporotic fracture of 0.82 in women and 0.74 in men and for hip fracture of 0.89 in women and 0.86 in men. Calibration plots adhered closely to the line of identity. QFracture explained 63 % of the variation in hip fracture risk in women and 60 % of the variation in men (49 % and 38 % for osteoporotic fracture risk).
A small retrospective comparison of FRAX and QFracture was conducted in 246 postmenopausal women aged 50–85 years with recent low-trauma fracture and 338 non-fracture control women from 6 centers in Ireland and the UK [60]. AUC for fracture discrimination were similar in QFracture and FRAX (0.668 vs. 0.665) and also for hip fractures (0.637 vs. 0.710). The striking difference with AUC measures from the THIN database validation study is unexplained. The broad age range used in the initial validation work may have inflated the performance measures since osteoporotic fractures are unlikely before age 50. Additional assessments of QFracture in older women and men are needed.
Comparative Performance
Figures 4.1, 4.2, and 4.3 illustrate some of the differences between the fracture prediction systems discussed above for a 65-year-old woman of average height and weight with femoral neck T-score at the osteoporotic threshold of −2.5 and having the following CRFs: two previous fragility fractures (distal radius and humerus), type 2 diabetes, and one fall in the prior year. None of the systems uses all of the available information, and this contributes to the range in fracture predictions. For example, 10-year hip fracture probability varies from 4.7 % for FRAX, to 5.3 % for QFracture-2013, to 28.4 % for the Garvan calculator. It is clear that where an important CRF is not captured by a tool, clinical judgment must make some qualitative consideration of the importance of the missing information.
In designing a risk prediction tool, there is a trade-off between complexity (greater accuracy) and simplicity (adoption in clinical practice). Rubin et al. [61] performed a systematic review of screening and risk assessment tools (including FRAX, the Garvan calculator, and QFracture). Of a total of 48 tools, only 6 had been tested more than once in a population-based setting with acceptable methodology (defined a Quality Assessment Tool for Diagnostic Accuracy Studies [QUADAS] score above 60 %) [62]. There was no consistent evidence that more complex tools had better performance characteristics than simpler tools; however, the paucity of head-to-head comparisons limits any definitive conclusions. Larger, high-quality studies with different case mixes should address this important question.
Treatment Initiation and Monitoring
The fracture risk prediction tools described above were initially intended to identify patients who would benefit from pharmacologic therapy. Increasingly, there is interest in whether these tools can be used in treated individuals to (re)assess fracture risk and detect treatment-related reduction in fracture risk. These concepts and evolving clinical applications are explored in the following sections.
Treatment Decision-Making in the Untreated Individual
To date, only the FRAX tool has been integrated into national clinical practice guidelines [63–71], though a recent review of updated guidelines around the world found a wide diversity of approaches [72]. Some guidelines have embraced fracture risk as the preferred decision-making approach, and others are still largely dictated by BMD, whereas others are a hybrid. The National Osteoporosis Foundation (NOF) guidelines are an example of the latter, where treatment is recommended for individuals with an osteoporotic T-score, clinical osteoporosis based upon low-trauma spine or hip fracture, or in individuals with low bone mass (osteopenia) where fracture risk under the US FRAX tools exceeds 20 % for major osteoporotic fractures or 3 % for hip fractures [63, 64]. The NOF intervention thresholds were based on a cost-effectiveness analysis [73]. The Taiwanese guidelines are similar to the NOF guidelines but do not differentiate between those with osteoporosis or osteopenia or treat based upon BMD alone; treatment is suggested for postmenopausal women with osteoporotic fracture after 50 years of age or when FRAX with BMD reveals a 10-year major osteoporotic fracture risk ≥20 % or hip fracture risk ≥3 % [74]. Canadian guidelines recommend treatment initiation based upon high-risk fracture events (hip fracture, spine fracture, or multiple fragility fractures) or where major osteoporotic fracture probability exceeds 20 % [71]. The National Osteoporosis Guideline Group (NOGG), working in collaboration with many other societies from the UK, has fully embraced fracture risk in guiding therapy and recommends that treatment be considered in women with a prior fragility fracture (BMD measurement is optional) or when fracture probability with FRAX exceeds an age-specific intervention threshold [66, 75]. The intervention threshold at each age is set at a risk equivalent to that associated with a prior fracture, resulting in a lower threshold in younger individuals and a higher threshold in older individuals. NOGG restricts BMD to individuals whose fracture risk is close to the intervention threshold: individuals with fracture risk sufficiently below or above the intervention threshold are not recommended for BMD testing. The NOGG guidelines suggested treatment if the chance of fracture in a given individual exceeded that of a subject at a similar age with a prior fragility fracture [66, 75]. A similar approach has been advocated for the European setting by the European Society for Clinical and Economic Aspects of Osteoporosis and Osteoarthritis (ESCEO) and International Osteoporosis Foundation (IOF) [76]. The UK National Clinical Guideline Centre has provided guidance on the selection and use of FRAX UK and QFracture in the care of people who may be at risk of fragility fractures [77]. The diversity of guideline approaches in part reflects regional variations in population disease burden, practice patterns, health-care priorities, and economic considerations.
Reversibility of Fracture Risk with Treatment
The use of risk factors for case finding requires that the risk so identified is responsive to a therapeutic intervention. Table 4.1 indicates potentially reversible risk factors for each of the fracture prediction tools that are amenable to intervention, as well as those expected to be responsive to pharmacologic treatment. Some risk factors (e.g., age, sex, parental hip fracture) are clearly not amenable to intervention. Others could be specifically targeted (e.g., optimizing nutritional status and lifestyle factors, avoidance of high-risk medications, fall prevention) independent of pharmacotherapy for osteoporosis. Finally, pharmacologic intervention for osteoporosis targets one risk factor alone (e.g., femoral neck BMD) and would not affect other risk factors or fracture probability estimated in the absence of a BMD measurement.
The distinction between a reversible risk factor and reversibility of risk associated with that risk factor is important to highlight. Age is an example of an irreversible risk factor, but the fracture risk associated with older age has reversibility, i.e., the risk identified by age is amenable to therapeutic intervention. Most clinical trials that have shown efficacy recruited subjects on the basis of low BMD, but some trials have recruited patients on the basis of age, sex, a prior vertebral or hip fracture, and exposure to glucocorticoids [27, 78–81].
In the absence of a specific clinical trial, an alternative approach is to demonstrate through post hoc analyses that the presence (or absence) of a risk factor does not adversely influence therapeutic efficacy. The presence or absence of an interaction between treatment benefit and specific risk factors can help to inform the expectation of reversibility of risk. Lack of interaction implies that groups with or without the risk factors respond similarly. Therefore, even for irreversible risk factors, as long as there is no negative interaction, then this implies that the risk factor will not adversely affect treatment response. Alternatively, where a significant interaction exists, it may help to identify groups in whom greater (or lesser) benefit may be expected. These types of post hoc analyses conducted as part of pivotal clinical trials have generally not shown major interactions with the clinical risk factors used in FRAX [27]. Conversely, patients selected solely on the basis of risk factors for falling may respond less well to agents that preserve bone mass than those selected on the basis of low BMD [82]. In some cases, test for interaction may be nonsignificant due to limited power to detect such effects. Conversely, caution also needs to be exercised in interpreting results from multiple post hoc analyses due to the potential for false-positive findings [83]. For example, post hoc analyses from the FREEDOM study evaluating denosumab examined nine subgroups (age, BMI, femoral neck BMD T-score, prevalent vertebral fracture, prior non-vertebral fracture, estimated creatinine clearance, geographic region, race, and prior use of osteoporosis medications) [84]. No significant treatment interactions were observed on vertebral fracture prevention, but vertebral fracture prevention showed nominally significant interactions with BMI (treatment effective for BMI <25 kg/m2 but not for higher BMI; P-interaction 0.0135), baseline femoral neck T-score (treatment effective for T-score < −2.5 but not for higher BMD; P-interaction 0.0229), and prevalent vertebral fracture (treatment effective for those without but not with fracture; P-interaction 0.0377). In contrast, the HORIZON-PFT trial found greater intravenous zoledronic acid effects on vertebral fracture risk in younger women (P-interaction 0.05), normal creatinine clearance (P-interaction 0.04), and body mass index >25 kg/m2 (P-interaction 0.02), without significant treatment interactions for hip or non-vertebral fracture [85]. A meta-analysis found that the efficacy or raloxifene on vertebral fracture risk was significantly greater at lower ages [86]. Consistency of treatment effect among subgroups has been observed with alendronate, risedronate, and strontium ranelate [87–90].
Anti-fracture effect of several therapeutic agents has been analyzed based on initial FRAX fracture probabilities. Results have not been consistent between or even within classes of therapeutic agents. Greater relative risk reduction (beyond absolute risk reduction) has been observed with higher FRAX probability measurements with clodronate [91], bazedoxifene [92], and denosumab [93], but not with alendronate [94], raloxifene [86], or strontium ranelate [95]. For example, the FREEDOM study found that denosumab reduced fracture risk to a greater extent in those at moderate to high risk (Fig. 4.4) [93]. For example, at 10 % probability, denosumab decreased fracture risk by 11 % (P = 0.629), whereas at 30 % probability (90th percentile of study population), the reduction was 50 % (P = 0.001). It remains uncertain why differences would exist for some antiresorptive agents and not others. Similar type analyses with the Garvan calculator and QFracture have not yet been performed.
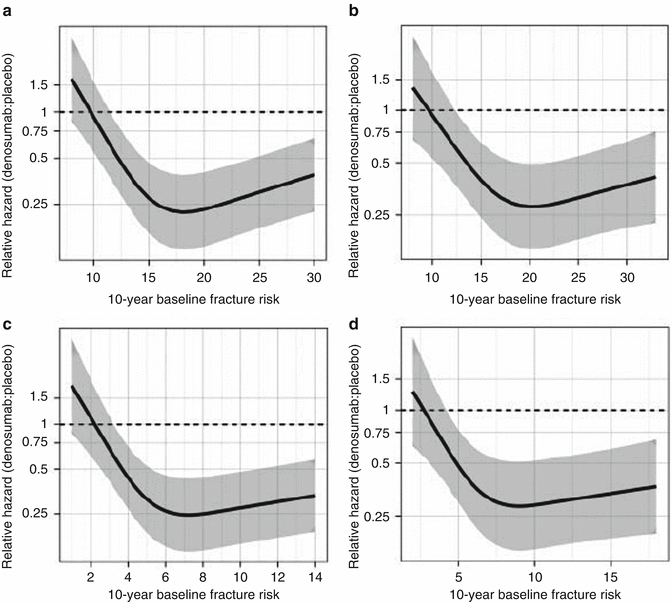

Fig. 4.4
Relationship between denosumab efficacy on clinical osteoporotic fractures and baseline FRAX probability of major osteoporotic fracture calculated with (a) or without (b) femoral neck bone mineral density (c, d). The efficacy on clinical osteoporotic fractures against baseline FRAX probability of hip fracture is shown. The extremes of the baseline probabilities represent the 10th and 90th percentile values. From McCloskey et al. [93]. Reprinted with permission from the American Society for Bone and Mineral Research
There is an implicit assumption that fracture prediction tools demonstrating increased fracture probability should identify individuals who will benefit from treatment with a reduction in fracture risk. If the relative risk reduction is relatively constant, then greater absolute fracture risk would imply a greater absolute benefit (equivalent to a lower number needed to treat [NNT]). Although intuitive, this is an area of controversy as no clinical trials have prospectively recruited on the basis of fracture probability. Subgroup analyses from two pivotal clinical trials, the Fracture Intervention Trial (alendronate) and the Hip Intervention Program Study Group (risedronate), showed little or no benefit from bisphosphonate therapy in subjects without low BMD [82, 94, 96].
Ultimately, if it were possible to identify factors robustly predicting greater anti-fracture effect, then this might allow for the construction of prediction tools for treatment benefit (as opposed to baseline fracture risk which may or may not always be reversible). The construct of such a tool might be quite different from the fracture probability tool used to identify baseline fracture risk and, as noted above, must consider differences between therapeutic agents. In some studies, change in BMD on therapy [97–99], bone turnover markers [100, 101], and measures of compliance/persistence on therapy have shown an association with treatment response [102]. Whether any such tool would explain sufficient variation in treatment response to be of clinical value would need to be established.
Effect of Treatment on Fracture Risk Prediction
Whether FRAX can be used to assess fracture risk in patients receiving concurrent treatment for osteoporosis has been uncertain since treatment effects are not explicitly accommodated in the model [50]. However, since many individuals were initiated on treatment prior to the availability of FRAX, this potentially limits the use of important information for advising patients on their need for continued treatment or whether treatment could potentially be withdrawn. To address this issue, a large clinical cohort was linked to population-based databases to determine medication prescriptions and fracture outcomes in 35,764 women (age >50 years) and baseline BMD testing and FRAX probabilities [103]. A pharmacy database was used to categorize women using osteoporosis medication as untreated, current high adherence users (medication possession ratio [MPR] >0.80 in the year after BMD testing), current low adherence users (MPR < 0.80), and past users. FRAX and femoral neck BMD alone stratified major osteoporotic and hip fracture risk within untreated and each treated subgroup (all P-values <0.001) with similar area under the receiver operating characteristic curve (Table 4.2). Hazard ratios for prediction of major osteoporotic fractures and hip fracture using FRAX were equally strong regardless of treatment status. In untreated and in each treated subgroup, a stepwise gradient in observed 10-year major osteoporotic and hip fracture incidence was seen as a function of the predicted probability tertile (all p-values <0.001 for linear trend). Concordance (calibration) plots for major osteoporotic fractures and hip fractures showed good agreement between the predicted and observed 10-year fracture incidence in untreated women and each treated subgroup (Fig. 4.5). Only in the highest risk tertile of women highly adherent to at least 5 years of bisphosphonate use was the observed hip fracture risk significantly less than predicted, while major osteoporotic fracture risk was similar to predicted. These data suggest that the FRAX tool can be used to predict fracture probability in women currently or previously treated for osteoporosis.
Table 4.2


Area under the receiver operating characteristic curve (AUROC) for fracture prediction and adjusted hazard ratios (HR) for fracture per standard deviation decrease in femoral neck T-score
Stay updated, free articles. Join our Telegram channel

Full access? Get Clinical Tree


