Introduction
We examine several dimensions of past, current and future demographic changes and the health dynamics of ageing in the USA and other developed countries. Models of the demographic and health dynamics of elderly and oldest-old populations require updating as information about the characteristics of those populations accumulates from (a) demographic sources (e.g. population censuses and vital statistics), (b) specialized longitudinal surveys of elderly populations, (c) epidemiological and clinical studies of elderly subgroups and (d) integrating multiple data sources in comprehensive models of health, ageing and mortality.1 This last approach will increase in importance with time as the linkage of biomolecular mechanisms with population dynamics becomes increasingly important in assessing the macro/population influences of accumulated knowledge from epidemiological, clinical and basic science studies. This is neither meta-analysis (statistical study of multiple clinical data sets) nor bioinformatics (analyses of laboratory studies to find common patterns). It is a new scientific discipline born of the mathematical integration of medicine, mathematics and biodemography. When populations are successfully modelled at micro (biomolecular), meso (organ systems and individuals) and macro (population) levels, the models can be applied to economic and policy studies—in both government and commercial service (to optimize the effects of medicine and medical research on population health). To understand how these models will evolve, we start with a discussion of the application of basic demographic techniques.
Probably the most basic view of the demography of ageing is that a trio of forces, each driven by multiple social and physiological processes, determines the current and future growth of the elderly and oldest-old populations in the USA and other developed countries. Two of these are the larger size of recent birth cohorts who will become the elderly in the near future and decreases in mortality at earlier ages allowing larger proportions of birth cohorts to survive to ages 65+ years. The third factor, discussed separately, is mortality declines at late ages and their age variable relation to, and interaction with, changes in health and functioning.
The first two forces are now well understood—although their magnitude is not appreciated. In the USA (as elsewhere), the oldest-old (aged 85+ years) population in 2005 was composed of persons born in 1920 or earlier. From the 1920 US birth cohort, 18.6% of males and 35.1% of females or 796 100 persons, were expected to reach age 85 years. Since life expectancy (LE) at age 85 years for this cohort is roughly 5.3 (males) to 6.6 (females) years, this implies a US population aged 85+ in 2005 of 4.9 million persons.
The largest US ‘baby boom’ cohort (1961) was 4.3 million persons. If 1920 male and female survival rates were applied to the 1961 birth cohort, then 1 154 550 persons would survive to 85 years—or 45% more persons than from the smaller 1920 birth cohort. US survival improved from 1920 to 1960. Of persons born in 1960, 34.4% of males and 49.9% of females are expected to reach 85 years. Applying these proportions to the 1961 birth cohort implies 1 812 450 persons would reach 85 years—an increase of 57.0% over the number surviving to that age from the 1961 birth cohort than if 1920 mortality rates had not changed. Increased birth cohort size and reduced early mortality increases the number of persons passing 85 years by 127.7%.
If all cohorts were similar in size, these two forces would imply (assuming that life expectancy at 85 years increases to 7.5 years) 13.5 million persons aged 85+ years—increases of 2.7 million persons due to larger cohort sizes and 5.9 million due to mortality declines. This increase would take 42+ years to realize, that is, the birth cohort of 1961 passes 85 years in 2046. These simple calculations, using actuarial survival statistics and population counts, gives a sense of the relative contributions of birth cohort size and improved early mortality to increases in the size of future elderly populations. Uncertainty about exact changes in the size and composition of the elderly population is largely due to uncertainty about mortality declines at late ages. Some projections envision larger populations reaching ages 85+ years, for example, 40+ million persons might reach ages 85+ years in 2050 if significant progress in improving known risk factors is assumed.1
Thus, if US social, economic and health conditions remain stable, the potential for large increases in the elderly and oldest-old population exists in the birth cohorts comprising the current US population and their early health and mortality experiences. Looking at the situation in reverse, the elderly and oldest-old populations currently being examined epidemiologically, clinically and physiologically come from cohorts born long ago [e.g. in 1915, pre-World War I (WWI) and 1930, the beginning of the great depression], which were relatively small at birth and which experienced what today would be extraordinary, and excessive, mortality risks and adverse early health experiences (e.g. exposures to many childhood diseases which are now prevented by vaccination or for which there are effective medical treatments; for many European countries, there are also the effects of injuries suffered by combatant males in WWI and WWII).
This brings us to the third force, that is, mortality experienced at late ages (e.g. ages 85, 95 and 100+ years) and antecedent health conditions. Late age mortality interacts with antecedent health and disability conditions (e.g. by mortality selection), which have dramatically changed across current elderly, and near elderly, cohorts. An understanding of the demography of ageing requires appreciating the health dynamics, current and historical, characterizing cohorts forming the elderly population.
Models of Chronic Disease and Mortality Trends
The idea that mortality and other age-related health conditions are mutable to late ages (i.e. age 85+ years) is relatively new. The idea that function can be regenerated and the physiological clock run backwards is even newer. In the USA, mortality was thought to have reached irreducible levels by the late 1950s or early 1960s because male survival decreased in that period—although female survival continued to improve. Social Security actuaries assumed that ultimate life expectancy limits would be reached in the United States in 2000 in Social Security Trust fund projections made in 1974. In 2011, the life expectancies of 75.9 and 80.9 years for males and females, respectively, were already 6.3 and 3.8 years above this ‘ultimate’ limit to life expectancy.
In Table 2.1, we present data on total, male and female life expectancy in 2011.
Table 2.1 Life expectancy for selected countries in 2011.

For the small country Monaco, the total life expectancy of 89.3 years and the female life expectancy of 93.4 years cause one to think the posited ultimate limit to life expectancy of 85 years mentioned above is far too low. The female life expectancy of 85.7 years in Japan and the total life expectancy of 82.3 years also suggest that one should be sceptical about ‘ultimate’ lifespan limit estimates.
Other authors suggested that US stagnant male mortality conditions in 1954–1968 reflected increased chronic disease risks due to the nature of industrial societies. Why risks might be elevated for cardiovascular diseases was discussed and a model was posited of the stages of the epidemiological transition of which the third, and end, stage characterized economically developed societies as having a high prevalence of chronic degenerative and man-made diseases with static life expectancy. Much of this pessimism was due, however, to congenital disorders, such as Down syndrome, where life expectancy could increase past reproductive ages, generating a ‘pandemic,’ or cascade, of chronic degenerative disease.
Analyses of mortality to late ages suggest why human life expectancy limits are difficult to estimate. First, human lifespans are long (e.g. it will take 120–130 years for a recent, large birth cohort to die out at current mortality levels in Japan, France and other developed countries, making it difficult to acquire reliable data on the full mortality experience of a birth cohort (let alone for multiple birth cohorts). Second, human populations are free living and cannot be studied in experimentally controlled environments. Hence the proportion of human life expectancy potential realized in any population is a smaller, and less certain, proportion of their biological potential than can be observed in animal models under experimental conditions. Third, for much of human history, fertility was a more dynamic factor than mortality in controlling population growth and shaping population structure. Thus, after large increases in US life expectancy at birth from 1900 to 1950 (i.e. from 47.3 years in 1900 to 68.2 years in 1950, an increase of 20.9 years or 0.42 years of life per calendar year) the rate of increase in life expectancy at birth slowed (e.g. from 68.2 to 70.8 years for 1950 to 1970 or 0.13 years of age increase per calendar year). From 1970 to 2000, life expectancy increased from 70.8 to 77.0 (6.2 years) or 0.21 years per calendar year (a 50% acceleration over the 1950–1970 period), with recent increases accelerating owing to declines in cancer mortality. In the subsequent 11 years, life expectancy increased by only 0.12 years per calendar year, returning to the rate of the 1950–1970 period.
For certain periods, US male life expectancy declined. From 1954 to 1968, male mortality rates increased by 0.2% per year; they declined by 0.8% per year for females. From 1970 to 2001, life expectancy at age 65 years for males and females combined increased (i.e. from 15.2 years in 1970 to 18.1 years in 2001 or 0.1 years of age per calendar year) and represented a larger proportion (45%) of the gain in life expectancy at birth (6.4 years) than before 1970. Gains were achieved, in part, by reducing mortality in ‘uncharted’ territory, that is, ages 85+ years. The first well-documented reports of centenarians occurred in about 1800. The first reliably documented report of a survivor to 110 years (a ‘super’ centenarian) was in 1931. The first documented survivor to 120 years (eventually dying at age 122 years) was recorded in 1995. It may be that a 130-year-old is alive but not yet discovered.
For the last 30 years, the centenarian population in the USA and several other developed countries has grown by 7% per year. As higher proportions of larger, more recent birth cohorts survive to late ages, reductions in mortality at those ages will contribute proportionately more to life expectancy gains.
What was observed about health changes in the 1982–1999 National Long Term Care Survey (NLTCS) was remarkable—and contrary to most models of human ageing. In Figure 2.1, we show changes in (a) life expectancy and (b) active life expectancy (ALE) (i.e. period lived free from serious disabilities2 in 1982 and 1999).
Figure 2.1 (a) 1982 and 1999 life expectancy estimates; (b) 1982 and 1999 active life expectancy estimates.
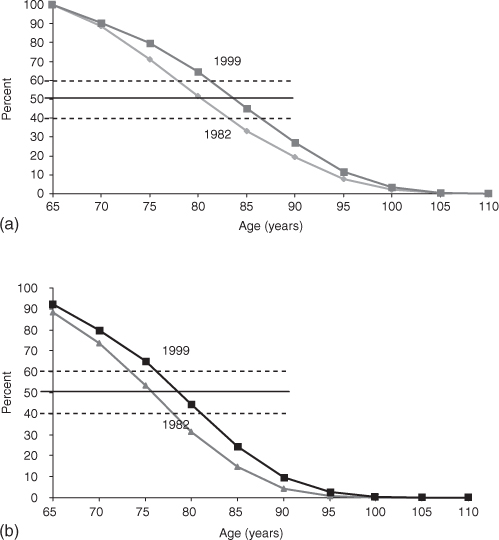
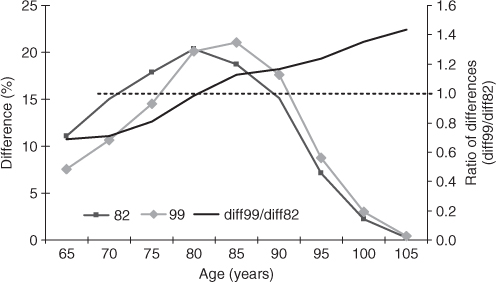
The change in life expectancy was 4.5 years and the change in ALE was 3.8 years. Thus, most (84%) of the gain in life expectancy was in healthy years of life. Figure 2.2 shows the acceleration of the improvement of functioning from age 65 to 100 years.
In Figure 2.2, we can examine rates of change in the difference between ALE and LE in 1982 and 1999. We see that the differences between LE and ALE were similar in 1982 and 1999, never being much higher than 20% (left axis)—although the 1999 differences shifted to the right by about 5 years at age 85 years. Despite higher life expectancy at all ages above 65 years, the difference at age 85 years is only slightly higher than (at age 80 years) in 1982. After age 85 years, the ratio of ALE and LE differences over age suggest a small difference and stable rates of change from 1982 to 1999, up to age 105 years. This is why we can expect future declines in disability and increases in ALE, that is, improvements are manifest to age 105 years.
Further complicating factors in efforts to predict life expectancy are gender and cause-specific differences in mortality. From 1950 to 1970, male life expectancy at 65 years increased by 0.3 years (i.e. from 12.8 to 13.1 years) with life expectancy declining from 1954 to 1968. Female life expectancy increases were 2.0 years from 1950 to 1970 (i.e. from 15.0 to 17.0 years). From 1970 to 2001, life expectancy at 65 years for both US males (13.1 years) and females (17.0 years) increased by 3.3 and 2.4 years—to 16.4 and 19.4 years, respectively. There were larger changes in cause-specific mortality. US age-standardized heart disease mortality declined by 57.8% and stroke mortality by 68.0% from 1950 to 2001. Age-standardized cancer mortality increased by 11.4% up to 1990 but from 1990 to 2001 it declined by over 9%. This decline was due to both social (smoking cessation) and treatment innovation—despite the criticism of the ‘war on cancer’. It was suggested that application of ‘drug efficiency testing’ at the individual level could improve the efficacy of chemotherapy by 20:1.
An area recalcitrant to treatment until recently was neurodegenerative disorders, for example, Alzheimer’s disease. Recent analyses of the 1982–1999 NLTCS show large declines in severe cognitive impairment. In 1994 and 1999, severe cognitive impairment was found to map to four ICD9 (Ninth Revision of the International Classification of Diseases) codes. Of these codes, those representing dementia due to circulatory disease (e.g. sequalae of stroke) or mixed processes showed most of the declines, that is, Alzheimer’s disease alone was stable.3, 4
The nature of medical conditions evolved as more persons survived to late ages, for example, up to the 1940s and 1950s much concern was directed to effects of rheumatic fever or syphilis on the heart, hypertension and stroke.5 In the 1950s and 1960s, hypertensive heart disease declined whereas atherosclerotic heart disease increased. The mean age at which hip fractures occurred in Britain from 1944 to 1990 increased from 67 to 79 years—a 12 years of age increase in 46 years. Concurrently, the nature of hip fractures shifted from intra- to extracapsular fractures. The nature of osteoporosis, the process underlying most US hip fractures, differs from ages 55 to 74 years, where it depends on postmenopausal change in estrogen levels, to ages 75+ years where it is related to age-related effects in the vitamin D endocrine system.
Clearly, more basic physiological processes were at work and over a longer period of time than anticipated by efforts to estimate life expectancy limits based on total and cause-specific mortality trends and by efforts to relate changes to significant, but recent, changes in ‘standard’ chronic disease risk factors. One study suggested that US stroke mortality started to decline by 1925.6 Fogel7 showed that US declines in chronic diseases may be even more long lived. He compared the prevalence of chronic diseases in Civil War veterans age 65–84 years applying for pensions in 1910 (US birth cohorts of 1825–1844) with the prevalence of chronic diseases for WWII veterans over 65 years assessed in the 1985–1988 National Health Interview Surveys (i.e. 1905–1924 cohorts). He found chronic disease prevalence at 65+ years declined by 6% per decade between 1910 and 1985–1988. The prevalence of heart diseases was 2.9 times higher in Civil War veterans aged 65+ years in 1910 than in WWII veterans aged 65+ years in 1985–1988. Declines in chronic diseases set the stage for subsequent declines in mortality up to several decades later.
Fogel7 attributed changes in chronic morbidity to economic and productive factors affecting early nutrition which increased stature and body mass index (BMI) over time. Many changes between Civil War and WWII veterans predate documented US increases in cholesterol and fat consumption—estimated to have peaked in 1959. One possible explanation of the effects of nutrition on health was the impact of protein, micronutrient and caloric deficiency on fetal development. This was attributed to effects of maternal nutritional deficiencies on the fetal development of organs such that a physiological priority was assumed to exist which dictated which organs received adequate nutrition under conditions of protein and caloric deprivation. If the central nervous system received the highest priority for nutrients, organs such as the liver (affecting cholesterol metabolism and thrombotic factors) and pancreas (affecting glucose metabolism) might be susceptible to developmental restrictions that became manifest in chronic disease risks at later ages. There is evidence for this in studies relating the ratio of placental to birth weight and of weight at 1 year of age to chronic disease at later ages. Higher weight at 1 year was found to be inversely related to ischaemic heart disease, systolic blood pressure and impaired glucose tolerance in adults and possibly to fibrinogen levels in men aged 59–70 years. The relation of systolic blood pressure to placental weight for women and men aged 46–56 years was direct.
Others have suggested that nutritional deficiencies affect persons most at ages where the most rapid physical growth occurs with the highest protein, caloric and other nutrient needs. This is consistent with Fogel’s use of the Waaler curve to plot changes in BMI and chronic disease risks.7
Stay updated, free articles. Join our Telegram channel

Full access? Get Clinical Tree


