Chromosomal Structural Rearrangements: Detection and Elucidation of Mechanisms Using Cytogenomic Technologies
b Department of Pediatrics and Pathology, University of Utah, Salt Lake City, UT 84108, USA
Keywords
• Genomic microarray • Insertions • Low copy repeats • Translocations • Fluorescence in situ hybridization • Karyotype
Genomic Microarray Can Help to Further Characterize a Chromosome Abnormality
Unexpected Loss or Gain at de Novo Breakpoints
The finding of a de novo balanced rearrangement increases the risk for a serious congenital anomaly to approximately 6.7%.1 This increased risk is often attributed to disruption of genes or regulatory elements. Using this logic, numerous studies focused on breakpoint mapping of de novo balanced rearrangements in an individual with phenotypic abnormalities have identified genes involved in important developmental pathways.2
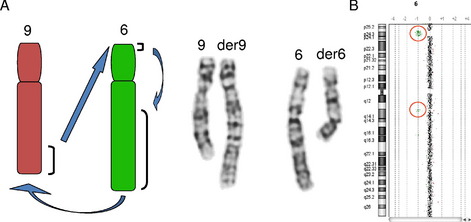
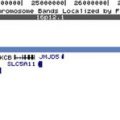
In addition, numerous studies have also shown that de novo apparently balanced translocations associated with an abnormal phenotype often have a cryptic imbalance at or near 1 of the translocation breakpoints (Fig. 1), or have cryptic imbalances elsewhere in the genome. These cryptic imbalances certainly are associated in some cases with the increased risk of the rearrangement resulting in a clinical consequence and justify the further characterization of an apparently balanced cytogenetic rearrangement with high-resolution copy number analysis via genomic microarray.3–9
The Unbalanced Chromosome Banding Pattern May Mimic a Normal Pattern
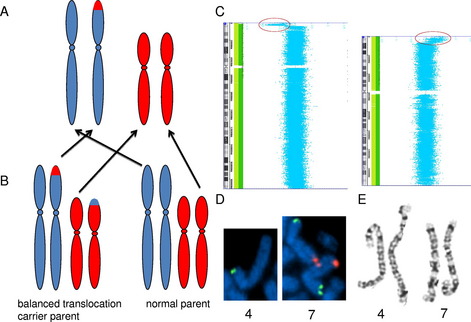
Not only is genomic microarray preferable for the detection of small copy number changes, it is also preferable for the detection of many large copy number changes. The standard resolution of a chromosome analysis is between 5 and 10 megabases. However, the detection of a chromosomal rearrangement depends on the disruption of normal banding patterns, and there can be many large rearrangements that do not alter the normal banding pattern. For example, an unbalanced translocation results in a terminal deletion of 1 chromosome end and a duplication of another chromosome end, with the duplicated material residing in the genomic location of the deleted material (Fig. 2A). Because the majority of unbalanced translocations arise from balanced translocations in a carrier parent (see Fig. 2B), recognition of the imbalance is both critical for detection of the etiology of the abnormal phenotype, and critical for recurrence risk assessment. However, if the duplication and deletion are of similarly sized and similarly banded chromosome regions, this rearrangement will not be detected by a chromosome analysis (see Fig. 2E), even if the alteration results in greater than 10 megabases of DNA undergoing gains and losses; however, this imbalance is easily detected by genomic microarray (see Fig. 2C, D).
Abnormal Banding Pattern May Not Show All Relevant Imbalances
It is also possible for multiple chromosome alterations to exist in 1 individual. The cytogenetic recognition of 1 alteration may satisfy the inquiry for the etiology of the patient’s phenotype; however, a higher resolution analysis may reveal an unexpected additional alteration that has clinical significance. Examples include the initial interpretation of a pure terminal deletion, which then by genomic microarray shows both the terminal deletion and an unsuspected terminal duplication of a different chromosome end, leading to the reclassification of the rearrangement as an unbalanced translocation. As an example, an analysis of 4p deletions associated with Wolf–Hirschhorn syndrome showed a higher frequency of unbalanced translocations than predicted by chromosome analysis alone.10 It is also possible for the multiple chromosome alterations to be independent, and yet both contributory to the clinical phenotype.
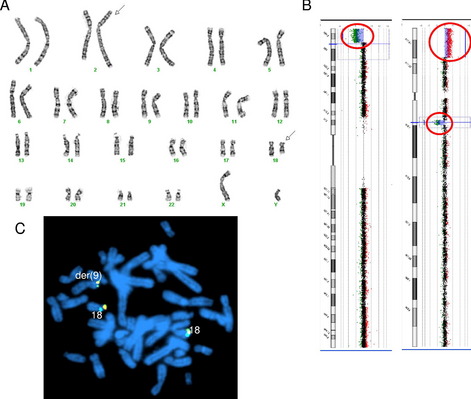
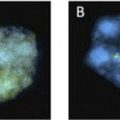
These concepts of loss of genomic material at translocation breakpoints, large but cytogenetically cryptic rearrangements, and multiple likely independent rearrangements is demonstrated by a recent case in our laboratory. Cytogenetic analysis showed an apparently balanced translocation between 2q and 18q (Fig. 3A), subsequent genomic microarray showed a loss of 18q material at the cytogenetic location of the 18q breakpoint. In addition, the genomic microarray also showed a terminal deletion of 9p and terminal duplication of 18p of similar sizes and banding patterns (see Fig. 3B). FISH with the 18p subtelomere probe confirmed an unbalanced translocation between 9p and 18p (see Fig. 3C).
Inherited Identical Banding Patterns May Not Represent the Same Genomic Alteration
The utility of genomic microarray for further characterization of a chromosome rearrangement is not limited to de novo alterations. Identical banding patterns in family members are generally assumed to represent the same genomic architecture. However, it is possible for balanced and unbalanced rearrangements to have identical banding patterns, and the unbalanced rearrangements may originate from the segregation of a balanced parental rearrangement. Two independent published cases from our laboratory showed an identical banding pattern between the unaffected balanced parent and the affected unbalanced child. In 1 case, the parent carried a balanced double intrachromosomal insertion that underwent recombination to produce both an interstitial deletion and duplication. In the other case, the carrier parent had a double interchromosomal insertion with unbalanced segregation of the derivative chromosomes in the affected child.11 Therefore, if phenotypic differences exist in the individuals showing the same chromosome banding patterns, a higher resolution copy number analysis is recommended for further characterization of the imbalances that may be associated with the banding patterns.
Deletion Size May Change Between Generations
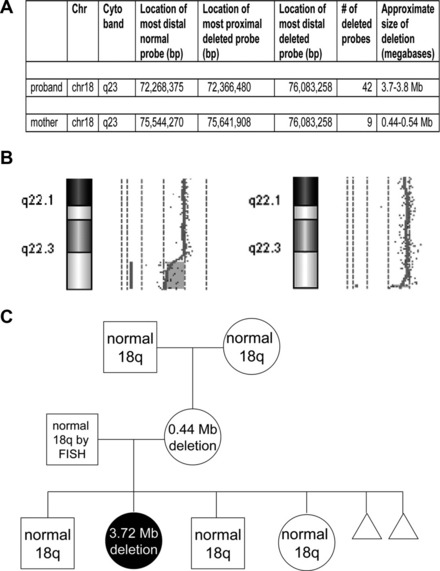
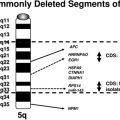
Phenotypic differences between a parent and child with a deletion may rarely be explained by changes in the size of the inherited deletion. Two studies have reported the identification of a small, cytogenetically cryptic, subtelomeric deletion in a phenotypically mildly abnormal or normal mother that expanded into a clinically consequential and cytogenetically visible deletion in their affected child12,13 (Fig. 4). Because only 2 reports currently exist, the frequency of deletion size expansion is not certain, and may be rare. Still, these reports illustrate the need for more comprehensive analyses of parental chromosome structure when characterizing an abnormality in a child.
Stay updated, free articles. Join our Telegram channel

Full access? Get Clinical Tree


