Fig. 13.1
Genetic heterogeneity of cancer cells. All cancer cells are derived from a common ancestor cell (black dot) that was subject to the pathogenic mutation (w). After an initial homogenous division period, other mutations (x, y, z) appear in various cells. They are subject to selection pressure and the ratio of cells harboring a specific mutation will vary over time. The analysis of the genetic content of the tumor will reveal different results depending on the stage where is performed the analysis (A, B, C, D, or E). The interpretation of the results can thus be hazardous. In fact, x and z mutations are present at the same level at stage D (respectively present in 14 % and 17 % of cells) but only the z mutation will subsequently be selected while the x mutation will progressively disappear from the tumor (stage E). The x mutation could therefore be considered as a passenger mutation while the z mutation could be considered as a disease causing mutation that will contribute to the cancer phenotype.
13.2 Mutations in Human DNA
The number of somatic mutations in cancer is the sum of the mutations acquired at each round of DNA replication in the normal and neoplastic cellular lineage leading from the fertilized egg to the progenitor cell of the neoplastic clone. Variation in mutation number may therefore be determined by variation in the number of mitoses and/or by the factors influencing the mutation rate, including mutagenic exposures and DNA repair defects.
Most analyses have been performed on germ line mutations. They have shown that the most common substitution for A (adenine) is G (guanine), for C (cytosine) it is T (thymine), for G it is A, and for T it is C. In addition, it has been shown that CpG dinucleotides mutate to TpG at a frequency five times higher than mutations in all other dinucleotides [20–22]. This event can occur on both DNA strands and can result either in C > T or G > A on the coding strand. It is therefore frequently referred to as CG > TA transitions.
Spontaneous transitions occur during DNA replication through inappropriate pairing of nucleotides, due to a shift of one of the nucleotides to a rare tautomeric form. For example adenine and cytosine can change to an imino form instead of the regular amino form. Another mechanism of transition is the deamination of a methylated cytosine residue. This is the most frequent source of transitions in eukaryotes as a significant proportion of cytosines are methylated (Fig. 13.2).
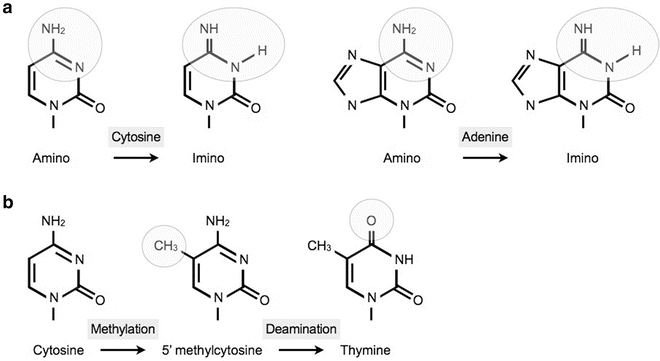

Fig. 13.2
The most frequent even ts that lead to a transition. (a) Shift to a tautomeric form cytosine and adenine shift to an imino form. (b) Schematic presentation of the transversion from a cytosine to a thymine after methylation and oxidative deamination.
Spontaneous transversions arise through a combination of two events: tautomerization and base rotation. This rotation causes the so-called syn-conformation of DNA or Z-DNA. As only 10 % of the DNA is present in the syn-conformation at any given time, and as the transversion mechanism involves an additional step in comparison to transitions, the frequency of spontaneous transitions is reduced. Nevertheless, transitions and transversions can also result from the exposure of the DNA molecule to various carcinogens. Therefore, the mutational event spectrum of a specific gene should be viewed as a combination of both spontaneous and induced mutations.
Deletions or insertions of a few nucleotides are also common in the human genome. Data from the Human Gene Mutation Database (HGMD) (http://www.hgmd.cf.ac.uk), which contained by February 2007 an excess of 67,030 different lesions detected in 2478 different genes [23] show that small deletions and insertions account for 15 % and 6.6 % of germ line mutations, respectively. Germ line deletions of 1–3 base pairs (bp) account for 70 % of small deletions and frequently result in an alteration of the reading frame (78 %). The mechanisms by which these micro-rearrangements occur remains unknown, but it has been shown that (1) deletion of one or a few nucleotides frequently occurs in runs of the same nucleotide [24], and (2) larger deletions involve inverted repeats and symmetric elements [25, 26]. Micro-insertions are three times less frequent than micro-deletions, and nearly half of these involve the insertion of only one nucleotide.
Somatic mutations are acquired in somatic tissue during the subject’s lifetime and predominantly result in neoplastic disease. These mutations can either be spontaneous or induced by exogenous compounds such as UV, carcinogens, or radioactivity.
The analysis of somatic mutations extracted from the UMD-TP53, UMD-APC, and UMD-VHL databases reveal that micro-deletions represent respectively 8 %, 51.4 %, and 28.6 % of somatic mutations, while micro-insertions account for 2.6 %, 12.2 %, and 7.5 % [27–29]. As for germ line mutations, an excess of deletions is observed with an average ratio of 3.4 deletions per insertion (this ratio is close to 3 for germ line mutations reported in HGMD). The study of repeated sequences surrounding the deletion reveals that the size of the deletion is not related to the size of the repeated sequences (Fig. 13.3a). In contrast, the study of micro-insertions show that the insertion is sequence dependent and will result in the creation of a repetition of whom the size is directly proportional to the insertion size (Fig. 13.3b).
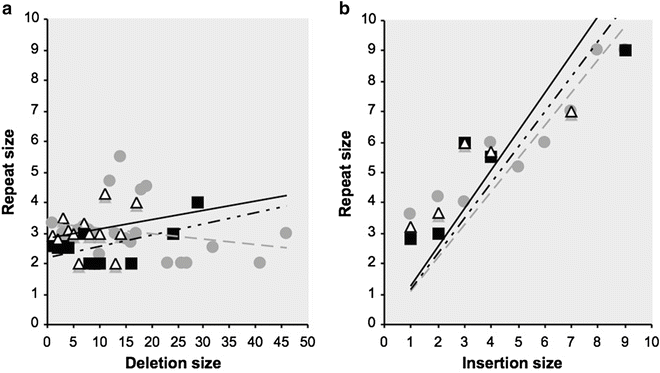

Fig. 13.3
Distribution of repeated elements surrounding deletions (a) and insertions (b). Dark squares = data from the VHL gene; grey circles = data from the TP53 gene and white triangles = data from the APC gene. Dotted line = fitting curves for VHL, grey lines = fitting curves for TP53, and black lines = fitting curves for APC.
13.3 Consequences of Mutagen Exposure
Mutagens are usually defined as chemical agents that increase the rate of genetic mutation by interfering with the function of nucleic acids. A clastogen is a specific mutagen that causes breaks in chromosomes. Mutagens that specifically res ult in nucleotides substitutions usually have a two step mechanism. The first event is the production of a DNA adduct, the second one being the inability of the cell to correctly repair this abnormal complex. In fact DNA adducts are chemical complexes that result from various chemical reactions between DNA and small molecules able to induce these reactions. These DNA adducts mostly involve one or more nucleotides, such as pyrimidine dimers, from a single DNA strand resulting in a mismatch between the two DNA strands. To preserve the genomic integrity, eukaryotic cells employ complex surveillance mechanisms called checkpoints to counteract DNA damage. The complex DNA damage checkpoint network is composed of DNA damage sensors, signal transducers, and various effector-pathways, and its major components are the phosphoinositide 3-kinase related kinases (PIKKs), ATM (ataxia telangiectasia mutated), ATR (ATM and Rad3-related), and DNA-PK (DNA-dependent protein kinase) [30–34]. ATM with its regulator MRN (Mre11-Rad50-NBS1) complex to sense double-strand breaks (DSBs) [35] whereas ATR with its regulator ATRIP (ATR-interacting protein) sense single-strand DNA (ssDNA) generated by processing of DSBs, as well as ssDNA present at stalled replication forks. Both kinases then initiate a signaling cascade that includes mediators, transducers, and effectors. About 25 ATM and ATR substrates have been identified [36]. Depending on DNA lesions, activated checkpoints can then mediate cell cycle arrest in G1, S, or G2 phases, DNA repair or even cell death by apoptosis. Matsuoka and coworkers have performed a large-scale analysis to identify proteins phosphorylated in response to DNA damage [37]. They have identified more than 700 candidate proteins that are involved in various biological processes (Fig. 13.4). Progress made in the decoding of these extraordinarily complex pathways reveal that the DNA-damage response network profoundly alters the cell.
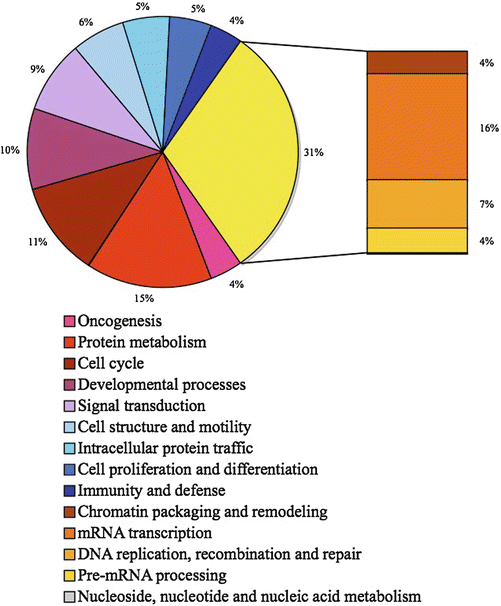

Fig. 13.4
Biological process of the more than 700 candidate ATM and ATR substrate proteins. Data adapted from Matsuoka et al. [37].
In addition to this first level of response to DNA damage, a second barrier against cell alterations has been identified, oncogene-induced senescence [38–41]. Oncogene-induced senescence belongs to a heterogeneous group of cellular responses that include replicative senescence, which is induced by telomere attrition and depends of the activation of the DSB checkpoint [42]. In contrast, oncogene-induced senescence is a telomere-independent form of senescence associated with precancerous lesions [43]. Indeed, it is believed that this senescence is recruited to terminate a pre-malignant condition before a fully transformed stage can develop. Various experiments have clearly demonstrated that senescence can act as a key barrier to oncogene-mediated transformation in vitro but only few data have been collected in vivo. Melanie Braig and coworkers have provided a nice example about lymphoma development. They have shown that Ras-induced lymphomagenesis can be efficiently regulated by the histone methyltransferase Suv39h1 that methylates H3K9 into H3K9me creating binding sites for HP1 proteins to form constitutive heterochromatin locally. Thus, mice lacking at least one Suv39h1 allele developed lymphomas, whereas most transgenic control animals remain free of lymphoma. They also showed that this phenomenon is dependent on ARF and p53. Thus, an alteration of one of these two senescence regulators leads to the development of lymphomas [44].
Eukaryotic cells harbor complex and efficient networks to avoid mutations. These networks integrate a recognition step that will target DNA damage/intermediates such as uracil, 7,8-dihydro-8-oxoguanine (8-oxoG), 3-methyladenine, apurinic/apyrimidinic (AP) sites, and SSBs followed by: the excision of the inappropriate base moiety (e.g., 8-oxoG), the incision at the resulting abasic site, the replacement of the excised nucleotide, the cleanup of the terminal end(s), and the sealing of the final nick [45]. One of the most studied pathways is the repair step that involves the uracil-DNA glycosylase (UNG), which is responsible for the removal of uracil from DNA. This uracil is usually the result of an erroneous incorporation of dUMP opposite to adenine during the DNA synthesis or the result of a deamination of a methylcytosine (Fig. 13.5) that results in a mispairing between U and G and ultimately to a C to T transition if a DNA polymerase replicates across the mismatch [46]. UNG is a highly conserved enzyme found in many species from E. coli to human. All UNG appear to have very similar properties: they are able to cleave uracil from both single- and double-stranded DNA, whether it is in a U/A base pair or any type of base mismatch [47]. This enzyme hydrolyzes the N-glycosidic bond linking the uracil to the sugar and initiates the base excision repair (BER) process [48]. Other base alterations are frequently found in DNA. Among them, the 7,8-dihydro-8-oxoguanine (8-oxoG), also called 8-hydroxyguanine, is a by-product of normal aerobic metabolism. It is strongly mutagenic and able to base pair with adenine and cause G:C → T:A transversion mutations. The OGG1 DNA glycosylase is the major activity excising 8-oxoG from DNA [49].
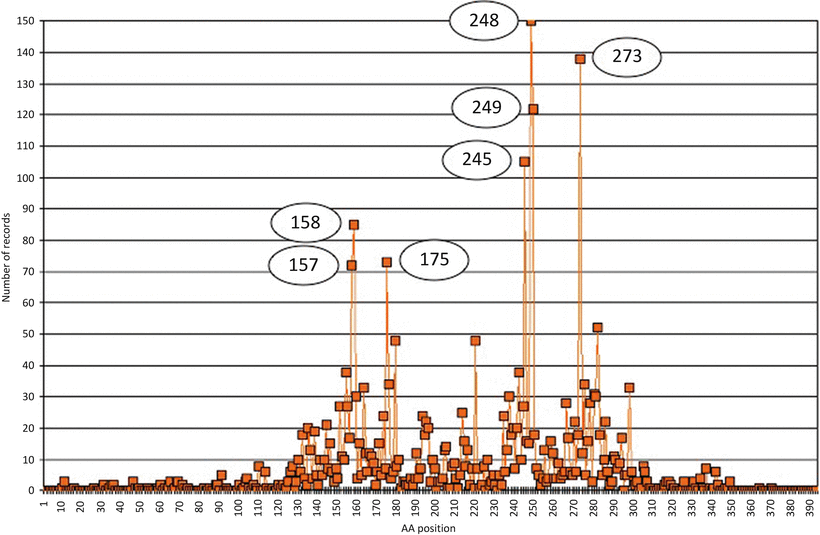

Fig. 13.5
Distribution of TP53 gene m utations in lung cancers. Data were extracted from the UMD-TP53 (http://www.umd.be) that contains 2784 mutations from lung cancers (July 2007 release). X-axis = amino acid residues, Y-axis = number of records. Circles indicate hotspot positions.
13.4 Gene Targets
Because of the high efficiency of the BER , the DNA damage checkpoint network, and the oncogene-induced senescence mechanisms, the probability for a mutation to arise is very low. Therefore, mutation of key genes from one of these pathways, as well as oncogenes or tumor suppressor genes, will more efficiently be selected and they are therefore good candidates for cancer-associated genes.
Historically, the identification of cancer genes relied on virus and linkage analysis using large kindreds with a high incidence of cancers. These two approaches led to the identification of oncogenes and later on to tumor suppressor genes associated with a predisposition to develop cancers. The first human retrovirus HTLV-1 was discovered in the late 1970s) [50], and the first tumor suppressor gene identified was the RB1 gene involved in retinoblastoma [51]. More recently, mismatch repair genes (hMLH1, hMSH2, and others) involved in microsatellites instability and colorectal tumors were discovered [52, 53]. These early discoveries paved the way to the identification of a large set of genes associated with cancers. The list being now too long to be printed here, additional information can be found at the Cancer Genome Anatomy Project (http://cgap.nci.nih.gov/Genes) where more than 220 oncogenes and 260 tumor suppressor genes are recorded.
Concomitantly to these efficient approaches to identify genes involved in the early steps of cancer development (i.e., genes involved in the cancer initiation), three other approaches have been developed to identify cancer genes.
13.4.1 DNA Adducts
A DNA adduct is the first step to DNA damage that will eventually result in a mutation. Various examples have shown that levels of DNA adducts vary with a number of lifestyle, environmental, and chemical exposure factors. It has also been shown that increased dietary intake of antioxidants and essential metals, especially zinc, is protective. The detection of DNA adducts as pro-mutagenic markers could enable an understanding of cancer risk. In fact, cancers with poorly defined etiology may be explained once DNA adducts have been identified. Various assays and in vivo protocols are available to evaluate the mutagenicity of a single agent but, as for drugs interactions, the evaluation of complex mixtures for mutagenicity is difficult. In addition, it is often challenging to predict if the mutagenic compound identified in vitro will reach the target organ at a sufficient concentration. The short-lived positron-emitting radionucleides molecular imaging is an approach as well as the use of IR microspectroscopy that can be used as a high-throughput technology [54], but the need for an inexpensive in vitro system remains [55]. Despite these limitations, numerous studies have been able to demonstrate a relation between DNA adducts and mutations at the gene level. An interesting illustration is given by the study of chromium in the context of lung cancers. Chromium (Cr) is a ubiquitous environmental contaminant that is also used in various occupations (artistic painting) or industries (chemical industry, anticorrosion paints, and others). In addition, Cr is also present in cigarette smoke. Hence, it has been suggested that chromium exposure and cigarette smoke may have a synergistic or additive effect in inducing lung carcinogenesis [56]. In addition, while the direct exposure to Cr (III) is not harmful as this compound is not able to penetrate human cells, the exposure to other compounds such as Cr (VI) will ultimately lead to the production of Cr (III) after various intracellular reducing reactions. This intracellular Cr (III) is then able to form covalent binary and ternary DNA adducts that have mutagenic potencies [57]. It has been shown that these DNA adducts preferentially form in NGG sequences, which include codons 245 (GGC), 248 (CGG), and 249 (AGG) of the p53 gene, the mutational hotspots in cigarette smoke-related lung cancer. While polycyclic aromatic hydrocarbons (PAHs), the major carcinogen found in cigarette smoke, bind to the p53 mutational hotspots for lung cancers including codon 157 (GTC), 158 (CGC), 245 (GGC), 248 (CGG), and 273 (CGT), while codon 249 (AGG) is not a preferential site for PAH binding [58, 59].
The finding that Cr (III) strongly binds at codon 249 suggests that the etiological agent for lung cancer with codon 249 mutations is Cr (III). Mutations involving this codon account for 4.4 % of mutations from lung cancers. Mutational events involving this residue are presented in Fig. 13.6.
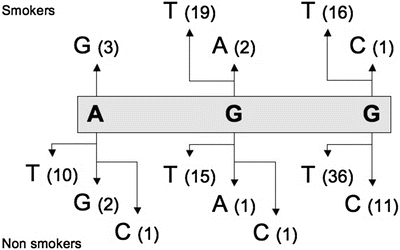

Fig. 13.6
Simple mutational events involving codon 249 of the TP53 gene in lung cancers. Top = mutational events reported in smokers; Bottom = all mutational events. Data were extracted from the UMD-TP53 (http://www.umd.be) that contains 2784 mutations from lung cancers (July 2007 release).
Mutations involving the second base of codon 249 are more frequent for smokers (21/41–51.2 %) than for nonsmokers (17/67–25.4 %). However, results show that Cr (III) binds at the second base two times more frequently than at the third base of this codon. It has thus been suggested that the Cr (III)–DNA adducts formed at the second and third bases of this codon are repaired with different efficiencies and/or that they affect the fidelity of DNA replication differently [60]. The DNA adducts approach is usually restricted to the study of a particular component and its relationship with mutations from a previously identified gene. It is thus not frequently used to identify new cancer genes .
13.4.2 Cancer Transcriptome
Another approach is the analysis of the cancer transcriptome . With the completion of the Human Genome project [61], life scientists were challenged with the task of analyzing the expression levels on a global scale. In 1995, microarrays were developed as a high-capacity system to monitor the expression of numerous genes in parallel. These microarrays were prepared by a high-speed robotic printing of cDNAs on a glass support. This matrix was further used for quantitative expression measurements of the corresponding genes [62]. In parallel to these microarrays produced by a deposition of cDNA fragments or oligonucleotides on slides, a new in situ synthesis technology that combines photolithography and chemical DNA synthesis was developed [63–65]. This technology enabled a further miniaturization of the assay and the manufacturing of high density oligonucleotide microarrays. The GeneChip® Human Gene 1.0 ST Array is a product in the family of Affymetrix expression arrays offering whole-transcript coverage. It includes 764,885 25-mer probes to address each of the 28,869 genes with an average of 26 probes per gene (http://www.affymetrix.com).
These technical developments allowed testing of the hypothesis that identification of cancer subtypes could be accomplished through detection of all genetic modifications found in cancer cells. This was driven by the fact that cancer cells accumulate genetic abnormalities and that, while they share common genetic defects, specific alterations will be found only in a homogeneous subtype of tumors. The implications of this hypothesis would range from diagnosis (development of classifications on the basis of gene expression patterns) to therapeutic (patient prognosis and the response to a particular treatment). The hundreds of analyses performed have shown that known types and subtypes of cancer can be distinguished by their gene-expression profile. In addition, new molecular subtypes have been discovered that are associated with various properties such as the propensity to metastasize. While microarrays can be used to search for cancer genes among a list of candidate genes, the two main foci of microarray investigations are to improve our understanding of the pathophysiology and/or the molecular etiology of a specific cancer and the detection of genetic markers that could improve the differential diagnosis. Early results were very promising [66]. With the accumulation of data from various teams, limitations of the technology were soon recognized. In fact, the power of microarray studies depends not only on the quality of the array design and production, but also on the statistic and bioinformatics approaches used to analyze the data. Thus, because this technology offered the possibility to investigate a multitude of genes in a small number of samples, it also introduced the most challenging problem of microarray analysis, which is the problem of multiple comparisons. Therefore the Westfall-Young step-down permutation correction should be mandatory. In addition, hierarchical cluster analysis has become the most popular and most frequently used multivariate technique to analyze microarray data. This method defines a distance between two tumors based on the difference in gene expression. It produces a complete tree with leaves as individual patterns and the root as the convergence point of all branches. However, given enough genes, the genes will always cluster. Therefore, there is only minor scientific value in the fact that there are genes that behave in a similar way. It has been shown that these approaches have numerous limits and that clustering trees can even be produced when starting with very poor quality signals questioning about the significance of reported data [67]. Similarly, it has been recognized that the clustering is today overused to interpret microarray data [68].
In 2005, Rhodes reported the clinical utility of array-based gene profiles in breast cancer based on data from van de Vijver et al. [69], 2 years later a review by Michiels et al. [70] gave quite different conclusions. They underlined that most prediction rules using gene expression have not provided a substantially and significantly improved prognostic classification when compared to conventional prognostic factors [71, 72]. Thus they concluded that these results could be interpreted as disproving the initial assumption and stated that if published results are correct to the extent that published combinations of genes have some prognostic value, many other gene combinations would be as good. Besides, none have been shown to add much to the clinical information that is routinely available. The example of breast cancer illustrates a problem that is central to the interpretation of microarray data. Studies with a solid experimental design and large sample sizes are required before gene expression profiling can be used in the clinic to predict outcome [70].
Eszlinger et al. arrived at similar conclusions in the context of thyroid malignancies [73]. Reviewing microarray data they reported that the use of different platforms and experimental designs (intra-individual or inter-individual comparisons) as well as the use of various control tissues (non-nodular healthy tissue or benign lesions such as goiter or follicular adenoma) complicate cross-analysis. In addition, the studies are characterized by strong differences in data analysis methods, which vary from simple empiric filters to sophisticated statistic algorithms.
Microarray technology is still in its early days of development. In order to standardize its usage strong improvements have to be made to standardize experimental designs and analysis. Quality controls [74] need to be defined and the various platforms should include common probes to allow meta-analysis. Despite these limitations, this technology is promising and should in the next years give valuable information to improve understanding of the pathophysiology and/or the molecular etiology of cancers and the detection of genetic markers that will improve the differential diagnosis and the prognosis of drug response. This technique is not the method of choice to search for cancer genes mutated in tumors as most of the down-regulated or up-regulated transcripts are the result of loss of cellular differentiation in cancer.
Stay updated, free articles. Join our Telegram channel

Full access? Get Clinical Tree


