Signaling Inhibitors: IGFR, PI3K Pathway, Embryonic Signaling Inhibitors, and Mitotic Kinase Inhibitors


Signaling Inhibitors: IGFR, PI3K Pathway, Embryonic Signaling Inhibitors, and Mitotic Kinase Inhibitors


Helen X. Chen

Austin L. Doyle

Naoko Takebe

William C. Timmer

Percy S. Ivy


Significant progress has been made in understanding the molecular basis of cancer; this knowledge is being translated into the design and development of signal transduction inhibitors for cancer treatment. Multiple signaling pathways have been implicated in the development and persistence of cancer, including the (IGF-1R) and the phosphatidylinositol-3 kinase (PI3K)-protein kinase B (AKT) pathway, as well as several embryonic signaling pathways. In this review, we will examine the molecular targets within important signal transduction pathways, specifically IGF-1R, PI3K, AKT, Hedgehog (Hh), Notch, Wnt, kinesin spindle proteins (KSPs), polo-like kinases (PLKs), and aurora kinases, found to be responsible for cancer cell development, proliferation, maintenance, and malignancy. Furthermore, agents designed to target these pathways will also be discussed, as well as challenges facing the preclinical and clinical development of targeted therapies against these signaling pathways.


Inhibitors of IGF/IGF-1R Signaling


Overview

IGF-1R has been recognized for decades for its role in the tumorigenesis and growth.1 Various approaches targeting this pathway have been explored in the laboratory, including monoclonal antibodies (mAbs), small molecule tyrosine kinase inhibitors (TKIs), antisense, and insulin-like growth factor I (IGF-I) peptide mimetics.2 Clinical development of IGF-1R inhibitors had, however, lagged until advances in medicinal chemistry and biotechnology. Currently, more than ten new IGF/IGF-1R-targeting agents have entered clinical trials. The two main classes of IGF-1R inhibitors in clinical development are mAbs and small molecule TKIs.


IGF-1R and IGF System

IGF-1R is a receptor tyrosine kinase (RTK) activated by binding to its ligands, IGF-I or insulin-like growth factor II (IGF-II). IGF-1R is expressed on the cell surface as preformed dimers and is composed of two extracellular α-chains and two membrane-spanning β-chains in a disulfide-linked β-α-α-β configuration.

IGF-1R shares extensive homology with the insulin receptor (IR) and belongs to the insulin receptor family that includes IR (homodimer), IGF-1R (homodimer), IGF-1R/IR (hybrid receptors), and the mannose-6-phosphate receptor (IGF-2R)1 (Fig. 30-1). IGF-1R can be activated by IGF-I or IGF-II; IGF-1R/IR hybrids act like homodimers, preferentially binding and signaling with IGFs. IR exists in two isoforms: IR-B (traditional IRs) and IR-A (a fetal form that is re-expressed in selected tumors and preferentially binds IGF-II).3 IGF-2R is a non-signaling receptor that acts as a “sink” for IGF-II.4 These receptors may coexist in a given cell; however,
individual receptors’ relative abundance and activation status vary with specific cells, tissues, and physiological or pathological conditions.


FIGURE 30-1 The insulin receptor family includes the IR (in isoforms IR-A and IR-B), the type 1 insulin-like growth factor (IGF-IR), and the mannose-6-phosphate receptor (IGF-IIR). IR and IGF-IR, both tyrosine kinase receptors, are expressed as preformed dimers, either as homodimers or heterodimers (IR/IGF-IR). IGF-IIR is a non-signaling receptor that acts as a “sink” for IGF-II. Insulin binds primarily to the two isoforms of the IR receptor, but also it has weak affinity for IR/IGF-IR heterodimer. IGF-I and IGF-II are ligands for the IGF-IR and IR/IGF-IR hybrid receptor; IGF-II also binds to IR-A isoform. IGF-BPs bind to and prevent IGF-I and -II from activating the receptor signaling cascades. (Please see Color Insert.)

The ligands, IGF-I and IGF-II, are abundant in the serum of adults.5 IGF-I is secreted primarily by the liver upon stimulation by human growth hormone (HGH) but can also be produced in muscle and bone. IGF-II is not dependent upon HGH and is expressed in a variety of tissues. Six well-characterized IGF-binding proteins (IGFBP-1 through -6) can bind IGFs and prevent their action on the receptors. Only about 2% of IGF ligands exist in free-form in serum. Local bioavailability of IGF-I/II for IGF-1R signaling is also altered by IGF-BP protease and the presence of the non-signaling, IGF-II-binding IGF-2R.

Intracellular signaling of IGF-1R is triggered upon binding of IGF-I and IGF-II and mediated through IR substrates 1 to 4 (IRS 1 to 4) and Src-homology collagen protein (Shc).6 This leads to activation of two main downstream pathways: the RAS-RAF-mitogenactivated protein kinase kinase (MEK)-extracellular signal-related kinase (ERK) pathway and the PI3K-AKT pathway.4 It is generally accepted that PI3K-AKT is the more predominant signal transduction pathway for the IR family.


IGF-1R and IGF in Normal Tissues and Physiology

IGF-1R is ubiquitously expressed in normal tissues and plays an important role in growth and development and various organs’ physiological functions including the cardiac and neurological systems. In addition, IGF-1R and IGF-I are also involved in glucose homeostasis, probably through the feedback downregulation of HGH by circulating IGF-I and the local effect of IGF-I on IGF-1R in muscles or kidneys to promote glucose uptake.7,8


IGF-1R in Cancer

In vitro and in vivo studies have implicated IGF-1R and IGF-I/II signaling in cancer development, maintenance, and progression. IGF-1R expression is critical for anchorage-independent growth, a well-recognized property of malignant cells. IGF-I and IGF-II are strong mitogens for a wide variety of cancer cell lines including prostate,9 breast,10, 11, 12, 13 colon,14,15 and myeloma.16 High circulating levels of IGF-I have been associated with an increased risk of breast, prostate, and colon cancer.1 IGF-1R signaling regulates a number of cellular processes including proliferation, apoptosis, and motility. Furthermore, the IGF/IGF-1R pathway has extensive cross talk with the estrogen receptor (ER), epidermal growth factor receptor (EGFR), and human epidermal growth factor receptor 2 (HER-2) signaling and plays an important role in the resistance mechanisms of cytotoxic drugs and EGFR/HER-2-targeted agents.17


TABLE 30.1 Monoclonal antibodies IGF-1R or IGF (status as of 7/09) in clinical trials


Target


Agent name


Sponsor


Status


Class


Phase 2 dose


Dose intensity (dose/wk)


Average t1/2


IGF-1R


IMC-A1229,321


ImClone


Phase 2


IgG1


6 mg/kg qwk
10 mg/kg q2wk


5-6 mg/kg


8-9 d


IGF-1R


CP-751,871 (figitumumab)26, 27, 28


Pfizer


Phase 3


IgG2


20 mg/kg q3wk


6.7 mg/kg


12 d


IGF-1R


MK-0646 (h7C10)33,322


Pierre Fabre and Merck


Phase 3


IgG1


10 mg/kg q2wk


5 mg/kg


4 d


IGF-1R


AMG 47932


Amgen


Phase 2


IgG1


18 mg/kg q3wk


6 mg/kg


7-11 d


IGF-1R


R150730


Roche


Phase 2


IgG1


9 mg/kg qwk


9 mg/kg


8 d


IGF-1R


SCH 717454 (19D12)35


Schering Plough


Phase 2


IgG1


NA


NA


NA


IGF-1R


AVE1642 (EM164)31


ImmunoGen/Sanofi


Phase 2


IgG1


8 mg/kg q4wk
12 mg/kg q3wk


2-3 mg/kg


9 d


IGF-1R


BIIB022323,324


Biogen-IDEC


Phase 1


IgG4


NA


NA


NA


IGF-I and IGF-II


MEDI-573325,326


MedImmune


Phase 1


IgG2


NA


NA


NA


t1/2, half life; qwk, every week; q2wk, every 2 weeks; q3wk, every 3 weeks; q4wk, every 4 weeks; NA, not available.


Positive expression of IGF-1R is observed in most solid tumors and hematological malignancies examined to date, and IGF-II overexpression, IGF-BP modulations, and IGF-2R downregulation have also been seen in cancer cells.6,18,19 However, unlike other growth factor receptors such as EGFR and HER-2, activation mutations of the IGF-1R gene have not been reported, and gene amplification is extremely rare in the tumors that have been tested.20 Several genetic abnormalities can lead indirectly to IGF-1R-IGF overexpression and signaling. For example, in Ewing’s sarcoma (EWS), the EWS/friend leukemia integration-1 (FLI-1) translocation product was found to interact with the IGF-BP3 promoter and repress its expression. IGF-1R is required for transformation by the EWS/FLI-1 fusion protein. Some tumor types, including hepatocellular carcinoma (HCC) and breast cancer, have been associated with deletion or loss of heterozygosity (LOH) of IGF-2R gene.21 Loss of imprinting of the IGF-II (loss of methylation resulting in bi-allelic expression), first described in Wilms’ tumor, has later been identified in adult tumors and is associated with an increased risk of colon cancer.22,23 These genetic changes may increase IGF-II production or IGF-II bioavailability for IGF-1R signaling.


IGF/IGF-1R Pathway Inhibitors

Several approaches to inhibit the IGF-1R signaling have been investigated. Agents in current clinical development belong to three main classes (Tables 30-1 and 30-2): 1) mAbs against IGF-1R, 2)
mAbs against the ligand (IGF-I and II), and 3) IGF-1R TKIs. Clinical data are available for IGF-1R mAbs and TKIs.


TABLE 30.2 Small molecule tyrosine kinase inhibitors against IGF-1R


IC50 (μM) against


Agent


Sponsor


Class (route)


IGF-1R


InR


Othera


Status


OSI-90639,40


OSI


TKI (oral)
ATP-competitive


0.018


0.054


None


Phase 1


BMS-754807327


BMS


TKI (oral)
ATP-competitive


<2 nM


<2 nM


11 other kinases <100 nM


Phase 1


BVP 51004328


Biovitrum


Small molecule (oral)
Non ATP-competitive


0.038 μM


No effect


None


Phase 1


XL228329


Exelixis


TKI (IV)
ATP-competitive


1.6 nM (cellular)


NA*


  • Bcr-abl: 5 nM


  • Bcr-abl T315I: 1.4 nM


  • Src: 6.1 nM


  • Aurora A: 3.1 nM


  • LYN: 2 nM (all cellular)


Phase 1


INSM-18 (NDGA)330,331


Insmed


Phenolic compound isolated from creosote bush Larrea divaricatta


31 μM (cellular)


NA*


HER-2: 15 μM (cellular)


Phase 1


* Not available.

a Targets for which IC50 is <50-fold of the IC50 for IGF-1R.


IC50, half maximal inhibitory concentration; IV, intravenous; NDGA, Nordihydroguaiaretic acid.


These IGF-IGF-1R-targeting agents share common effects on IGF/IGF-1R signaling but differ in mechanisms of action, spectrum of target inhibition, and pharmacological features (Table 30-3). For example, anti-IGF-1R mAbs only block signaling through the IGF-1R and IGF-1R/IR hybrid, while the IGF-I/II-neutralizing mAb prevents IGF signaling through both homodimers and heterodimers of IGF-1R and IR-A, but spares insulin signaling. Due to the high homology between IGF-1R and IR, IGF-1R TKIs can
potentially block all receptors responsible for IGF/insulin signaling. The differing spectrum of target blockade may potentially translate into different toxicity and/or activity profiles.


TABLE 30.3 Main features of mAbs and small molecule TKIs against the IGF/IGF-1R pathway


mAb against IGF-1R


mAb against IGF-I and II


Small molecule TKI


Mechanism of action


  • Block IGF-1R from ligand binding


  • Receptor degradation of IGF-1R homodimer and IGF-1R/IR hybrid


  • Possible ADCC (if IgG1)


  • Neutralizing ligand from binding to IGF-1R and IR-A


  • Kinase inhibition intracellular – (also inhibit ligand-independent activation, if relevant)


Signaling affected


  • Specific


  • Inhibit signaling of:


    – IGF-1R


    – IGF-1R/IR-A hybrid


  • No effect on IR-A or IR-B


  • Specific


  • Inhibit IGF-I or IGF-II signaling through


    – IGF-1R


    – IGF-1R/IRA


    – IRA


  • No effect on Insulin signaling


  • Less specific


  • Inhibit signaling of RTKs (by any ligands):


    – IGF-1R


    – IGF-1R/IR


    – InR (to a lesser degree than for IGF-1R)


  • May inhibit targets beyond IGF-1R and IR (XL228; INSM-18)


PK


  • Long t1/2 (days to weeks)


  • PK interaction less likely in combination regimens


  • Poor CNS uptake


  • Long t1/2 (days to weeks)


  • PK interaction less likely in combination regimens


  • Poor CNS uptake


  • Short t1/2 (hours)


mAbs, monoclonal antibodies; TKIs, tyrosine kinase inhibitors; ADCC, antibody-dependent cell-mediated cytotoxicity; RTKs, receptor tyrosine kinases; PK, pharmacokinetics; t1/2, half-life; CNS, central nervous system.


Anti-IGF-1R Monoclonal Antibodies

At least eight human or humanized anti-IGF-1R mAbs are in clinical development, from phase 1 to phase 3 (Table 30-1). Treatment regimens being explored include monotherapy, combination with standard chemotherapies, and combination with other moleculartargeting agents. Table 30-1 depicts Immunoglobulin G (IgG) subclasses, stages in development, and average elimination half-lives (t½). Since these mAbs’ major mechanism of actions and pharmacokinetic (PK) features are similar, they are to be discussed as a group with selected examples.

These antibodies are highly specific to the target (IGF-1R) and do not bind IR. Although each antibody (Ab) may be unique in its epitope, common mechanisms of action include blockade of receptor from ligand binding and internalization/degradation of IGF-1R.24 In addition, administration of anti-IGF-1R mAbs has also been shown to down-regulate the IGF-1R/IR hybrid receptor.25 Most of the anti-IGF-1R mAbs are IgG1, except CP-751,871 (figitumumab) (IgG2), and BIB022 (IgG4). A potential mechanism of action of IgG1 is antibody-dependent cytotoxicity (ADCC); however, it is not known whether this is relevant to the anti-IGF-1R mAbs’ antitumor activity patients.


Phase 1 Trials of Anti-IGF-1R mAbs

Phase 1 dose escalation trials with various anti-IGF-1R mAbs have been carried out using weekly, every 2-week (q2wk), every 3-week (q3wk), or every 4-week (q4wk) schedules. Various anti-IGF-1R mAbs’ PK features are similar and consistent with humanized or human mAbs against other targets. For example, in the first-inhuman phase 1 trial of CP751,871,26 the agent was given q3wk at escalating dose levels from 0.025 to 20 mg/kg. The plasma concentration and the area under the curve (AUC) increased proportionally at dose levels beyond 1.5 mg/kg, with a t½ of 10 to 12 days. The dose levels of 10 and 20 mg/kg q3wk were chosen as the recommended phase 2 doses (RP2Ds) for monotherapy or combination with chemotherapy.27,28 Phase 1 studies with other anti-IGF-1R mAbs have average t½ of about 7 to 9 days although the published data were based on limited number of patients (Table 30-1).29, 30, 31, 32, 33

The anti-IGF-1R mAbs are generally well tolerated as monotherapy. Common treatment-related adverse events (AEs), based on the Common Terminology Criteria for Adverse Events (CTCAE) version 3.0, include hyperglycemia, fatigue, anorexia, nausea, mild infusional reactions and rash. Thrombocytopenia and transaminase elevations may also occur, but their frequency and severity may depend on the clinical setting and prior therapies. Data from a larger number of patients in additional clinical studies are necessary to fully establish these toxicity profiles.

Hyperglycemia is considered the class side effect of all anti-IGF-1R mAbs. This AE is likely due to the blockade of IGF-I/IGF-1R interaction, which normally promotes glucose uptake and has a glucose-lowering effect.7,8 Blockade of IGF-1R also significantly increases circulating HGH, which could lead to gluconeogenesis and hyperglycemia. The compensatory increase in insulin level, on the other hand, may be responsible for maintaining glucose homeostasis in most patients after anti-IGF-1R agents. In most phase 1 trials, which exclude patients with hyperglycemia at baseline (patients with history of diabetes were not excluded), the rate of mild/moderate hyperglycemia (grade 1 to 2) is around 20%, and grade 3 or higher hyperglycemia is very rare.26,28 Risk of hyperglycemia may be increased in patients with history of glucose intolerance or concurrent use of glucocorticoids. In most patients, hyperglycemia can be controlled with oral diabetic medications.

The maximum tolerated doses (MTD) for monotherapy were not reached at the conclusion of the phase 1 trials for all anti-IGF-1R mAbs. Selection of the phase 2 dose was largely based on feasibility, and the target steady-state level was extrapolated from preclinical in vivo tumor models. Table 30-1 lists the recommended phase II doses for monotherapy for different IGF-1R mAbs.


Pharmacodynamic Changes and Preliminary Evidence of Antitumor Activity

Pharmacodynamic changes have been explored in early clinical trials with anti-IGF-1R mAbs. Downregulation of surface IGF-1R in granulocytes and circulating tumor cells has been reported with a number of mAbs, including AMG-47932 and CP-751,871.34 Anti-IGF-1R mAbs also induced a significant increase in HGH and IGF-I and a variable increase in the insulin level.26,27,31,32,35 Decrease in the standardized uptake values of (18)F-fluoro-2-deoxy-Dglucose-positron emission tomography (FDG-PET) has also be observed in anecdotal cases32; however, these observations are too preliminary to provide information on the optimal dosing or correlation with clinical outcomes.

Anti-IGF-1R mAbs have demonstrated evidence of clinical activity in early trials. Most notable were reports of complete or partial responses (CRs or PRs) and prolonged stable disease (SD) in patients with EWS refractory to standard chemotherapies.30,32,36,37 A number of phase 2 trials, including a pivotal registration trial with R1507, are ongoing to define the magnitude of activity with anti-IGF-1R mAbs in chemo-refractory EWS.

PRs and minor responses have also been observed in phase 1 trials in patients with neuroendocrine tumors,38 and prolonged SD was seen in a patient with HCC, thymoma, and prostate cancer, although the clinical benefit in these indications was uncertain. The efficacy of monotherapy is being evaluated in phase 2 studies in a variety of tumor types including adult sarcomas, HCC, prostate cancer, breast cancer, neuroendocrine tumors, and multiple myeloma. A National Cancer Institute (NCI)/Cancer Therapy Evaluation Program (CTEP)-sponsored multistrata oncology trial is also evaluating the activity of an anti-IGF-1R mAb, IMC-A12, in a number of pediatric malignancies such as EWS, rhabdomyosarcoma, osteosarcoma, Wilms’ tumor, and neuroblastoma.


IGF-1R Small Molecule TKIs

Several small molecule TKIs against the IGF-1R are under clinical investigation. Among them, OSI-906 and BMS 754-807 are the most specific, while others also inhibit RTKs beyond the IGF-1R and IR families (Table 30-2).

Because of the high degree of homology between IGF-1R and IR, even the most specific IGF-1R TKIs have some degree of
inhibitory effect on the IR. For example, OSI-906 has a half maximal inhibitory concentration (IC50) of 0.018 μM (micromolar) versus 0.054 μM against the IGF-1R and IR, respectively.39,40 At the clinically relevant doses, this agent is expected to inhibit IGF-1R and IR simultaneously. Coinhibition of IR in addition to IGF-1R could confer therapeutic advantage and potentially increase toxicities. IR signaling by insulin or IGF-II has been implicated in a number of preclinical tumor models,41 and IR overexpression is common in breast cancer.42 Furthermore, when the IGF-1R signaling is disrupted, cells may respond with an increase in IR signaling.43

IGF-1R TKIs have demonstrated extensive antitumor activities in both in vitro and in vivo models as single agents and in combination with chemotherapy or targeted agents such as EGFR, mammalian target of rapamycin (mTOR), and HER2-inhibitors. Because IR inhibition is expected to be associated with toxicities, particularly hyperglycemia, the key question about IGF-1R TKIs is whether a therapeutic window can be achieved in patients.


Clinical Experience with IGF-1R TKIs

Phase 1 results for OSI-906 were reported at the American Society for Clinical Oncology (ASCO) Annual Meeting 200944,45 for two main schedules: continuous oral dosing (once or twice daily without interruption) and intermittent oral dosing (Day 1 to 3 every 14 days). At the dose range of 10 to 450 mg daily, 20 to 70 mg twice daily, or 10 to 450 mg on day 1 to 3 every 14 days, the treatment was well tolerated. Only mild (grade 1) and transient hyperglycemia were observed; one patient at 450 mg daily developed asymptomatic grade 3 hyperglycemia, which lasted for 5 hours.45

OSI-906’s target effect was reflected by a dose-dependent increase in the insulin levels while glucose levels were relatively stable. SD (>12 weeks) was seen in patients with thymic, adrenocortical, and colorectal cancer (CRC). Most interestingly, in the phase 1 trial for the intermittent schedule,44 one of the three patients with adrenocortical carcinoma had a confirmed PR in the primary and multiple lung metastases, while another patient had prolonged SD (32 weeks).

Daily dosing up to 300 mg indicated a linear PK, with median terminal t½ of 2 to 4 hours, AUC from time 0 to infinity (AUC0-inf) of 284 to 10,200 ng·h/mL and a maximum concentration (Cmax) of 76.6 to 1,440 ng/mL.45 At 450 mg in the intermittent schedule, the Cmax was 3.2 μg/mL.44 The plasma concentrations in the phase 1 trials exceeded the “efficacious” concentration (IC50) in the in vitro models (1 μM). Additional data are needed to determine how the preclinical IC50 correlates with biologically and therapeutically relevant exposures in patients. Dose escalations for both schedules are ongoing.


Combination of IGF-1R Inhibitors with Other Anticancer Therapies


Combination of IGF-1R Inhibitors and Chemotherapy

IGF-1R signaling may protect tumor cells from chemotherapy and radiotherapy. Mechanistically, the enhanced activity of the combination of radiation and IGF-1R inhibition has been linked to the inactivation of the PI3K/AKT pathway. Inhibition of IGF-1R concurrently with chemotherapy enhances tumor cell apoptosis in several models, including cisplatin-treated ovarian cell lines,46 gemcitabine-treated pancreatic cancer xenografts,47 and vinorelbine-treated breast and non-small cell lung cancer (NSCLC) xenografts.48

A number of clinical trials have tested combinations of anti-IGF-1R mAbs and standard chemotherapies in multiple tumor types. Data from a randomized phase 2 trial examining carboplatin and paclitaxel with or without CP-751,871 in patients with advanced untreated NSCLC have been reported.28 The combination was feasible at the full dose of CP-751,871 for monotherapy (20 mg/kg q3wk) when administered with the chemotherapy. The rate of grade 3 to 4 hyperglycemia was increased and manageable with routine glucose-lowering medications. In comparison to chemotherapy alone, the addition of CP-751,871 was associated with an increase in the response rate, especially in the subset of patients with squamous cell histology. Two phase 3 confirmatory trials have been begun in NSCLC with chemotherapy and CP-751,871.


Combination with Antiestrogen Therapy

One key growth and survival mechanism of estrogen-dependent tumors is functional cross talk and codependence between the IGF/IGF-1R and ER.17,49,50 IGF enhances the responsiveness of ER to estrogen and may also directly activate the ER. Anti-IGF-1R agents are highly active in estrogen-dependent, tamoxifen-responsive cell lines but generally ineffective in tamoxifen-resistant cells.51 Furthermore, addition of anti-IGF-1R antibodies to tamoxifen enhanced the antitumor activity in T61 and MCF-7 tamoxifen-sensitive breast cancer models.25,51,52

These results support the clinical evaluation of addition of IGF-1R inhibitors to antiestrogen therapies. A number of clinical studies with several anti-IGF-1R mAbs in combination with aromatase inhibitors or estrogen antagonists are ongoing in hormonal therapynaïve and therapy-resistant tumors. Given IRs’ potential role in this cancer, evaluation of IGF-1R TKIs or IGF-I/II neutralizing mAbs would also be interesting.


IGF-1R Blockers and EGFR or HER-2 Inhibitors

IGF-1R signaling has been causally linked to de novo or acquired resistance to trastuzumab (Herceptin) and EGFR-targeting agents in numerous models, including breast cancer, CRC, and glioblastoma.17 The mechanisms of IGF-related resistance to EGFR/HER-2 inhibitors have not been entirely elucidated, but are thought to be mediated through the PI3K/AKT pathway. In vitro and in vivo tumor models have also demonstrated direct interactions and cross talk between IGF-1R, EGFR, and HER-2.17,50,53, 54, 55 In trastuzumab-resistant subclones of HER-2-overexpressing cell lines, unique colocalization of IGF-1R and HER-2 has been described.55,56 Treatment of resistant cells with anti-IGF-1R antibodies or TKIs was shown to inhibit transactivation of HER-2 and restore sensitivity to trastuzumab.17,55,56 Similarly, addition of anti-IGF-1R agents to EGFR TKIs or anti-EGFR antibodies has been shown to prevent, delay, or reverse resistance to these anti-EGFR agents.53,54

Taken together, these results suggest that combined inhibition of IGF-1R and EGFR or HER-2 may be a potentially useful strategy to enhance EGFR- or HER-2-targeting agents’ therapeutic potential. Both anti-IGF-1R mAbs and TKIs (OSI-906) are being tested in combination with erlotinib (OSI-774, Tarceva) in NSCLC. Combinations of anti-IGF-1R and anti-EGFR mAbs [cetuximab (IMC-C225, Erbitux) or panitumumab (ABX-EGF, Vectibex)] are also
ongoing in CRC, NSCLC, and head and neck cancer. In addition, NCI/CTEP is sponsoring randomized phase 2 trials for lapatinib (GSK-57216, Tykerb) with or without IMC-A12 in HER-2-positive (by gene amplification) breast cancer and erlotinib (OSI-774, Tarceva)/gemcitabine with or without IMC-A12 in patients with pancreatic cancer. Results of clinical testing are not yet available.


IGF-1R and mTOR Inhibitors

Treatment with mTOR inhibitors could lead to upregulation of AKT phosphorylation in tumors.57,58 The feedback AKT activation was likely mediated by the IGF/IGF-1R pathway. Although it is not clear whether this AKT activation is related to mTOR inhibitors’ escape/resistance mechanism, combination studies with rapamycin (sirolimus, Rapamune) and IGF-1R inhibitors suggest additive antitumor effects compared to single agents alone.57,58 The most significant synergism in activity was observed in pediatric tumor EWS models and osterosarcoma, where the combination of an anti-IGF-1R mAb and rapamycin led to complete tumor regression, single-agent IGF-1R mAb, and rapamycin only induced modest growth delay.59

A number of proofs of principal clinical studies are ongoing to test the combination of IGF-1R and mTOR inhibitors in selected tumor types including sarcoma, breast, and prostate cancer. A phase 1 trial with IMC-A12 and temsirolimus (CCI-779, Torisel) has reported preliminary data indicating that the combination is feasible,60 although the full safety profile in more patients with longer therapy remains to be established. Phase 1 and phase 2 trials for this combination have also been planned for the pediatric population.


Considerations in Predictive Markers for Sensitivity or Resistance

Preliminary experience with IGF-1R inhibitors indicates that the single-agent clinical benefit would be limited to a subset of tumors and a subset of patients. The potential reasons for de novo or acquired resistance would include absence or biological irrelevance of the intended target (IGF-1R), presence of redundant or compensatory pathways, or constitutively activated downstream effector molecules. Biomarker studies have the potential to elucidate the predictive markers for sensitivity or resistance and to provide guidance for rational combinations.

Currently, no predictive markers for IGF-1R inhibitors are available. In view of the complexity of the IGF-1R and IR family, as well as their extensive interaction with several other signal transduction pathways, it may be difficult to identify a uniform set of predictive markers for all tumor types and molecular contexts, and for all classes of the IGF/IGF-1R inhibitors. Biomarker studies are focusing on the following areas:


  • Tumor genomic alternations within the IGF-1R axis;


  • Genetic alterations outside the IGF-1R axis that may affect the IGF-1R signaling (e.g., chromosomal translocations resulting in transcriptional modulations of the IGF-ligand or receptors);


  • Level and phosphorylation status of IGF-1R and IR;


  • Bioavailability of the ligand (including IGFBP3, IGF-I/II, and decoy receptor IGF-2R);


  • Activation mutations of the downstream molecules such as AKT, PI3K, RAS, and RAF; markers related to parallel pathways such as EGFR and vascular endothelial growth factor (VEGF); and


  • Markers related to epithelial-mesenchymal transition.


The PI3K/AKT/mTOR Signaling System


Overview

The PI3K/AKT/mTOR pathway is a cellular growth and survival pathway that is activated in a wide variety of human cancers. PI3K can be activated by tyrosine kinase growth factor receptors, integrins and other cell adhesion molecules, G-protein-coupled receptors, and intermediary proteins such as RAS61 (Fig. 30-2). Activated tyrosine kinases recruit class Ia PI3K through binding of the Src-homology 2 (SH2) domain of the p85-regulatory subunit of PI3K to specific phosphotyrosine (YxxM) components of the signaling complex.61,62 Activated PI3K causes phosphorylation of the D3 position of phosphoinositides to generate phosphatidylinositol-3,4,5-triphosphate (PIP3). PIP3 binds to the pleckstrin homology (PH) domain of the PH domain-containing kinase (PDK1) and the serine/threonine kinase AKT, anchoring both proteins to the cell membrane, leading to their activation. AKT1 is activated by phosphorylation of T308, in its catalytic domain, by PDK1 and then by subsequent phosphorylation of S473 by several kinases [including mTOR when bound to the rapamycin-insensitive companion of mTOR (Rictor) in the target of rapamycin complex 2 (TORC2)].63,64 AKT is expressed in three different isoforms: AKT1, AKT2 and AKT3, which are variably expressed in most tissues and tumors.65

The membrane translocation and activation of AKT are opposed by the tumor suppressor phosphatase and tensin homolog on chromosome 10 (PTEN). PTEN is a phosphatase that antagonizes PI3K by dephosphorylating PIP3, preventing activation of AKT and PDK-1.66 Once activated, AKT phosphorylates the consensus sequence RXRXX(S/T) in many downstream targets,67 leading to alterations in the expression of proteins important in cell-cycle progression, apoptosis, angiogenesis, cytoskeletal arrangement, and the regulation of ribonucleic acid (RNA) transcription and protein translation.

While AKT is undoubtedly a critical substrate of activated PI3K, the inhibition of PI3K also diminishes Rac activation and
other important downstream targets. Phosphoprotein profiling and functional genomic studies demonstrate that many cancer cell lines and human breast tumors with mutations of the catalytic (p110α) subunit of PI3K (PI3KCA) have only minimal AKT activation and little requirement of AKT for anchorage-independent growth.68 These cells, instead, are characterized by robust PDK1 activation and have dependency on the PDK1 substrate serum/glucocorticoid regulated kinase 3 (SGK3). SGK3 undergoes PI3K- and PDK1-dependent activation in PIK3CA-mutant cancer cells. Therefore, PI3K activation may promote cancer through both AKT-dependent and -independent mechanisms, with important implications for the treatment of patients with these tumors.


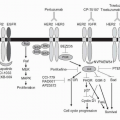
FIGURE 30-2 Activation of integrin receptors, growth factor receptors, and cytokine receptors activates the PI3K/AKT signaling pathway, leading to the activation of the mTOR (part of the mTORC1 complex). Activation of mTORC1 leads to the phosphorylation of S6K1 and 4E-BP1. S6K1 phosphorylates rpS6, while phosphorylated 4E-BP1 dissociates from eIF-4E. Both rpS6 and eIF-4E promote mRNA transcription and protein translation, leading to cell growth and proliferation, angiogenesis, and the prevention of apoptosis. mTOR inhibitors, such as temsirolimus, bind to FK506-binding protein (FKBP) and inhibit the kinase activity of the mTORC1 complex. (Please see Color Insert.)

Cell-cycle progression is influenced by AKT through inhibitory phosphorylation of the cyclin-dependent kinase inhibitors p21 and p27 and by the inhibition of glycogen synthase kinase 3β (GSK3β), which stabilizes cyclin D1.69,70 AKT regulates apoptosis by inactivating the proapoptotic protein BAD, which controls the release of cytochrome c from mitochondria.71,72 AKT phosphorylation of the FoxO family of transcription factors inhibits transcription of the proapoptotic genes Bim, Fas-L, and IGFBP-1.73,74 AKT also phosphorylates IκB kinase (IKK), which increases the activity of nuclear factor-κB (NF-κB) and the transcription of prosurvival genes.75 AKT phosphorylation of the human homologue of mouse double minute 2 (MDM2) leads to inhibition of p53, with effects on cell-cycle progression, apoptosis, and DNA repair.76

mTOR is a highly conserved 250-kD phosphoprotein, which is a critical convergence point in cellular signaling pathways for cell growth, metabolism, and proliferation.77 mTOR is a serine/
threonine protein kinase, which acts to control protein translation in response to nutrients, hypoxia, energy levels, hormones, and growth factors, all modulated through the PI3K/AKT pathway. AKT can directly activate mTOR through phosphorylation but also causes indirect activation of mTOR by inhibitory phosphorylation of tuberous sclerosis complex 2 (TSC2). TSC2 inhibits mTOR through the guanosine triphosphate (GTP)-binding protein, Ras homolog enriched in brain (Rheb). Inhibitory phosphorylation of TSC2 by AKT results in conversion of Rheb to an active form that phosphorylates and activates mTOR. mTOR exists in two complexes: target of rapamycin complex 1 (TORC1) of mTOR, which is bound to the regulatory-associated protein of mTOR (Raptor), and the TORC2 complex, in which mTOR is bound to Rictor. The TORC1 complex includes a novel component, proline-rich AKT substrate (PRAS40), and TORC2 includes the proteins stress-activated map kinase-interacting protein 1 (SIN1) and proline-rich protein 5 (PRR5).78 PRAS40 acts as an inhibitor of mTOR kinase activity in a phosphorylation-dependent manner.77

Activation of mTORC1 regulates cellular growth and proliferation through control of protein synthesis.79 Components of this regulation include initiation of messenger RNA (mRNA) translation, organization of the actin cytoskeleton, ribosome biogenesis, and protein degradation. Phosphorylation of S6 kinase 1 (S6K1) at threonine 389 by mTORC1 leads to the subsequent phosphorylation of the ribosomal protein S6, eukaryotic initiation factor (eIF-4B), and eukaryotic elongation factor (eEF) 2 protein kinase, with critical effects on cellular protein translation.80 The mTORC1 complex also phosphorylates 4E-binding protein 1 (4E-BP1), a translational repressor, causing 4E-BP1 to dissociate from eIF-4E, which is an mRNA cap-binding protein.81 After dissociation from 4E-BP1, eIF-4E can then promote the translation of 5′-cap mRNA species, including cyclin D1, c-Myc, HIF-1α, and VEGF.82

The TORC2 complex can phosphorylate and activate AKT at serine 473 in a positive feedback mechanism.64 However, TORC1 activation of S6K1 can inhibit the activation of AKT through a negative feedback mechanism, by catalyzing an inhibitory phosphorylation of IRS1 with resultant decreased activation of PI3K.83

The activity of mTOR is also regulated through a cellular energy-sensing pathway, sensitive to cellular levels of amino acids and adenosine triphosphate (ATP), and by the tumor suppressor protein LKB1, which is inactivated in Peutz-Jeghers syndrome.83 LKB1 activates adenosine monophosphate (AMP)-activated kinase, which subsequently activates TSC1/2, thereby leading to mTOR inhibition.


Deregulation of the AKT Pathway in Human Cancer

The PI3k/AKT/mTOR pathway can be activated in cancer by loss of the tumor suppressor PTEN function, amplification or activating mutation of PI3K, amplification or mutation of AKT, or activation of upstream growth factor receptors (Table 30-4). Recent studies also demonstrate that mTOR signaling is inhibited by the p53 tumor suppressor gene, and that loss of p53 function results in mTOR activation.84 Both PTEN phospholipase and PI3K3CA are frequently mutated across many human cancers.68 PTEN mutations occur commonly in prostate cancer, renal cell cancer (RCC), HCC, melanoma, endometrial cancer, and glioblastoma. Activating mutations in the PI3KCA gene have been discovered in large numbers of human tumors, including 27% of breast and 19% of colon cancers, according to the Catalogue of Somatic Mutations in Cancer database. Three recurrent oncogenic “hotspot” mutations comprise the majority of somatic PI3KCA mutations.85 Gene mutation in the p85 regulatory domain of PI3K has also been noted in colon and ovarian cancers.86 Amplification of AKT1 has been described in human gastric carcinoma, and amplification of AKT2 has been reported in pancreatic, ovarian, gastric, head and neck, and breast carcinomas.88, 89, 90, 91, 92


TABLE 30.4 Components of the mTOR pathway with evidence of involvement in human cancers


Mutated/overexpressed protein


Types of cancer


PTEN


  • Lung


  • Breast cancer


  • Prostate cancer


  • H&N cancer


  • Glioblastoma


AKT


  • Breast cancer


  • Thyroid


PI3K


  • Breast cancer


  • Endometrium


  • Colon


  • Liver


elf4E


  • H&N squamous carcinoma


  • Renal cancer


  • Lymphoma


TSC1/2


Benign tumor syndrome (hamartoma syndromes, including tuberous sclerosis complex, PTEN-related hamartoma syndromes and Peutz-Jeghers syndrome)


S6K1


Breast cancer


HIFα


  • Renal cancer


  • Breast cancer


  • Prostate cancer


Abnormal activation of the TSC/Rheb/mTOR pathway, through loss of tumor suppressor gene function, has been associated with the pathobiology of tumor predisposition syndromes such as tuberous sclerosis (TSC1/2), Cowden’s syndrome (PTEN), and the Peutz-Jeghers syndrome (LKB1).83 Loss of LKB1 function leads to hyperactivation of mTOR signaling.87

A number of downstream targets of mTOR are activated in human cancer. Overexpression or amplification of S6K1 or eIF-4E, with resultant effects on protein translation, has been associated with oncogenesis in breast, ovarian, and other human cancers.88 Overexpression of eIF-4E has been shown in many human cancers and is linked to tumor progression and poor prognosis.89 In contrast, expression of 4E-BP1 has an antitumorigenic effect, partly mediated through increased expression of the cell-cycle inhibitory protein p27Kip1, and appears to modulate the effect of eIF-4E overexpression.90


Deregulation of the PI3K/AKT/mTOR pathway has been consistently noted to be associated with high-risk or poor prognosis human cancers. PTEN genomic deletion is associated with p-AKT expression and androgen receptor signaling in poorer outcome, hormone-refractory prostate cancer.91


Inhibitors of PI3K/AKT/mTOR Pathway


PI3K Inhibitors

It is not clear whether pan- versus isoform-specific inhibition of PI3K would have the greatest clinical utility in oncology. Inhibitors of all of the isoforms of PI3K effectively inhibit signaling from the great majority of all cell surface receptors and have pleiotropic effects on cell proliferation, apoptosis, angiogenesis, migration, and metastasis. The pharmacologic agents wortmannin and LY294002 are potent inhibitors of PI3KCA, but in vivo toxicity and poor solubility have prevented clinical development.92, 93, 94

LY294002 is an ATP-competitive pan-PI3K inhibitor that blocks all classes of PI3K at low μM concentrations.95 Extensive preclinical evaluation demonstrates potent activity of LY294002 on cancer cells and on the tumor microenvironment. Wortmannin has been extensively tested with a variety of cytotoxic anticancer drugs, and it broadly increases apoptosis and inhibition of AKT in a wide variety of in vitro and in vivo cancer models.96 While LY294002 and wortmannin are not suitable for human trials, a variety of PI3K inhibitors are in clinical trials, including SF1126, BEZ235, XL147, and TG100-115. SF1126 is an RGDS-conjugated prodrug of LY294002.95 NVPBEZ235 is a combined pan-PI3K/mTOR inhibitor, currently being tested in phase 1 and phase 2 trials of solid tumor patients.97,98 TG100-115 is a p110γ/δ specific inhibitor of PI3K that has been demonstrated to reduce vascular permeability.99


PDK1 Inhibitors

PDK1 activates AKT through specific phosphorylation at Ser473 and Thr308 and has non-AKT-mediated mechanisms to promote the growth of cancer cells, leading to interest in PDK1 inhibitors.68 UCN-01 (7-hydroxystaurosporine), a protein kinase C (PKC) inhibitor isolated from Streptomyces, is also a potent PDK1 inhibitor, and the subsequent inhibition of AKT is associated with apoptosis in cancer cells.100 UCN-01 has had extensive clinical evaluation, but its toxicity and very long t½ have limited development of the agent.101 Newer PDK1 inhibitors, such as BX-795, BX-912, and BX-320, inhibit binding to the ATP-binding pocket of the catalytic domain of PDK1 and have potent inhibition of PDK1 and AKT activation in xenograft models.102


AKT Kinase Inhibitors


Perifosine (KRX-0401)

Perifosine is an orally bioavailable alkylphospholipid that interacts with the PH domain of AKT to prevent its translocation to the plasma membrane and subsequent activation.103 Perifosine has demonstrated in vitro inhibition of the growth of breast, prostate, colon, and lung cancer cells, and potentiation of doxorubicin, etoposide, temozolomide (SCH52365, Temodar), and radiation therapy in cancer cell models.104, 105, 106 Perifosine has been studied in phase 1 and 2 clinical trials, but limited data exist on its ability to inhibit AKT in clinical samples from these trials.107


TCN-P (tricirabine)

TCN-P, also known as AKT/PKB signaling inhibitor 2 (API-2), is a tricyclic nucleoside that was initially shown to have antitumor activity in human clinical trials and later identified as an AKT inhibitor.108 TCN-P was found to inhibit the growth of AKT2-transformed NIH3T3 cells, but not parental cells, and to selectively inhibit phosphorylation of AKT2.109 TCN-P induced apoptosis in a number of cancer cell lines and inhibited the growth of xenograft tumors overexpressing AKT2 in nude mice. TCN-P has multiple toxicities including hyperglycemia, hepatotoxicity, hypertriglyceridemia, and thrombocytopenia, which have limited its clinical development.108


MK-2206

MK-2206 is an orally active, allosteric AKT inhibitor that inhibits all three AKT species in vitro.110 The drug causes aggregation of the PH domain of AKT to the catalytic subunit, preventing membrane localization and activation of the protein. MK-2206 is highly selective and has inhibited tumor growth in several xenograft models, including A2780 human ovarian cancer, LNCaP human prostate cancer, and a spontaneous murine prostate tumor induced by organ-specific conditional PTEN knockout. MK-2206 caused complete tumor regressions of A2780 xenograft tumors when given on a weekly schedule following docetaxel. A phase 1 trial was completed, and MK-2206 was found to have a MTD of 60 mg orally every other day, with higher doses limited by rash.111 The drug has also been associated with hyperinsulinemia and hyperglycemia, which represent pharmacodynamic effects, and have not been dose limiting. Phase 1 results have shown prolonged SD and minor antitumor effects, but no Response Evaluation Criteria in Solid Tumors (RECIST) responses to date. Evidence of potent inhibition of phosphorylated AKT by MK-2206, from pre- and posttreatment biopsies, has been seen in patients on the phase 1 trial.


mTOR inhibitors


Rapamycin (sirolimus, Rapamune)

Rapamycin is a macrolide antibiotic derived from the bacteria S. hygroscopicus isolated from a soil sample from Easter Island (Rapa Nui).112 Rapamycin was initially found to have antifungal and immunosuppressive properties. Rapamycin was subsequently found to induce p53-independent apoptosis of rhabdomyosarcoma cell lines and decrease cyclin D1 expression and proliferation in pancreatic cancer cell lines.113,114

Rapamycin’s pharmacologic action is mediated through its binding to the binding protein FK506, with subsequent inhibition of mTOR.114 Researchers observed that rapamycin inhibited mTOR-mediated p70s6K and 4E-BP-1 phosphorylation; this suggested its antitumor effects were due to regulation of protein translation dependent on these targets. Rapamycin’s effect on inhibiting cell cycling at the G1/S-phase transition point is related to the drug’s effect on cyclin-dependent kinase activation and retinoblastoma protein phosphorylation, as well as on the accelerated cyclin D1 turnover and an increased association of p27kip1 with cyclin E/cdk2.115 Prolonged exposure to rapamycin may also lead to tissue-specific AKT inhibition, through depletion of mTORC2, which normally activates AKT.116

Poor aqueous solubility and chemical instability have limited the development of rapamycin as an intravenous (IV) anticancer drug.
It is currently being tested in oral formulations in several early phase trials in various cancers in daily and weekly dosing schedules.117


Temsirolimus (CCI-779, Torisel)

Temsirolimus is an ester analog of rapamycin that was developed by NCI in collaboration with Wyeth Ayerst due to favorable in vitro and in vivo efficacy and toxicity data. Temsirolimus was found to have a mechanism of action similar to rapamycin, and multiple human tumor cell lines were found to have sensitivity to temsirolimus with IC50 < 10−8 M.118 In vivo animal xenograft models demonstrated that temsirolimus induced significant tumor growth inhibition, using several intermittent dosing regimens. The efficacy of intermittent dosing with temsirolimus is of interest since the immunosuppressive effects of the drug resolve within 24 hours after dosing.

Early phase clinical trials with temsirolimus demonstrated prolonged SD and occasional tumor responses, particularly in RCC. Its toxicity included rash, mucositis, thrombocytopenia, hypertriglyceridemia, nausea, anorexia, edema, fatigue, and hypercholesterolemia.119 The FDA approved temsirolimus for refractory RCC based on a phase 3 study of 626 patients who received either temsirolimus alone (25 mg IV weekly), interferon alpha alone, or a combination of the two agents.120 Patients treated with temsirolimus had an improved median survival of 10.9 months compared to patients treated with interferon alpha, who had a median survival of 7.3 months (P = 0.008). Patients treated with the combination of agents survived a median of 8.4 months; therefore, combination therapy is not recommended.

Temsirolimus has demonstrated activity in mantle cell lymphoma, other B-cell lymphomas, breast cancer, endometrial cancer, and neuroendocrine cancers. In a phase 2 trial of metastatic or recurrent endometrial cancer, 5 of 19 evaluable patients (26%) had an objective response to 25 mg/week of temsirolimus, and 12 (63%) demonstrated SD.121 Dose escalation above 25 mg IV weekly of temsirolimus has not been associated with improved clinical benefit, except in one Wyeth-sponsored phase 3 trial in mantle cell lymphoma, in which maintenance with 75 mg IV weekly was found to lead to improved progression-free survival (PFS).120 More than 60 clinical trials are ongoing with temsirolimus, including 5 phase 3 trials. Temsirolimus in combination with cytotoxic chemotherapy frequently leads to significant problems with mucositis and other toxicity, but temsirolimus has been successfully combined with carboplatin and paclitaxel, at a modified dose of 25 mg IV Days 1 and 8 of a 3-week schedule, with promising activity in patients with refractory solid tumors.122


Everolimus (RAD001, Afinitor)

Everolimus is a hydroxyethyl ester of rapamycin developed for transplant and anticancer applications. Everolimus is rapidly absorbed after oral administration, and with a t½ of approximately 30 hours, can be given on a daily schedule.123,124 The FDA approved everolimus for relapsed advanced RCC based on results from the phase 3 RECORD-1 trial, in which treatment with everolimus more than doubled the time to progression relative to placebo (4.0 versus 1.9 months), and reduced the risk of disease progression by 70%.125 Patients in the control arm were allowed to cross over to the everolimus arm upon disease progression.

May 27, 2016 | Posted by in ONCOLOGY | Comments Off on Signaling Inhibitors: IGFR, PI3K Pathway, Embryonic Signaling Inhibitors, and Mitotic Kinase Inhibitors

Full access? Get Clinical Tree
Get Clinical Tree app for offline access