Ultrasonography, or ultrasound (US), utilizes high-frequency sound waves to noninvasively interrogate structures within a body. The production of ultrasonographic images is based on transmission and reception of physical sound waves through a physical medium, both using a handheld transducer. A typical transducer converts electric pulses into sound waves ranging from 2 to 16 MHz using a piezoelectric material. The speed of sound in different tissues varies but is generally more than five times that in air. The time of flight of the sound wave to be received back to the transducer is used to determine the depth of an object. The amount of reflected signal is a function of the angle of incidence and the difference between the acoustic impedance of tissue on either side of an interface. The received echo signals are detected and interpreted into luminance to form an image with depth perception.
The spatial resolution in US has two distinct, axial and lateral, components. The axial resolution is defined as the ability to discern two objects that lie on top of one another. It is dependent on the length of the transmitted signal. The lateral resolution is the ability to discriminate between two adjacent objects, and is determined by the transducer beam width.
Variations in US techniques have been developed to tailor-specific applications. Tissue harmonic imaging refers to the use of the second (and higher) fundamental frequencies to improve the generated images by reducing artifacts and scatters particularly in the near field. This technique has been shown to improve lesion conspicuity in “difficult-to-scan” regions and obese patients.
Contrast-enhanced US utilizes microbubble contrast agents to visualize tissue perfusion, most commonly and successfully in evaluation of hepatic lesions. The principle is analogous to using intravenous contrasts in cross-sectional imaging, as is the ability to obtain multiphasic images.1 Contrast-enhanced US can be performed in conjunction with gray scale and Doppler examination in transabdominal and endoscopic settings. The first-generation air-based microbubble contrast agents had relatively short half-lives and rigid shells requiring high US output. The second-generation agents, which typically consist of more flexible shells filled with fluorinated hydrocarbons or sulfur hexafluoride, are able to provide real-time visualization of enhancement patterns of various benign and malignant lesions2 with a lower US output power.
A specialized US application that is particularly relevant in hepatobiliary imaging is endoscopic ultrasonography (EUS). EUS permits proximity of the transducer (typically 7.5 to 10 MHz) to improve visualization of deep and small organs such as pancreas and duodenal wall as well as the biliary and pancreatic ductal system.3 Tissue biopsy is also possible via fine aspiration or core needles. Newer therapeutic applications include endoscopic radiofrequency ablation of pancreatic lesions (see Chapter 148). Increasingly, EUS has been utilized to evaluate cystic pancreatic neoplasms and to screen individuals at high risk for pancreatic adenocarcinoma. One of the challenges with endoscopic US is that it is technically difficult to perform and highly operator dependent.
Computed tomography (CT) utilizes conventional x-rays to generate transmission data that are further processed by computer to form two- and three-dimensional (2D and 3D, respectively) images. Technology has evolved rapidly since CT was first introduced clinically in the 1970s. Early scanners used incremental technology in which each image was produced at a given table position. Once the image is reconstructed, the next anatomic slice is obtained by moving the table, and therefore the patient, a predetermined increment. Newer scanners use a helical or spiral approach in which the x-ray source constantly rotates around the patient who is continuously moved (translated) at a constant speed. Data acquisition is uninterrupted, allowing for superior temporal resolution. Postprocessing of the spiral data generates true-axial slices. Since 2002, CT scanners have all been multidetector, with detectors arranged in an array allowing for simultaneous acquisition of multiple slices during one gantry rotation.
Contemporary CT images have high spatial resolution (as compared to MRI and US) at a typical matrix size of 512 × 512 pixels. The field of view divided by the number of pixels determines resolution, which is also known as the pixel (2D) or voxel (3D) size. For example, if a 51.2-cm field of view is selected, then each pixel is 1 mm; if the field of view is 25.6 cm, then the resolution is doubled, with the pixel size decreased to 0.5 mm. Slice thickness is also important. Decreasing the slice thickness improves the overall voxel size and decreases volume averaging, but will also increase the image noise unless radiation dose is properly adjusted.
Rapid volume scanning with multidetector CT also permits high temporal resolution and accurate bolus-tracking of IV contrast to guarantee appropriate arterial phase images. Imaging technique must be carefully optimized based on the clinical scenarios. In selected settings, rapid injection and scanning with bolus intravenous iodinated contrast is necessary to better characterize the arterial and venous vasculature. Many contemporary scanners allow for bolus tracking of the intravenous contrast while acquiring thin (1- to 3mm slice) sections. Precise timing depends on the scanning equipment utilized.
Magnetic resonance (MR) imaging is based on the principles of nuclear magnetic resonance and uses a combination of a strong and homogenous external magnetic field and multiple radiofrequency pulses to generate images with good spatial resolution and outstanding tissue contrast. Certain nuclei have a magnetic spin, which react to a strong external magnetic field by aligning themselves parallel to the field. More nuclei will align in the direction than opposite (antiparallel) to the field, causing an overall net magnetization and subsequently the source of MR signal. Adding a momentary radiofrequency pulse at the precise frequency of the nuclear precession (the Larmor frequency) causes a change in the energy and transition state. The radiofrequency pulse is then turned off, allowing the nuclei in the body to return to equilibrium and consequently emitting a radiofrequency signal (echo). The strength of the echo and the amount of time for the nucleus to return to equilibrium state determine the signal intensity of a tissue. The precise tissue signal intensity depends on several factors, including longitudinal relaxation (T1), transverse relaxation (T2), proton density (nuclear spin), and flow.
T1, also known as longitudinal or spin-lattice relaxation, is the time required for the rotating nuclei to return to 63% of its maximal value at the equilibrium state after the transient radiofrequency pulse. Most tissue T1 values vary between 200 and 800 milliseconds. By convention, tissue with a short T1 value appears hyperintense on T1-weighted images.
T2 relaxation time is also called transverse of spin-spin relaxation. It is a measure of the loss of signal in a plane perpendicular to the long axis of the magnetic field. This loss of signal is due to subtle inhomogeneities in the magnetic field because of the presence of spinning protons. The T2 value is defined as the time for signal to decrease to 63% of its equilibrium value. Most tissue T2 values vary between 50 and 200 milliseconds, and the T2 value can never be longer than the T1 value. By convention, tissues with a long T2 value appear hyperintense on T2-weighted images.
Motion of fluid such as blood plays a major role in the appearance of MR images. In general, blood flow tends to produce spin dephasing, which results in signal loss. However, MR angiography utilizes certain flow-sensitive sequences to produce images in which flowing blood is hyperintense while the background stationary tissue remains relatively dark.
Improvements in MRI equipment and software have resulted in a decrease in the time needed to create an image. State-of-the-art scanning equipment may create an image in less than 1 second. Specialized surface coils, local antennas used to receive the resonance signal, are now used to obtain images with higher spatial resolution. Fast techniques can produce images with T1 or T2 weighting. Gradient-recalled echo techniques can produce high-quality T1-weighted images covering the entire liver in less than 20 seconds of scan time. This fast scanning permits breath-hold imaging and allows for dynamic contrast administration for evaluation of liver. New techniques using a half-Fourier acquisition of slightly more than 50% of the data (the computer reconstructs the remaining data set) allow sub-second T2-weighted images with fewer artifacts than echo-planar imaging.
Diffusion-weighted imaging (DWI) is a MR method that produces images weighted with tissue local environment, and has been increasingly used to identify and characterize various tumors4–7 as well as in early strokes. DWI utilizes the random motion of water molecules in the body.8 The movement of water molecules in biologic tissues is variably restricted because their motion is modified and limited by interactions with cell membranes and macromolecules. Areas of restricted water diffusion, for example, in highly cellular tissue demonstrate a typical low apparent diffusion characteristic (ADC) while areas of unrestricted water diffusion have a high ADC9 value. Each image voxel has an image intensity that reflects a single best measurement of the rate of diffusion of water molecules at that location. Therefore, DWI may be characterized as a prototypical MR technique that incorporates the new paradigm of molecular—in addition to anatomical—imaging.
Magnetic resonance cholangiopancreatography (MRCP) is a noninvasive method to image the biliary tree. The main diagnostic sequence of MRCP is a thick-slab, heavily T2-weighted sequence. Alternatively or additionally, a 3D approach with respiratory triggering can be used to reduce partial averaging artifacts at the expense of longer imaging time. MRCP can be performed in conjunction with secretin. Secretin is a 27-amino acid polypeptide hormone secreted by the duodenal mucosa in response to increase in luminal acidity. Secretin stimulates a bicarbonate-rich alkaline secretion from the exocrine pancreas and transiently increases the tone of the sphincter of Oddi. Four to 10 minutes after secretin administration, distension of pancreatic duct occurs. Consequently, the pancreatic ductal anatomy, including abnormalities such as stenosis, fistula, and ductal disruption, can be better delineated.
Anatomical imaging is the cornerstone of conventional imaging techniques starting from radiography. Anatomical imaging has revolutionized medicine, allowing rapid and accurate depiction of internal structures noninvasively. There have been many iterations and technical advances since the first medical use of x-ray in 1896. However, its general concept remains largely unchanged. Anatomical imaging is predominantly based on visual description and quantitation (1D or 2D until recently; 3D is a relatively new phenomenon10) of abnormalities deviated from the normal anatomy. Increasingly, anatomical imaging has been criticized for not adequately reflecting the biology and chemistry, particularly of tumors.
Molecular imaging may be defined as visualization of biological processes and can start to address these shortcomings. The terms “functional” or “molecular” imaging may be relatively new, but the idea of imaging functions rather than anatomy is hardly novel. Many nuclear medicine examinations were designed to evaluate functions, for example, pulmonary ventilation and perfusion scans, to detect pulmonary emboli, hepatobiliary scintigraphy for diagnosing cholecystitis, brain perfusion for classifying dementias, and dynamic renal scintigraphy for obstructive uropathy. Most of these examinations utilize radionuclides that emit one photon per disintegration, which have limited spatial resolution. Over the last two decades, application of positron emitting radionuclides (which allow subsequent emission of two photons of high energy at precisely opposite directions) in imaging has substantiated into positron emission tomography (PET). Furthermore, contemporary PET imaging is performed in conjunction with CT (PET-CT) or MR (PET-MR); consequently, the spatial localization has tremendously improved.
One of the most clinically applied example of molecular imaging is PET using 2-[fluorine-18]fluoro-2-deoxy-d -glucose (FDG). FDG is an analogue of glucose, with the hydroxyl group at the 2-position replaced by a positron emitting radionuclide fluorine-18. Like glucose, FDG is transported into cells and phosphorylated by hexokinase at its 6-position and is trapped intracellularly. Unlike glucose-6-phosphate, FDG-6-phosphate, cannot be further metabolized down the glycolytic pathway and is therefore chemically stable prior to positron decay. FDG detects increased glucose accumulation that is seen in many types of malignancies and has been increasingly used in clinical practice since the 1980s.
In addition to FDG, other positron emitting compounds have been utilized in clinical and clinical research settings to image a wide variety of molecular events, including DNA synthesis, fatty acid metabolism, steroid metabolism, hypoxia, amyloid deposition, somatostatin receptor density, and dopaminergic deficits.
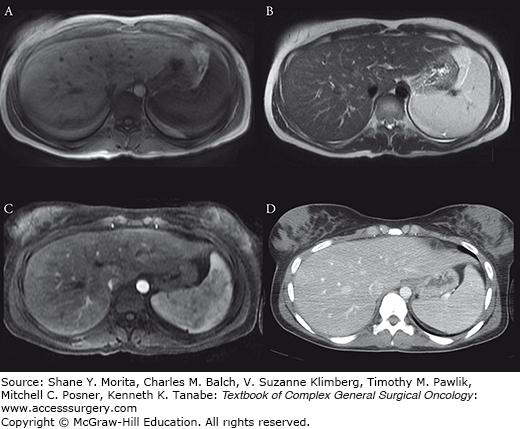
On US, normal liver is isoechoic to slightly hypoechoic as compared to spleen. In addition to routine evaluation of the parenchyma, and portal and hepatic vasculature, evaluation of the liver surface should also be performed with a particular focus on micro- and macronodular formations. On CT, the liver typically has a precontrast attenuation between 40 and 70 Hounsfield units. Normal liver (Fig. 123-1) enhances homogenously after administration of intravenous contrast, with maximal enhancement typically occurring between 45 and 60 seconds. On MR, normal liver is T1 hyperintense as compared with the spleen. Depending on the specific technique applied, the vessels may be hypointense (spin-echo) or hyperintense (gradient-echo). On T2-weighted images, the liver is relatively hypointense as compared with the spleen. Many hepatic lesions demonstrate decreased intensity on T1 images but may be of variable intensity on T2-weighthed images depending on the water content.
FIGURE 123-1:
Normal liver is hyperintense to spleen on T1-weighted (A) and hypointense on T2-weighted (B) images. Liver enhances less than spleen in early phase (C) because of the dual (predominantly portal venous) blood supply. Maximum enhancement typically occur between 45 to 60 seconds. CT portovenous phase (D) demonstrates homogenous enhancement similar to the spleen.
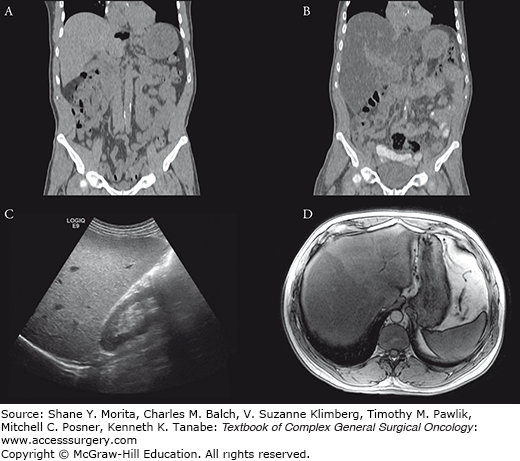
Fat accumulates within hepatocytes (Fig. 123-2) in various etiologies, including alcohol abuse, diabetes, drugs, and obesity. Fatty changes may be diffuse, patchy, or focal. The pattern of fatty infiltration is primarily related to perfusion. With CT, it is frequently difficult to distinguish fatty infiltration from focal low-attenuation hepatic lesions, and focal fat sparing may mimic vascular neoplasms on contrast-enhanced CT. Differentiation of these entities is more straightforward with MR. On T1-weighted images, fat is hyperintense because it has short T1 relaxation. On T2-weighted images, the signal intensity of fat is more variable, from isointense (spin-echo, which has low sensitivity to presence of fat), to hyperintense (fast T2 techniques), to hypointense (chemically selective fat suppression). Chemical shift imaging is a more sensitive technique to identify fatty infiltration. Chemical shift imaging, as the name implies, relies on the different resonant frequencies in protons present in fat (hydrocarbons) as compared with water (hydroxyl groups). Using fast imaging sequences, the signal emanating from fat and water may cancel other out, thus appearing hypointense (Fig. 123-2D). Focal fatty infiltration does not enhance after gadolinium administration.
FIGURE 123-2:
A 59-year-old man with metastatic pancreatic cancer underwent prechemotherapy CT (A), which demonstrated a liver with normal attenuation. After completion of chemotherapy, CT (B) revealed increase in size of the liver with interval development of diffuse hypoattenuation consistent with hepatic steatosis. Note also decrease in subcutaneous and intraperitoneal adipose tissue as well as size of muscles; patient had significant weight loss in the interim. US demonstrated marked increase in hepatic echogenicity as compared with the renal cortex (C). Fatty infiltration may have a regional distribution. Axial out-of-phase MR image (of another patient) demonstrated further signal dropout in the right lobe of the liver as compared with the left (D), consistent with steatosis with aright lobe predominance.
The two causes for iron accumulation within the liver are hemochromatosis and hemosiderosis. Hemochromatosis is characterized by abnormal intestinal absorption of iron. Consequently, there is abnormal accumulation of iron in the liver, until late in the disease when “spillover” occurs to involve pancreatic parenchyma. Therefore, the normal liver-spleen pattern is reversed on T1-weighted images, and in patients with advanced disease also seeing deposition in the pancreas. Primary, or genetic, hemochromatosis (Fig. 123-3) may be unnoticed until late in the process, and can have long-term sequelae such as fibrosis, cirrhosis, and hepatocellular carcinoma. In addition, genetic counseling and screening are important for primary hemochromatosis, which is autosomal recessive.
FIGURE 123-3:
Hemochromatosis. A 75-year-old man with homozygous C282Y mutation, the most common genetic defect causing excessive absorption of iron, underwent imaging evaluation. US of the liver (A) demonstrated diffuse increase in echogenicity. On MRI, the liver demonstrated abnormal low T2 signal (B) and diffuse signal dropout on the in-phase (C) images as compared to the out-of-phase (D) images.
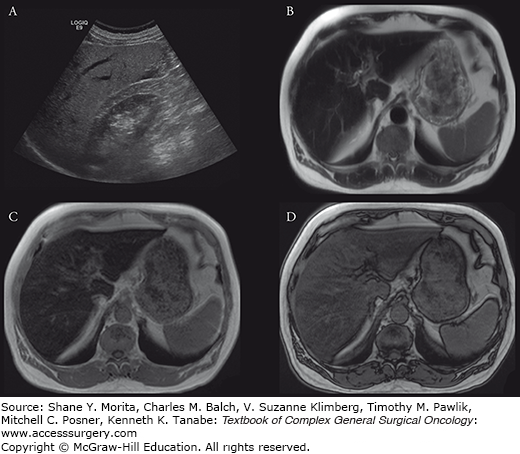
Hemosiderosis is not genetically linked but is associated with excessive iron loads from multiple blood transfusions. Hemosiderosis affects the spleen and marrow early on in the disease process, with the liver involvement a late finding. As in hemochromatosis, gradient echo imaging is sensitive for detection of hemosiderosis.
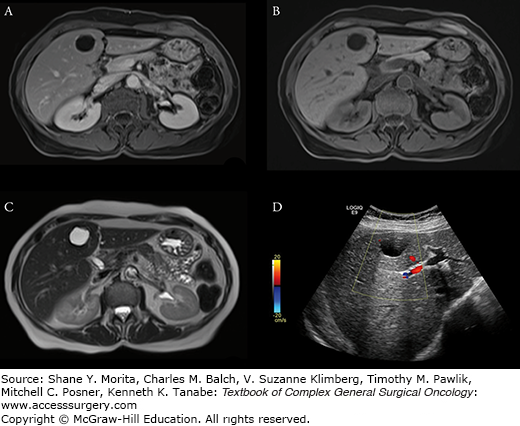
Cysts are common hepatic lesions (Fig. 123-4) that may be simple or associated with polycystic disease (see Chapter 137). Cysts simply can be reliably identified with Hounsfield unit less than 10 on CT. Cysts under 1 cm may be difficult to characterize on CT due to volume averaging with adjacent liver parenchyma. The MRI criteria for a simple cyst are a nonenhancing lesion that is homogenously bright on T2-weighted images and homogenously low on T1-weighted images. On US, simple cysts are anechoic and avascular structures that demonstrate increased through-transmission. Hepatic cysts may also be associated with infections, such as echinococcal disease. Echinococcal cysts are typically multiloculated and complex, some with components that enhance after Gd-DTPA administration.
Hepatic hemangiomas are common benign tumors found in 7.3% of autopsy specimens. Most hemangiomas are found incidentally on imaging studies such as CT, US, or MRI, performed for other reasons. Hemangiomas are typically hypointense compared to the liver parenchyma on T1-weighted images and hyperintense on T2-weighted images, and they have smooth, well-marginated, and frequently lobulated borders. The presence of peripheral nodular enhancement with slow filling in after gadolinium administration has been shown to be highly specific for diagnosing hemangioma. On CT, hemangiomas are typically hypoattenuating compared to the liver, and it enhances in a similar pattern as in MRI. On US, hemangiomas are hyperechoic to the normal liver (Fig. 123-5) (see Chapter 136).
FIGURE 123-5:
Hepatic hemangiomas typically demonstrate peripheral nodular enhancement (A). The CT scan was performed as a single-phase postcontrast examination for another indication. The patient underwent a 99m-Tc labeled red blood cell scan (B), which showed corresponding increase in tracer accumulation and confirmed the diagnosis. The patient’s US demonstrated hyperechoic hepatic lesions (C), which were also typical of hemangiomas.
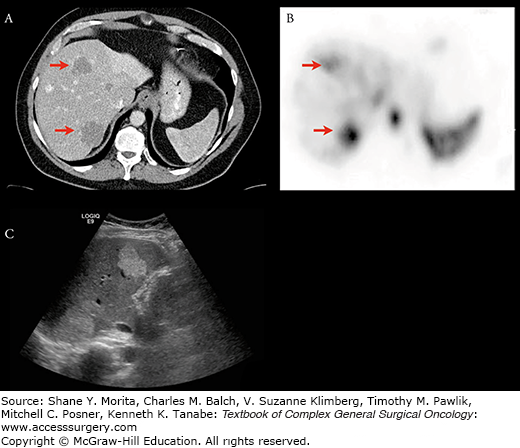
Problems arise with “atypical” hemangiomas, however, which may demonstrate “flash filling” and appear as hypervascular lesions, with overlapping imaging characteristics of malignant lesions. These lesions may be distinguished by their T2 characteristics11 or by using iron-based MR contrast agents. Alternatively, these lesions may be evaluated using 99m-Tc tagged red blood cell scans. Hemangiomas will have increased radiotracer uptake with diagnostic specificity of 100%.12
Focal nodular hyperplasia (FNH) is another common benign tumor of the liver (Fig. 123-6). FNH is asymptomatic and an incidental finding in up to 90% and most commonly in 80% presents as a solitary lesion. Histologically, FNH contains all the elements of normal liver and may contain a central fibrous scar surrounded by hepatocytes and small bile ducts (see Chapter 136).
FIGURE 123-6:
Focal nodular hyperplasia (FNH) is typically T-1 iso- to hypointense to the liver (A). After gadolinium administration, most FNHs show rapid and intense arterial enhancement (B) followed by hyper- to isointense in the venous phase (C). FNH retains hepatobiliary contrast on delayed imaging (D). Approximately half of FNH has a central scar that demonstrates delayed postgadolinium enhancement; this one does not.
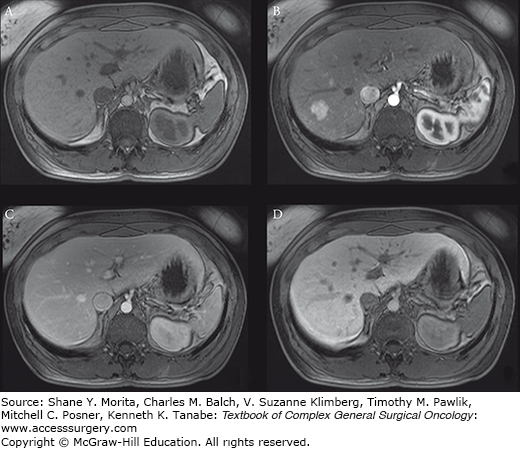
Typically, FNH is iso- to hypointense to the liver on T1-weighted images, and hyper- to isointense on T2-weighted images. After gadolinium administration, most FNHs show rapid and intense arterial enhancement, followed by hyper- to isointense in the venous phase. Approximately half of FNH have a central scar that typically demonstrate delayed postgadolinium enhancement. Accurate discrimination of FNH from hepatic adenoma (next section) may be assisted with delayed imaging after administration of hepatobiliary contrast,13 where FNH will appear isointense to hyperintense and adenoma hypointense compared with the liver.
FNHs contain variable degrees of Kupffer cell function; consequently, FNHs have variable 99m-Tc sulfur colloid uptake ranging from focally decreased to increased compared with the normal liver parenchyma. Masses with poor sulfur colloid uptake require further evaluation with another imaging modality, while those with increased sulfur colloid uptake as compared with the liver are consistent with FNH.
Hepatic adenomas are benign lesions that are often associated with the use of oral contraceptives and steroid therapy. Pregnancy may increase growth of adenomas. Most patients with hepatic adenomas are asymptomatic and are identified incidentally. Large adenomas can cause upper abdominal pain and may rupture resulting in bleeding (presenting symptoms of 10% of patients). Hemorrhage may be life-threatening if extensive, which may extend into the peritoneum. Histologically, adenomas consist of hepatocytes, but they lack hepatic veins and bile ducts, and have few, if any, reticuloendothelial cells (see Chapter 136).
Magnetic resonance characterization of adenomas varies, but typically they are hyperintense on T1-weighted images because of presence of blood products and/or fat. Adenomas are hypervascular lesions that show arterial enhancement postgadolinium administration. MR images may show a low signal intensity pseudocapsule that overlaps with the appearance of HCC,14 particularly those that are well-differentiated.
Computed tomography evaluation of adenomas parallels that in MR, depending on the presence of fat (hypoattenuating) and/or hemorrhage (hypo- to hyperattenuating depending on the age of blood products). Background hepatic steatosis also renders adenomas relatively hyperattenuating. Adenomas are typically heterogenously enhancing on arterial phase, and become iso- to hypoattenuating on portal venous phase.
The MR appearance of abscess is typically hyperintense on T2-weighted images with an irregular rim of intermediate signal intensity. Abscesses are generally hypointense on T1-weighted images, unless they contain hemorrhage and/or proteinaceous debris. After administration of contrast, the rim enhances but the central portion does not. The appearance of abscess on CT parallels that of MR. The appearance of an abscess varies from anechoic to hyperechoic on US, depending on degree of liquefaction. In contrast-enhanced US,15 typical abscesses appear as rim-enhancing lesions with irregularly enhancing (hyperechoic) rims with various thickness surrounding hypoechoic centers. Compared with conventional US or CT, the internal structures may be more conspicuous using this technique.
Hepatocellular carcinoma (HCC) is the fifth most common tumor and the third leading cause of cancer mortality worldwide.16 Diagnosis of HCC is challenging on US, as most patients have chronic liver disease17 that renders the liver parenchyma heterogenous (Fig. 123-7) and lower detection sensitivity.18 The heterogeneity is created by the presence of a nodular configuration, which may represent regenerative nodules, dysplasia, arteroportal shunts, and/or HCC. International guidelines19 for noninvasive diagnosis of HCC rely on detection of arterial enhancement followed by washout on later phase with contrast-enhanced CT and MR. In an analysis of 10 CT and 9 MR studies, CT and MR were found to have a moderate to high sensitivity (55% to 91%) and high specificity (77% to 96%) in diagnosing HCC.18 However, diagnosis of subcentimeter HCC remains difficult, even with advanced techniques,7 against other lesions that demonstrate early arterial enhancement such as regenerative nodules,20 small hemangiomas, and arterioportal shunts21 (see Chapter 127).
Stay updated, free articles. Join our Telegram channel

Full access? Get Clinical Tree


