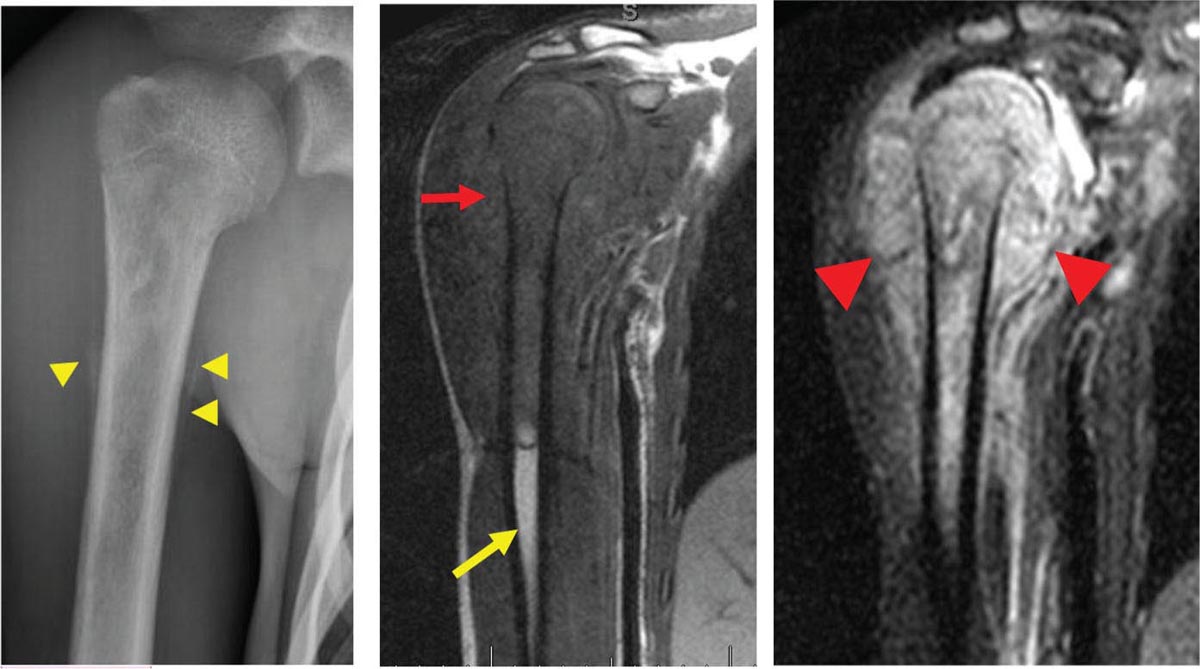
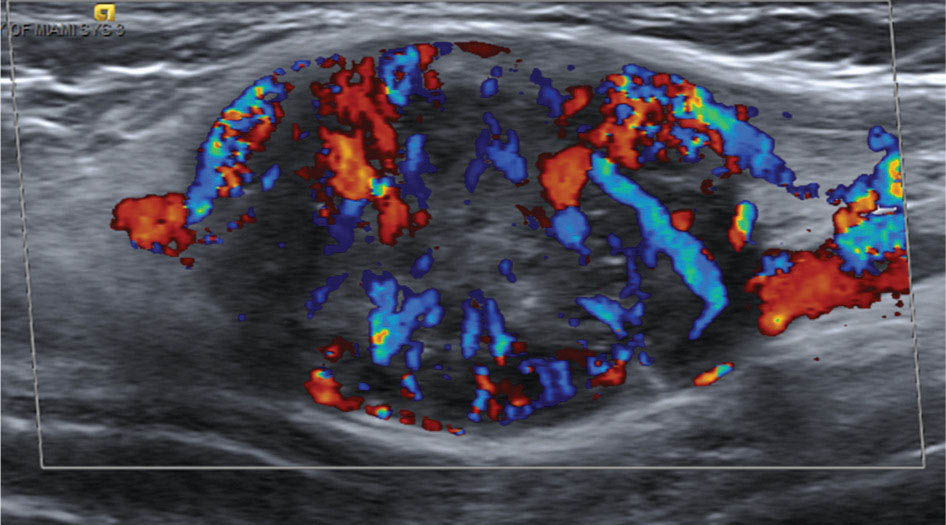
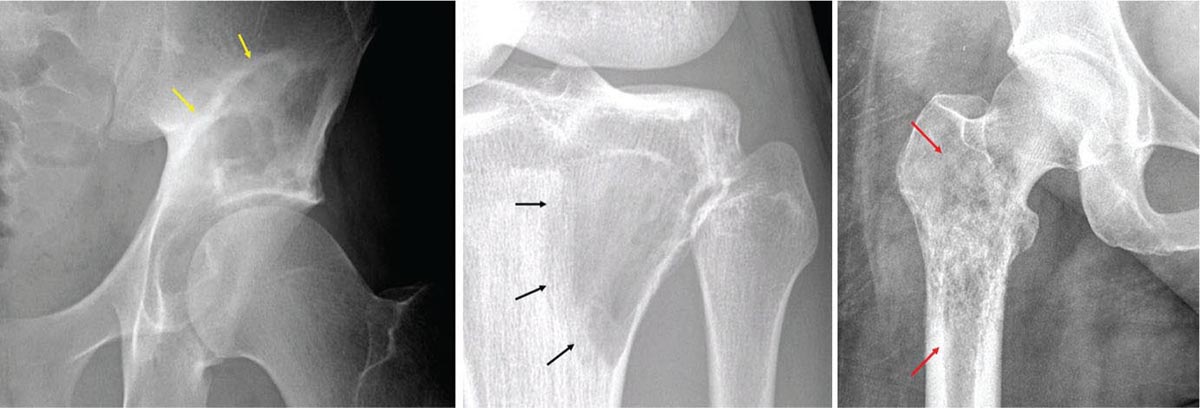
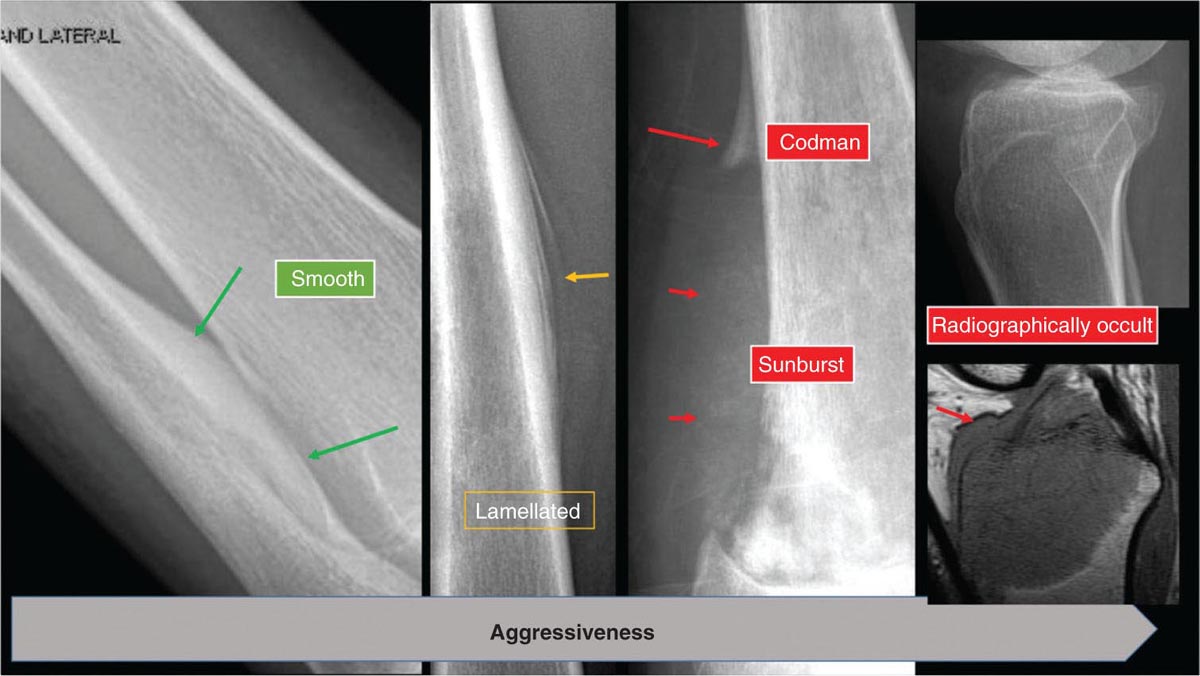
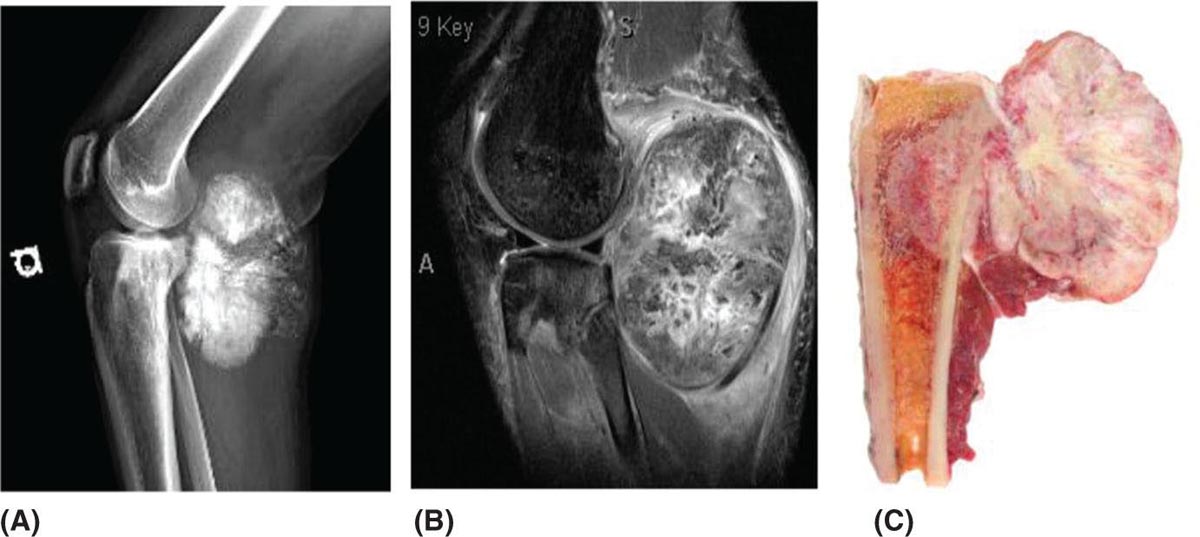
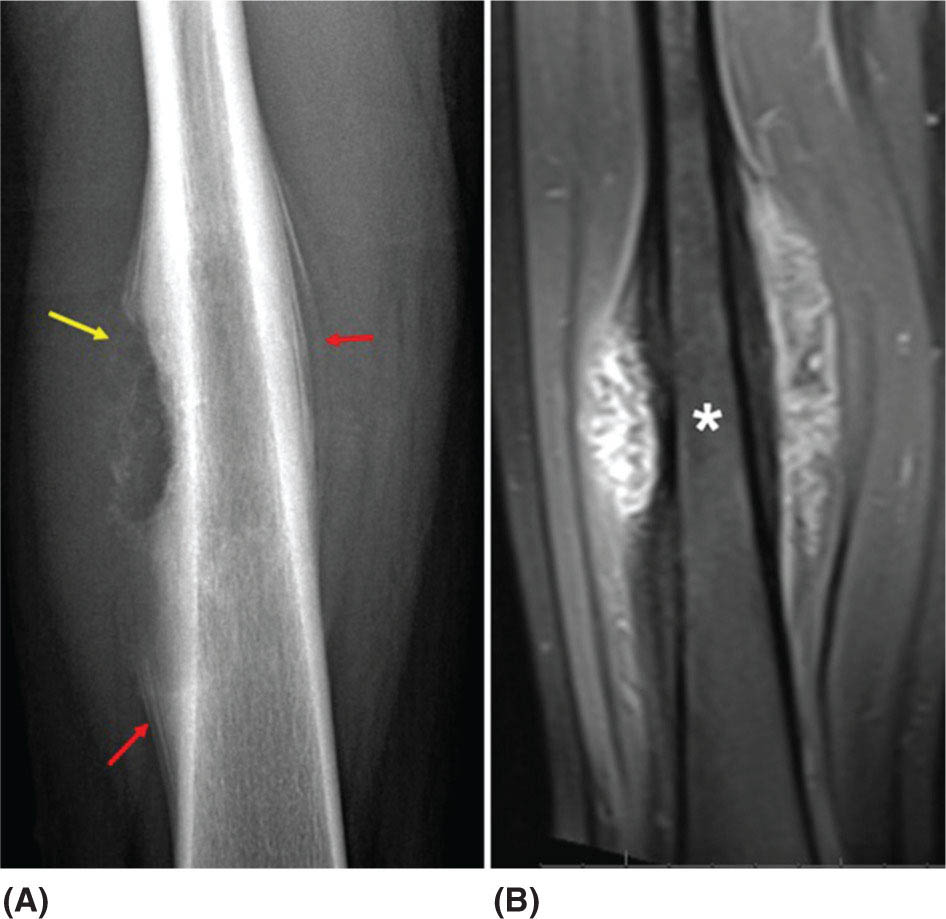
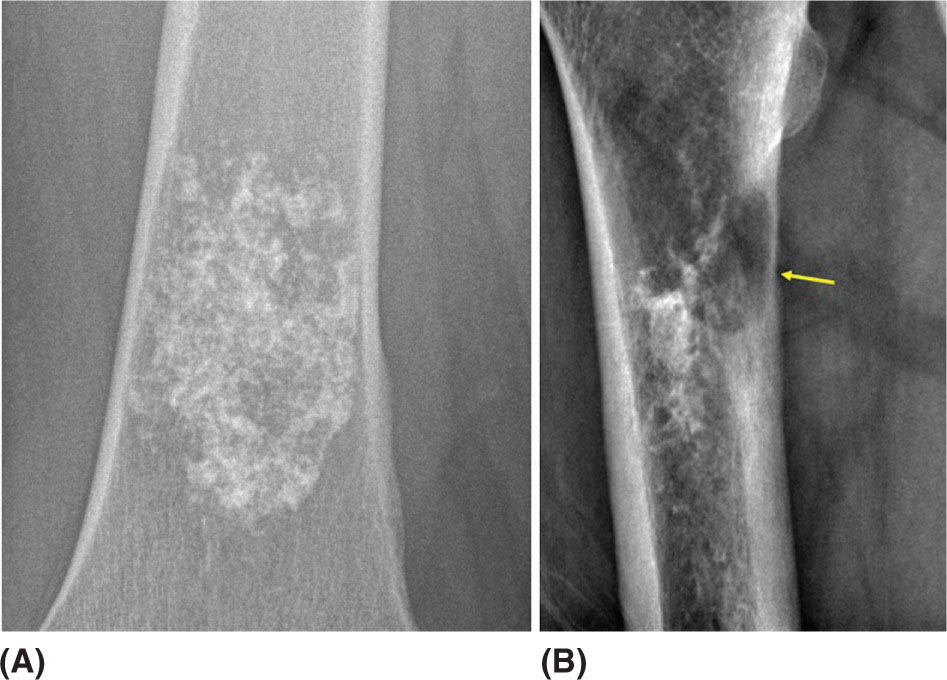
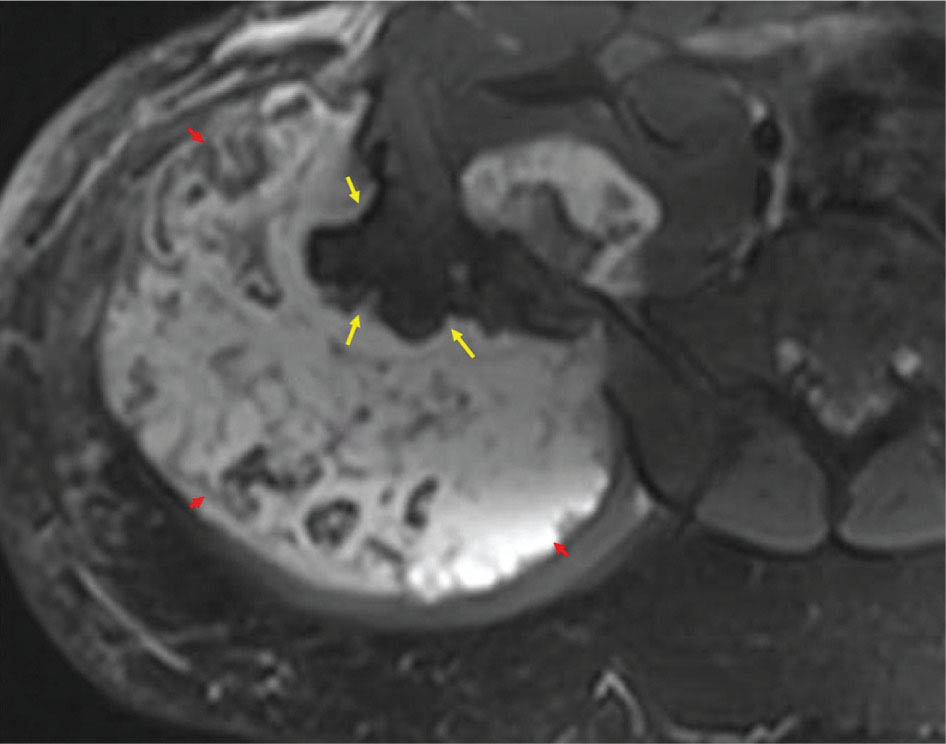
917 Radiologic Evaluation of Bone and Soft Tissue Sarcoma at Diagnosis and Follow-Up Radiology encompasses a diverse practice ranging from diagnostic imaging to definitive interventional treatments. While the field has become increasingly subspecialized by imaging modality and anatomic domains, sarcoma cuts across multiple subspecialty fields even within radiology. Because sarcomas arise in bone and soft tissue, musculoskeletal radiologists play a particularly prominent role in the diagnosis and management of sarcoma patients. This chapter focuses on the radiologic evaluation of both bone and soft tissue sarcomas. It reviews the most common imaging modalities, with an emphasis on understanding the language radiologists use to describe key features of disease. The chapter describes the characteristic radiographic findings that indicate biologic aggressiveness and matrix composition of bone sarcomas, distinguishing features of soft tissue sarcomas, and issues regarding initial staging. It discusses imaging follow-up pertaining to criteria for assessment of treatment response and guidelines for both local and distant disease surveillance. sarcoma, radiology, MRI, radiography, treatment response bone, diagnostic imaging, follow-up, radiologic evaluation, sarcoma, soft tissue, treatment response Aftercare, Bone and Bones, Diagnostic Imaging, Sarcoma, Technology, Radiologic, Treatment Outcome INTRODUCTION Radiology encompasses a diverse practice ranging from diagnostic imaging to definitive interventional treatments. While the field has become increasingly subspecialized by imaging modality and anatomic domains, sarcoma cuts across multiple subspecialty fields even within radiology. Because sarcomas arise in bone and soft tissue, musculoskeletal radiologists play a particularly prominent role in the diagnosis and management of sarcoma patients. This chapter focuses on the radiologic evaluation of both bone and soft tissue sarcomas. The most common imaging modalities are reviewed, with an emphasis on understanding the language radiologists use to describe key features of disease. Characteristic radiographic findings that indicate biologic aggressiveness and matrix composition of bone sarcomas, distinguishing features of soft tissue sarcomas, and issues regarding initial staging are described. The chapter also discusses imaging follow-up pertaining to criteria for assessment of treatment response and guidelines for both local and distant disease surveillance. IMAGING MODALITIES A brief review of common radiology imaging modalities highlights a few basic principles that may provide a broader understanding of each modality’s advantages and drawbacks, as well as a primer for commonly used terminology. Radiographs Radiographs are the diagnostic images resulting from exposure of a film (nowadays, digital imaging panel) to x-rays that have passed through a bone and soft tissue. It is interesting to think that little has changed in the basic physics of this modality since Röntgen first published the phenomenon in 1895 (a discovery for which he earned the first Nobel Prize in Physics in 1901); few other medical technologies from that era have endured essentially unaltered. The terms “plain film,” “x-ray,” and “radiograph” all refer to these two-dimensional clinical images. Denser material (metal, bone) attenuates the x-ray beam and appears white, whereas less dense tissue (e.g., lung) allows the x-rays to pass through unimpeded to expose the film/plate, appearing black (radiolucent). X-ray exposure results in a small dose of ionizing radiation, but the biologic risk of this exposure varies with the anatomic site being imaged and is generally negligible in the extremities at diagnostic imaging dosage. Radiographs are absolutely essential in the evaluation of any osseous abnormality, be it traumatic, neoplastic, developmental, or infectious. This is because of the wealth of information gleaned from this simple and ubiquitous examination: size and location of the lesion, presence and character of tumor mineralization, and biologic aggressiveness. Computed Tomography In the early 1970s, Sir Godfrey Hounsfield developed a method for reconstructing images based on three-dimensional exposure to rotating x-rays, revolutionizing medical imaging and sharing the 1979 Nobel Prize in Medicine with Allan Cormack. Differences in tissue density determine tissue contrast and are measured in Hounsfield units (HU). By convention, the scale is set with water at 0 HU, air at −1,000 HU, and fatty tissue between −40 and −120 HU; normal cortical bone is generally >800 HU and healthy muscle is typically around 30 to 40 HU. Lesions may be described as hyperdense, isodense, 92or hypodense relative to normal muscle or water. Iodinated contrast material may be injected intravenously to improve lesion conspicuity or delineate vascular anatomy. The degree of tumor enhancement with intravenous (IV) contrast material is often used as a surrogate marker for tumor viability, and nonenhancing regions of tumor are assumed to reflect tumor necrosis. Assessing the proportions of enhancing viable tumor and nonenhancing necrotic tumor, and how these proportions change over time, is as critical as measuring changes in tumor dimension when determining sarcoma treatment efficacy. Magnetic Resonance Imaging A discussion of the physics of nuclear magnetic resonance, which forms the basis for MRI, is beyond the scope of this chapter. The basic premise is that hydrogen protons (mainly in water) in the body are aligned by a strong magnetic field (clinical strengths commonly at 1.5 and 3.0 T). The protons are spinning, and precess (much like a spinning top) with a specific Larmor frequency. To get signal, the protons must first be energized or “excited” by a radiofrequency (RF) pulse. The RF pulse also brings the proton into phase coherence. The protons then release that energy, or “relax” also by means of radiation. For their work in developing MRI, Peter Mansfield and Paul Lauterbur were awarded the 2003 Nobel Prize in Medicine. On T1-weighted images, tissue contrast is generated by exploiting differences in the rate at which the protons in different tissues relax to their ground state; for example, protons in fat relax faster than those in free water. A second type of image (T2-weighted) is dependent upon the rate at which the protons dephase; protons in fat and muscle dephase much faster than those in free water. T1-weighted, fat-suppressed T2 (or sometimes proton density [PD])-weighted, and contrast-enhanced T1-weighted (frequently also fat-suppressed) sequences form the standard sequences around which most orthopedic oncology MRI protocols are built. In this clinically oriented review, we focus on explaining terminology frequently used in clinical radiology reports. With T1 weighting, fat is hyperintense (white) compared to skeletal muscle, and water is dark. T1-weighted images are helpful in evaluating bone marrow, because most marrow in adults (particularly appendicular) comprises yellow or “fatty” marrow; because cellular tissue contains more water, hematopoietic “red” marrow is variably darker (more hypointense) on T1-weighted images than yellow marrow. In T2-weighted images, both fat and water are hyperintense (relative to skeletal muscle); but in many situations, the signal from fat is suppressed, such that only water or tissues containing high water content are bright. We often refer to these as “fluid-sensitive” sequences, and the term “T2 hyperintensity” invariably refers to water-like signal (see Figure 7.1). FIGURE 7.1 (A) Frontal radiograph shows a conventional osteosarcoma in the proximal humerus with periosteal reaction (arrowheads) indicative of an aggressive lesion. (B) On the coronal T1-weighted image, note the normal T1-hyperintense signal in the more distal humeral diaphysis (yellow arrow), while the osteosarcoma obliterates the normal proximal humeral marrow (red arrow). (C) The coronal STIR, a fluid-sensitive sequence, depicts the tumor’s T2 hyperintensity as well as the extraosseous component both medially and laterally (arrowheads). The glenohumeral joint effusion is suggestive of intra-articular extension. STIR, short-tau inversion recovery. 93Because tumors are hypercellular, and cellular tissue is composed mostly of water, musculoskeletal neoplasms are generally hyperintense on T2-weighted images, though the presence of other components (e.g., evolving blood products) will alter the relaxation parameters. Hemosiderin, as a superparamagnetic material, accumulating at the periphery of a hemorrhagic or necrotic tumor component, will substantially shorten T2 relaxation times and may result in a rim of T2-hypointense signal at the margins. Solid viable tumor components will enhance with gadolinium-based contrast agent; nonenhancing components (e.g., tumor necrosis) will manifest as areas of hypointensity on the post-contrast sequences. Because changes in the amount or proportion of viable tumor may supersede dimensional changes in clinical decision-making, it is sometimes useful to obtain “subtraction” images, where the precontrast images are subtracted from the postcontrast images, which aids in discriminating true tissue enhancement from areas of tumor hemorrhage that are often intrinsically T1 hyperintense. Like CT, MRI does utilize electromagnetic radiation; however, the radiation employed is “nonionizing” and poses no known carcinogenic threat (although the U.S. Food and Drug Administration [FDA] does place limits on the amount of RF energy to be delivered). Intrinsic tissue contrast, that is, conspicuity of soft tissue planes and the ability to distinguish substances such as blood from fat, muscle, and fibrous tissue, is superior to that of CT and can be improved even further with administration of gadolinium-based contrast agents. MR images are arbitrarily assigned pixel values based on signal strength; thus, unlike HUs in CT, it is impossible to quantify absolute tissue signal in a given region of interest; only relative signal strengths (to muscle by convention) can be evaluated. Whereas a CT scan of the entire body may take only several seconds on modern multirow detector machines, MRI is generally much more time-consuming, in part because standard MRI sequences are acquired separately in a single plane (coronal, axial, and sagittal), although some MRI sequences permit isotropic resolution, so that the acquired data set can be reformatted into any desired image plane. Routine protocols may require anywhere between 30 and 60 minutes, depending on the extent of anatomic coverage. Finally, patients must be screened for MRI because of the possibility of fatal implant migration (e.g., non–MR-compatible brain aneurysm clips, cardiac pacing implants, or other metals that are not MR compatible). Ultrasound Ultrasound exploits the piezoelectric effect that allows certain solid crystals to translate mechanical motion into small electrical charges. The ultrasound probe is essentially an array of these crystals that transmits mechanical wave energy (insonation) into tissue and then detects the reflected waves that are converted into electronic signals, eventually formed into a gray scale image. The insonated sound waves are reflected and refracted based on a number of factors including tissue composition, orientation, and tissue boundaries/interfaces. Because water transmits the sound waves efficiently, simple fluid-filled cysts reflect back little acoustic energy, and thus appear “anechoic.” Solid soft tissue neoplasms typically appear hypoechoic to adjacent adipose tissue, but may also result in attenuation of sound wave transmission to deeper tissues. Ultrasound also detects blood flow within a lesion using the Doppler effect (see Figure 7.2); echoes reflected from the moving intravascular blood will be phase shifted by the direction of blood flow, either toward the transducer (frequency is compressed) or away from the transducer (frequency is stretched). This allows one to calculate both the velocity and directionality of blood flow. Doppler interrogation is particularly useful when seeking to target viable solid tumor components in an otherwise cystic/necrotic mass, assessing tumor relationships to the neurovascular bundle, and in distinguishing high- from low-flow vascular neoplasms and malformations. Ultrasound is generally well suited to localized exams of more superficial soft tissue masses. Lower-frequency sound waves can interrogate deeper soft tissues, but at the cost of decreased spatial resolution. FIGURE 7.2 Ultrasound shows that the lesion is hypervascular, with markedly increased internal blood flow on Doppler interrogation, typical of alveolar soft part sarcoma. The red and blue coloring reflects blood moving away from or toward the probe. 94Positron Emission Tomography The basis for most PET imaging is use of a radiolabeled glucose analog—fluorodeoxyglucose (18F), often abbreviated FDG—that becomes concentrated in metabolically active tissues. 18F decays by emitting a positron, which self-annihilates with its electron antiparticle, thus releasing two gamma rays that travel in opposite directions. A ring of scintillators and photomultiplier tubes surrounds the patient to detect and spatially localize only photons arriving simultaneously at the detector, that is, coincidence events. CT scanning of the patient is either performed on a dual PET–CT machine or the CT may be acquired on a separate machine with the images anatomically registered to the PET images to create a fused PET–CT series. The CT portion of the exam serves two key roles—one is to create an attenuation map that corrects for undercounting of true coincidence events that arise because of photon absorption in the bones, soft tissues, or metallic implants and the other purpose is to refine anatomic localization of the site of increased tissue metabolism. PET–CT plays important roles in initial staging by identifying distant sites of disease and in characterizing morphologically indeterminate lesions as either metabolically active or relatively quiescent. Generally, lung nodules <1 cm in size are not well characterized by PET–CT and are said to be below the threshold for reliable determination of FDG avidity. It should also be pointed out that some benign tumors may show surprisingly high levels of FDG avidity and may be detected incidentally on staging PET–CT, for example, intra-articular tenosynovial giant cell tumor.1 On the other hand, some malignant tumors may show little FDG uptake relative to background. While there are a variety of ways FDG uptake may be quantified, most radiologists and nuclear medicine physicians will report a lesion’s maximum standardized uptake value in a given region of interest (SUVmax). PET–CT may be an excellent problem-solving tool in circumstances in which identifying viable residual tumor would mandate a change in treatment; but one must be aware of nonspecificity of FDG uptake in any postinfectious/inflammatory setting, which limits PET–CT’s role in early postoperative surveillance. BONE TUMORS General Considerations Radiography plays a central role in the initial evaluation of any bone lesion. While the reader is referred to other sources for a full discussion of the radiographic differential for bone tumors,2 we focus on providing a brief primer for nonradiologists in a basic interpretative approach. During initial evaluation of a bone lesion, one should attempt to answer several key questions in determining its likelihood of being neoplastic, its malignant potential, and any impending fracture risk: • Where is the lesion: which bone and where in the bone? • What is the structural effect on the bone? • How is the bone responding? • What is in the lesion (any clues to the histology)? Answers to these questions, coupled with a few demographic and clinical details, can lead to a confident diagnosis in many cases. Even if the likely histology cannot be determined, the radiographs will elucidate a lesion’s biologic aggressiveness and whether it should be biopsied. Where Is the Lesion? The skeletal location of a tumor is a particularly helpful discriminator of tumor subtypes. While most bone tumors may occur in or near the metaphysis of long bones, particularly around the knees and proximal humerus, other locations favor a few diagnoses, for example, Ewing sarcoma and chondrosarcoma in the flat bones such as the iliacs or ribs, adamantinoma in the tibial shaft and mandible, and chordoma in the skull base or sacrum. The location of the tumor in a long bone—epiphysis, metaphysis, or diaphysis—is helpful in further narrowing the differential considerations. Osteosarcoma usually occurs in the metaphysis, while Ewing sarcoma is known to occur in the diaphysis. A large majority of 95giant cell tumors of bone are subarticular and generally extend into the metaphysis. Osteolytic tumors that involve only the epiphysis include chondroblastoma and clear cell chondrosarcoma. What Is the Structural Effect on the Bone? Some tumors are osteolytic and others are osteoblastic. Some, notably breast carcinoma metastases, can be mixed. Osteolysis caused by tumor is, at a cellular level, performed by osteoclasts and not the tumor cells themselves; while tumor cells cannot resorb bone, they can upregulate the osteoclasts via the RANK (receptor activator of nuclear factor-κB) ligand pathway. Note that for a lytic lesion to be seen on a radiograph, at least 50% of the bone matrix (compared to the surrounding bone) must be resorbed. As described by Lodwick,3 there are three classic patterns of bone destruction that give a clue to the aggressive nature of an osteolytic lesion and predict tumor growth rate (see Figure 7.3): • “Geographic bone destruction” implies a lesion with a sharply defined border. This can also be described as a narrow zone of transition between pathologic and normal bone. A geographic appearance implies a benign or less aggressive tumor, particularly when a thick sclerotic rim is present, as this implies sufficiently slow growth as to allow osteoblasts to deposit bone around the tumor margin. • “Moth-eaten appearance” refers to areas of bone destruction with ragged edges. This is indicative of a malignant process rapidly expanding in the bone, resulting in mottled appearance. Metastatic disease, myeloma, lymphoma, and Ewing sarcoma commonly have a moth-eaten appearance. • “Permeative appearance” implies that the tumor is moving through the bone without destroying all the trabeculae, resulting in numerous tiny “holes” in the bone that may become confluent in larger areas of destruction. There is, therefore, an ill-defined wide zone of transition between pathologic and normal bone. This classically is characteristic of round cell tumors such as lymphoma, leukemia, Ewing sarcoma, myeloma, osteomyelitis, and neuroblastoma. From a practical standpoint, moth-eaten and permeative appearances are distinctions without a clinically meaningful difference as they may coexist in a lesion and both mark a biologically aggressive process. Recognizing such realities, Caracciolo et al. have proposed a modified Lodwick–Madewell grading system that groups geographic lesions with a well-defined margin (sclerotic or not) as grade I; geographic lesion with partial or circumferential ill-defined margins as grade II; and moth-eaten/permeative appearance, lesions exhibiting changes in margin or progressive endosteal scalloping, or radiographically occult lesions (but seen as marrow infiltrative processes on advanced modalities such as PET or MRI) as grade III.4 Of 183 lytic bone tumors, 76 of 81 (94%) grade I lesions were confirmed histologically as benign and 39 of 48 grade III lesions (81%) were malignant; however, grade II lesions were nearly as likely to be benign as malignant. How Is the Bone Responding? This question is closely related to the above issues of what the lesion is doing, but focuses on how the bone and specifically the periosteum are reacting to the lesion. The universal response of periosteum to disease or injury is to make more bone. With slower-growing lesions, the periosteum is raised off the cortex, but has sufficient time to lay down new bone, resulting in solid periosteal mineralization. With slightly faster growth, a smooth line of mineralization may form a shell around the lesion. “Onion-skinning” or lamellated periosteal reaction occurs when the periosteum lays down bone between sporadic intervals of more rapid tumor growth. Tumors that are rapidly increasing in size outstrip the periosteum’s ability to lay down surrounding bone and stretch the small orthogonally oriented Sharpey’s fibers between the periosteum and cortex; ossification along these perpendicular fibers results in a “sunburst” or “hair-on-end” appearance of periosteal reaction (see Figure 7.4). In some highly aggressive lesions, ossification may occur only at the margins of the lesion where the periosteum is lifted off the bone, resulting in the appearance of a Codman triangle when viewed tangentially at radiography. Finally, and perhaps counterintuitively, the most aggressive lesions may perforate the cortex and enlarge so rapidly that the periosteum has no time to lay down new bone; this type of growth is classically seen in primary bone lymphoma or very aggressive osteosarcoma. FIGURE 7.3 Geographic lytic lesions depicting a range of biologic aggressiveness that can be inferred from the pattern of osteolysis. (A) Fibrous dysplasia in the left iliac bone shows a grade I pattern with thick sclerotic margins. (B) Giant cell tumor of bone in the proximal tibia shows a grade Ib pattern with narrow zone of transition. (C) Metastatic Ewing sarcoma to the proximal femur shows a grade III pattern with permeative lucency and wide zone of transition. FIGURE 7.4 Patterns of periosteal reaction that correlate with tumor growth rates. Examples in this figure include an osteoid osteoma with smooth dense cortical reaction, periosteal osteosarcoma with lamellated periosteal reaction (“onion skinning”), conventional osteosarcoma with both Codman triangle and a sunburst pattern of mineralization along Sharpey’s fibers, and lymphoma with tumor growth outstripping ability of periosteum to lay down layers of surrounding bone. What Is in the Lesion? An assessment of the matrix of a lesion can give a clue to the histologic diagnosis. An osseous matrix appears fluffy and white on a radiograph. Often, radiologists may refer to this as an “osteoid matrix,” and it should be pointed out that use of the term “osteoid” in this context is distinct from pathologists’ usage, which denotes an absence of mineralization. The term “ground glass” matrix has been used to refer to the smooth increased mineralization pattern observed in fibrous dysplasia, although this can also be seen in low-grade central osteosarcoma. A chondroid matrix has a classical appearance of “rings and arcs” on plain films, reflecting the lobular growth pattern of the underlying cartilage-forming neoplasm. Fat-containing lesions, such as intraosseous lipoma or liposclerosing myxofibrous tumor, will exhibit intralesional fat, although the quantity may vary, depending on the extent of cystic involutional changes. Osteosarcoma Osteosarcoma (OS) is the most common primary bone sarcoma, typically occurring during childhood and adolescence. In patients over the age of 40, it is more often associated with a preexistent condition such as Paget’s disease or irradiated bone.5 Between 80% and 90% of the tumors occur in the metaphysis of long bone, with the most common sites being the distal femur, proximal tibia, and proximal humerus. The hallmark radiographic features of conventional osteosarcoma include production of neoplastic bone, which manifests radiologically as dense or calcifications, and aggressive periosteal reaction indicative of rapid tumor growth.6,7 Cross-sectional imaging studies may reveal centrally necrotic components in particularly aggressive lesions. FIGURE 7.5 (A) Lateral radiograph in a 25-year-old man with a grade 3 dedifferentiated parosteal osteosarcoma shows a large ossifying tumor centered on the posterior cortex of the proximal tibia, with a “stuck-on” type of appearance. (B) Sagittal T2-weighted, fat-suppressed MRI reveals extensive peritumoral edema, suggesting a higher-grade malignancy than typical low-grade parosteal osteosarcoma. (C) Gross resection specimen. Juxtacortical Osteosarcoma Juxtacortical osteosarcoma refers to OS originating from the surface of bone. It is primarily associated with the periosteum, with medullary canal involvement observed with higher grades and dedifferentiation. Juxtacortical OS is classified into three main subtypes—parosteal, periosteal, and high-grade surface OS. Parosteal OS is the most common type of juxtacortical OS, and the posterior aspect of the distal femur is the most commonly encountered site of disease.8 Anatomically, parosteal OS putatively originates from the outer fibrous layer of the periosteum and is usually low grade, appearing as a lobulated and exophytic mass with central dense ossification adjacent to the bone, in what has been described as a “stuck-on” appearance (Figure 7.5). At cross-sectional imaging, invasion into the medullary canal can be seen in both low-grade (41%) and high-grade (50%) lesions, but its prognostic implications are unclear.8 Dedifferentiation of low-grade parosteal OS to high-grade disease has been reported in approximately 25% of cases.9 Periosteal OS is the second most common type of juxtacortical OS, accounting for 1.5% of all OS cases.10 It typically affects patients in the second or third decade of life, with a characteristic location along the diaphyses of long bones, most commonly the tibia, and a general prognosis intermediate between parosteal and conventional osteosarcoma.11 Periosteal OS arises from the inner, germinative layer of periosteum, and common radiographic findings include a soft tissue mass with periosteal reaction, cortical erosion, and cortical thickening (Figure 7.6) Differentiation of high-grade surface OS from periosteal OS may be difficult at imaging, as both can occur in diaphyses and cause periosteal reaction and bone destruction. However, high-grade surface OS often involves the entire circumference of the cortex and is more likely to show medullary invasion.12 Furthermore, the presence of a high histologic grade, identical to that of conventional OS, throughout the entire tumor is diagnostic of high-grade surface OS. Telangiectatic Osteosarcoma Telangiectatic OS accounts for <5% of all OS cases; it most frequently occurs in long bone metaphyses, particularly the femur. Characteristic radiographic appearances of telangiectatic OS include asymmetric aneurysmal bone expansion, geographic osteolysis, and an aggressive growth pattern with cortical destruction and minimal peripheral sclerosis.7 Common features at CT and MRI include soft tissue mass, osteoid matrix mineralization, fluid levels, and thick peripheral and nodular septal enhancement. Osteoid matrix mineralization is often subtle on radiographs and of limited extent because viable tumor cells make up only a small amount of the lesion compared with the volume of cystic spaces. At MRI, hemorrhage and fluid–fluid levels are frequently identified, although this is a nonspecific finding shared with aneurysmal bone cysts and giant cell tumors of bone. The presence of nodular septal thickening, osteoid matrix mineralization in a soft tissue mass, and an aggressive growth pattern can aid in distinguishing telangiectatic OS from aneurysmal bone cyst (Figure 7.7). FIGURE 7.6 Periosteal osteosarcoma in the femoral diaphysis of a 17-year-old female. (A) Note the lamellated periosteal reaction (red arrows) and faintly mineralized more superior component that erodes the underlying thickened cortex (yellow arrow). (B) Contrast-enhanced MRI shows the enhancing tumor growing along the surface of the femoral shaft, but sparing the intramedullary canal (asterisk). FIGURE 7.7 (A) Initial radiograph shows an expansile osteolytic lesion of the distal radius with internal septations, thought to represent an ABC. (B) Fourteen months after the initial radiograph, there is increased expansion and frank cortical destruction of the distal radius, aggressive periosteal reaction, and increased soft tissue swelling in this telangiectatic OS. (C) Axial fat-suppressed, proton density–weighted MRI through the lower lumbar spine reveals dependent layering of numerous fluid–fluid levels (arrows) in this recurrent vertebral body telangiectatic OS. ABC, aneurysmal bone cyst; OS, osteosarcoma. Chondrosarcoma Chondrosarcoma is a malignant tumor that produces cartilage matrix. Primary chondrosarcoma constitutes 20% to 27% of all primary malignant osseous neoplasms. There are numerous types of primary chondrosarcomas, including conventional intramedullary, clear cell, juxtacortical, myxoid, mesenchymal, extraskeletal, and dedifferentiated. Early diagnosis and treatment of chondrosarcomas are paramount to achieving a better prognosis. Multiple imaging modalities have been used for the purpose of initial detection, characterization, and staging, as well as for the performance of image-guided biopsies. The difficulties that clinicians, radiologists, and pathologists face in the differentiation of enchondroma from low-grade chondrosarcoma and the difficulty in uniform histologic grading of chondrosarcoma have been emphasized in two studies that evaluated the interobserver variability in the diagnosis and histologic grading of cartilaginous tumors. Both studies demonstrated low reliability in the distinction between enchondroma and low-grade chondrosarcoma 99and a low reliability in the histologic grading of chondrosarcoma among bone tumor pathologists.13–15 Furthermore, the Skeletal Lesions Interobserver Correlation among Expert Diagnosticians (SLICED) study group also demonstrated significant variation among radiologists in differentiating enchondroma from low-grade chondrosarcoma and a low reliability in the grading of chondrosarcoma based on radiography or CT, with slightly improved agreement among radiologists when MRI was used.14 As Roitman et al. observed, concordance with respect to histologic grade between initial needle biopsy and final resection specimen was only 67% for pelvic chondrosarcomas,16 further supporting a multidisciplinary team strategy that incorporates clinical, imaging, and histologic findings in the diagnosis and management of patients with these types of lesions. FIGURE 7.8 (A) Enchondroma in the distal femur displaying classic chondroid mineralization pattern of “rings and arcs,” recapitulating the lobular growth of this cartilage-forming tumor. (B) Chondrosarcoma in the proximal femur showing high-grade (more than two-thirds of the cortical depth) endosteal scalloping (arrow). Imaging features directly reflect this pathologic appearance, and the various subtypes often show distinctive features. Radiographic findings often suggest the diagnosis of chondrosarcoma because of identification of typical “ring-and-arc” chondroid matrix mineralization (representing the enchondral ossification) and aggressive features of deep endosteal scalloping and soft tissue extension (Figure 7.8). These latter features are usually best assessed, as is lesion staging, with CT or MRI. Radiographs of central long bone chondrosarcoma (CS) typically show a region of mixed lysis and sclerosis, with the sclerotic areas representing classical rings and arcs of chondral matrix mineralization, which are seen in 60% to 78% of cases. The degree of calcification is variable, but higher-grade tumors tend to show less mineralization. Low-grade tumors classically demonstrate a geographic, lobular margin, while moth-eaten or permeative bone destruction is indicative of higher-grade lesions or possible dedifferentiation. Deep endosteal scalloping (more than two-thirds of the depth of the cortex) and cortical thickening are the morphologic features of central CS that aid to discriminate it from enchondroma. PET–CT has been used to improve diagnostic accuracy of chondroid tumors; a recent systematic literature review of 166 total lesions confirmed that SUVmax was lower for benign compared to malignant tumors, with mean values of 1.6 versus 4.4, respectively.17 Moreover, SUVmax correlated with tumor grade, and SUVmax ≥4.4 was 99% specific for grade 2/3 chondrosarcoma. However, it remains to be established whether metabolic activity, as quantified by F-18 FDG PET, meaningfully correlates with the clinical outcome measures such as disease-free survival or overall survival. Peripheral Chondrosarcomas Peripheral chondrosarcomas may arise from the cartilaginous cap of a preexisting osteochondroma. Patients with multiple hereditary exostoses (MHE) are particularly prone to this complication, as already indicated. The risk of malignant transformation in a solitary osteochondroma is very low but has been estimated to be between 1% and 2%. The radiographic signs of malignant progression in an osteochondroma include increased growth after skeletal maturity, or irregularity and thickening of the cartilage cap or destruction of the stalk radiographically (Figure 7.9). Juxtacortical Chondrosarcoma Juxtacortical chondrosarcoma, which arises on the surface of bone, has also been referred to as periosteal and parosteal chondrosarcoma. Juxtacortical chondrosarcoma most frequently affects adults in the third to fourth decades of life and has a mild male predilection. Lesions are most frequently seen 100on the surface of long bones, particularly the posterior distal femoral metaphysis or diaphysis, but can arise anywhere. Typical chondroid matrix mineralization is usually present. In addition, metaplastic ossification is often apparent to a variable extent. FIGURE 7.9 Axial proton density–weighted, fat-suppressed image shows a large chondrosarcoma arising from a preexisting osteochondroma of the right iliac bone; note the corticomedullary continuity of the underlying osteochondroma (yellow arrows) with the iliac bone. The large tumor demonstrates a hyperintense lobular, cartilaginous matrix (red arrows) on this fluid-sensitive sequence.

Stay updated, free articles. Join our Telegram channel

Full access? Get Clinical Tree


