19.1
Introduction
In this chapter, we first address some of the problems inherent in using a racial classification system for describing human variation. We then describe variations in bone and mineral metabolism and fracture risk that have been observed between and within “racial” or ethnic groups. We concentrate on race/ethnic differences in fracture rates within the United States since Chapter 20 , Geographic variability in the incidence of hip and vertebral fractures, reviews worldwide differences in fracture rates. We also concentrate on adults age 50 years or older. For race/ethnic differences in changes in bone strength over the menopausal transition, refer to Chapter 24 , Clinical and epidemiological studies. As race/ethnic differences in risk of osteoporosis should be interpreted with caution, they are all too often treated in an overly simplistic manner. They can be affected by technological differences in measurements, variations in use of reference data, geographic differences, and a myriad of biological and cultural factors.
19.2
Background and definitions
“Ethnicity” and “race” appear interchangeably in many publications. “Race” in the United States reflects the belief that a limited number of genetically characterized human groups exist, exemplified by the list to be used by the 2020 US Census, although individuals will be able to select among 15 subcategories or write them in. The main categories are White, Black or African-American, American-Indian or Alaska Native, Asian/Pacific Islander (with a number of choices), and “some other race.” Hispanic, Latino, or Spanish origin is asked separately. Most investigators recognize, however, that distinct racial lines may not be drawn due to significant genetic admixture and other evolutionary forces that have occurred over time. Also, because environments change, and because populations move and interbreed, it is difficult if not impossible to identify discrete, biologically meaningful subgroups of humans.
A factor that reflects cultural, religious, dietary, geographic, and other differences between groups, known as ethnicity, then becomes important . Lack of ethnic definition of study groups affects the general applicability of data. A study reporting hip fracture rates of “Asians” may apply only to a specific Asian group, such as Japanese, but not to Koreans or another Asian group. For example, in a study comparing the mean bone mineral density (BMD) of Japanese, Korean, and Taiwanese women, the Taiwanese had consistently greater BMD at the lumbar spine at almost every age .
Assessment of ethnic and geographic variations helps describe disease occurrence among human groups, such as the description of factors that may affect observed differences in fracture rates. For this reason, as well as the pitfalls associated with “race” described earlier, we attempt to use “ethnic” with “race” in most of the contexts that follow. Data are frequently reported using “racial” categorizations without indication of ethnic grouping. We present those data as reported. Finally, race plays a role in the knowledge, attitudes, and beliefs of women with osteoporosis, which will influence racial disparities .
19.3
Ethnoepidemiology of osteoporosis
Great variation in the occurrence of osteoporotic fractures exists worldwide and within and among different racial and ethnic groups (see Chapter 20 : Geographic variability in the incidence of hip and vertebral fractures). Some studies report wide ranges in hip fracture incidence rates within a given racial group, probably due to regional and/or lifestyle factors. In what follows we concentrate on race/ethnic differences in fracture rates within the United States.
19.3.1
Methodologic issues
There are several important methodologic issues that have important bearing on the ability to compare incidence rates among studies, including the need for age and sex standardization to adjust for differences in the age and sex composition of the populations under study, differences across studies in definitions of hip fracture and other fracture, differences across studies in the methods that were used to identify individuals with fracture, and generalizability of the population used to generate the fracture rates.
19.3.2
Need for age and sex standardization
The number of individuals aged over 65 years in the United States population is increasing rapidly with time, and because studies differ with respect to the age and sex composition of the populations under study, hip fracture incidence rates obtained from different time periods and from different ethnic groups are not strictly comparable unless the age and sex differences between study populations have been taken into account. A method called standardization is used as a means to provide an estimate of the incidence rate in a given population as if that population had the same sex and age composition as that of an arbitrarily selected study population. Any differences among study populations in adjusted hip fracture incidence rates that exist after standardization are unlikely to be due to differences in age or sex composition that exists between the study populations. Of note, however, many studies treat individuals aged 80 years and older as one group. Because fracture incidence rises steeply with age, the standardization process cannot adequately adjust for age if studies do not provide enough detailed data for the oldest age-groups.
19.3.3
Differences in the definition of hip fracture
Studies differ with respect to the amount of detail provided regarding the exact anatomic locations of the fractures. Studies have used one of the following definitions: (1) fracture of the femoral neck or proximal femur; (2) cervical, trochanteric, intracapsular, extracapsular, or intertrochanteric fracture; (3) hip fracture defined on the basis of International Classification of Disease (ICD) codes; or (4) hip fracture with no specification of fracture location. A small percentage of hip fractures result from severe trauma or from underlying pathology. Not all studies consistently exclude fractures due to severe trauma.
19.3.4
Differences in case ascertainment methods
Most studies of hip fracture suffer from some degree of underreporting due to the difficulties of identifying every person with hip fracture. Reasons for underreporting are that some fractures are misclassified as femoral shaft fractures, and some individuals with hip fracture are not hospitalized either because health services are not available or because they are treated in another setting (i.e., at home, in a chronic care facility, or by a native healer). Although the latter source of bias differs substantially from one country or study to another, it probably does not contribute substantially to fracture statistics in the United States.
19.3.5
Generalizability of the study population
Fracture rates do not only vary by country but also by region within the country. Significant regional variation in hip fracture has been reported for United States . Rates of hip fracture among Hispanics differed between California Hispanics and New York Hispanics . Thus national data using a population-based data set is preferred over data from smaller regional studies within a country .
19.4
Ethnic differences in US hip fractures
Broad conclusions can be drawn regarding differences in hip fracture rates among US Whites and Blacks with more limited data on Hispanics and Asians. Early studies from a 5% sample of Medicare beneficiaries, including more than 26,000 hip fractures, demonstrated that rates in 1986 increased with age in both men and women, Blacks and Whites. The black/white ratio in rates differed by age in women ranging from 0.42 in women age 65–69 years to 0.73 in women age 95–99 years. The black/white ratio in men ranged from 0.75 in men age 65–69 years to 0.36 in men aged 90–94 years, but there were few hip fractures in men in this oldest age-group .
Karagas et al. compared femoral neck and trochanteric hip fractures in a 5% Medicare sample of US Whites and Blacks (1986–90). Incidence of each type of hip fracture increased with age in both Whites and Blacks, men and women. The age-adjusted incidence of femoral neck hip fractures (per 100,000) was 218, 123, 433, and 191 in white men, black men, white women, and black women, respectively, following the overall pattern of all hip fractures. Rates of trochanteric hip fractures (per 100,000) were 2.8, 124, 423, and 154 in white men, black men, white women, and black women, respectively. Rates of each type of hip fracture were similar within each race and sex group.
Lauderdale et al. used a 1992 sample of Medicare enrollees, including a 50% sample of Hispanics and a 10% sample of Whites, Blacks, and Native Americans . Hispanic ethnicity was assigned by Spanish surnames. To separate the Hispanic population by ancestry, the authors used the 1990 census Public Use Microdata to identify states where the Hispanic elderly population is overwhelming of one ancestry: Texas and Arizona Mexican Americans (MAs) and Florida (Cubans).
Puerto Ricans were identified as those living in Puerto Rico. Hip fractures were identified by ICD code. Traumatic and pathologic fractures were excluded. Age-adjusted rates (per 100,000) were 220, 430, 730, and 1010 for Hispanic men, white men, Hispanic women, and white women, respectively. Overall rates in Hispanics were 0.75 observed in Whites. Within Hispanic subgroups, rates were greatest in MAs, followed by Cubans and Puerto Ricans.
The Hispanic Established Populations for the Epidemiologic Study of the Elderly (H-EPESE), a longitudinal study of a representative sample of 2895 MAs age 65 years and older in the southwestern United States, used a complex acculturation algorithm for MA heritage. The algorithm takes into account father’s Spanish versus non-Spanish surname, mother’s maiden name, both parents’ birthplace, subject’s self-identification, and ethnic background of all four grandparents . Results showed an overall incidence of hip fracture (per 100,000) in Hispanic women of 930 [95% confidence interval (CI)] (890–970) and Hispanic men of 480 (95% CI) (106–860). These rates are even higher than rates reported in US Medicare beneficiaries (1984–87) of 428 and 807 (per 100,000) for white men and white women, respectively. However, as noted earlier, H-EPESE study relied on a complex algorithm for identifying Hispanic heritage, and the population may not be representative. In addition, they relied on self-report of hip fracture and were unable to exclude major trauma.
Silverman and Madison examined hip fracture hospital discharge rates for the state of California in 1983–84. Age-adjusted rates per 100,000 of hip fracture were 140.7, 49.7, 57.3, and 85.4 in White, Hispanic, Black, and Asian women, respectively, and 48.9, 22.2, 38.7, and 26.3 in White, Hispanic, Black, and Asian men, respectively. These hip fracture rates among Hispanics were similar to those from Mexico City, Mexico in women but higher than rates in men living in Mexico .
Hip fracture hospitalization rates for Non-Hispanic Whites (NHW), Blacks, Hispanics, and Asians were estimated for New York City in 1988–2002 . Hip fracture hospitalization rates per 100,000 were in men 220.3, 87.2, 109.4, and 104.0 in Whites, Hispanics, Blacks, and Asians, respectively, and in women 459.0, 143.1, 137.4, and 173.6 in Whites, Hispanics, Blacks, and Asians, respectively. Hispanics in New York are likely of different heritage than Mexican Americans, which may contribute to the observed difference in rates.
There are limited data comparisons within Asian groups. Lauderdale et al. used surnames within the Medicare data (1992) and showed that the age-adjusted hip fracture incidence was lower for all three Asian-American groups than for Whites . For women, standardized fracture ratio relative to Whites was 0.30 for Chinese, 0.73 for Japanese, and 0.53 for Koreans. For men the standardized hip fracture ratio was 0.42 for Chinese, 0.58 for Japanese, and 0.90 for Koreans. The use of surnames to identify ethnicity may be problematic, especially for women.
To address whether or not these differences in hip fracture rates were related to environment or lifestyle, Ross et al. compared hip fracture rates in men and women of Japanese ancestry living in Oahu, Hawaii from 1979 to 1981 to rates for Japanese living in Okinawa, Japan from 1984 to 1985, and rates in Caucasians (Rochester, Minnesota) from 1978 to 1982. Age-specific and cumulative rates of hip fracture among people of Japanese ancestry were approximately half that of Caucasians with little detectable difference in rates between Oahu, Hawaii and Okinawa, Japan. A further study included comparison between Japanese living in Hawaii and Caucasians living in Hawaii and found no difference primarily because rates of hip fracture were low among the Hawaiian-Caucasians .
To our knowledge, there are few data on hip fracture rates in American-Indians. In the Women’s Health Initiative (WHI), during a mean of 7.6 years, 5 of 417 (0.4%) American-Indians experienced a hip fracture . Among First Nations people in Canada, rates of hip fracture were about twofold higher than Caucasians in Canada .
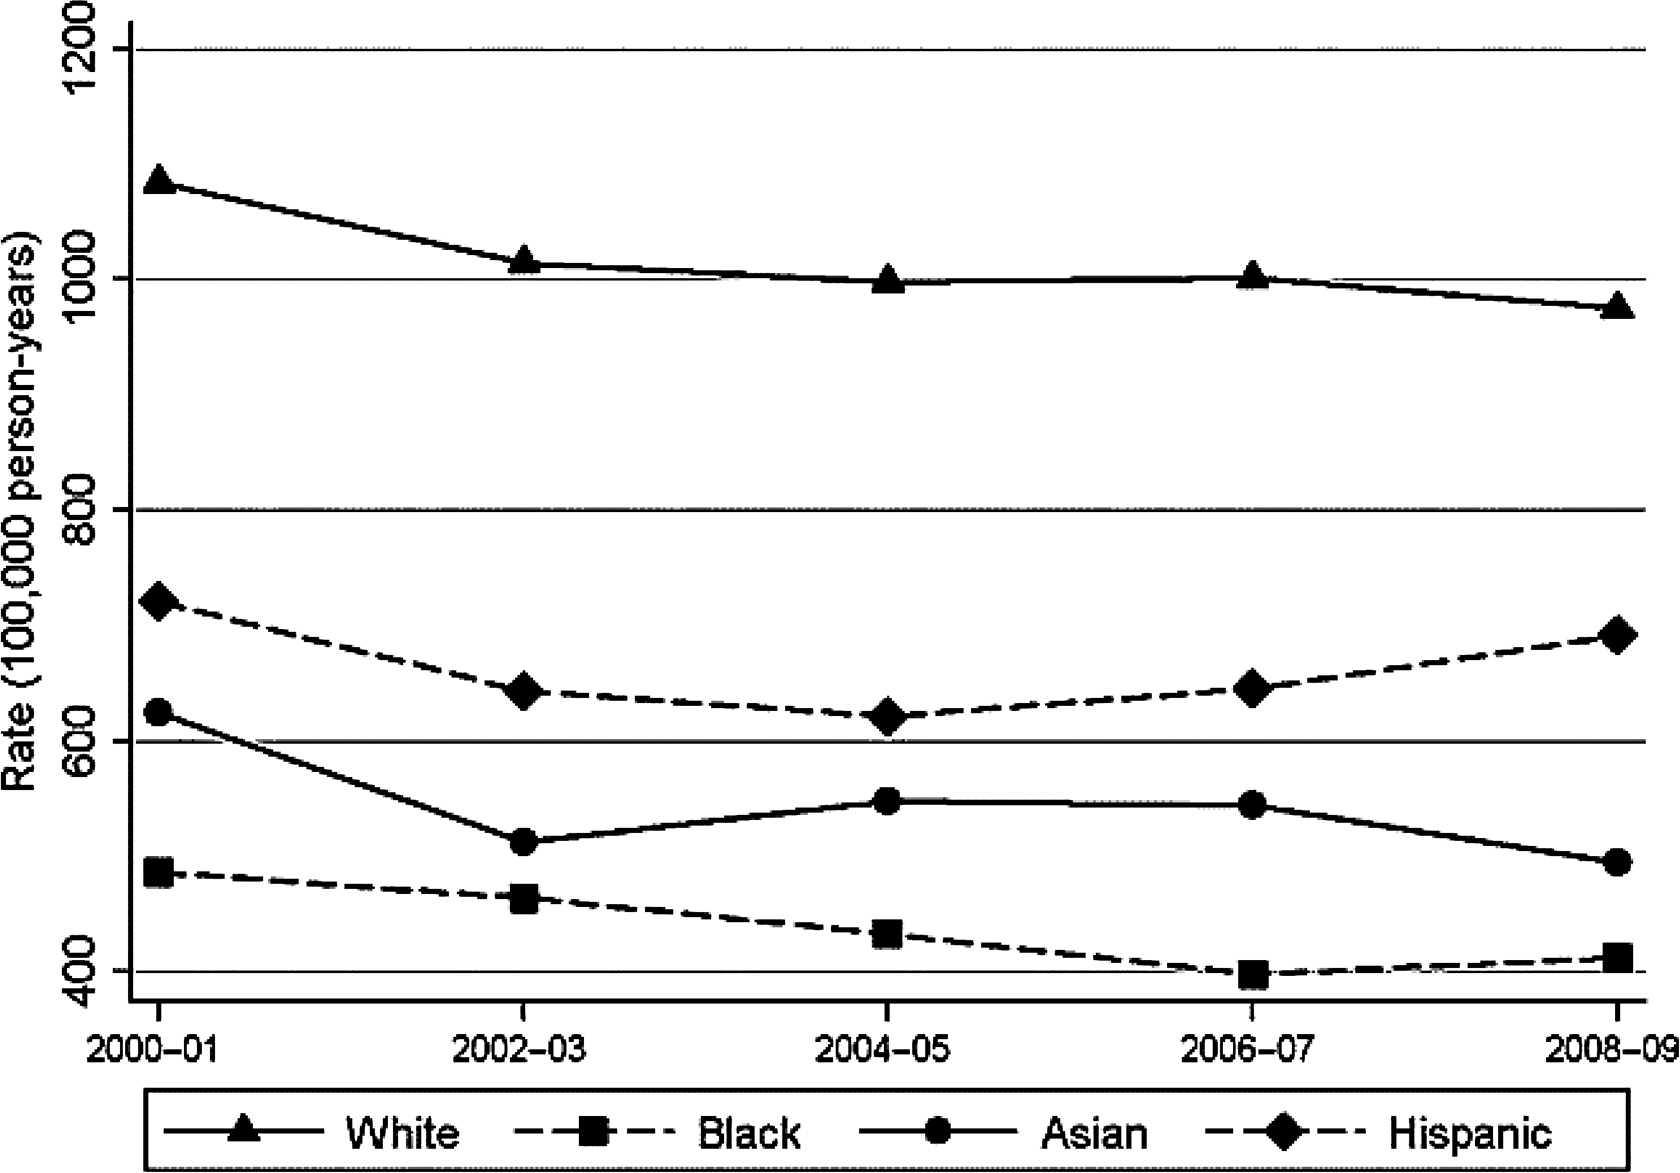
Most of these early papers reported rates of hip fracture by race from 1986 to 1993 . To our knowledge, the most recent data by race ethnicity are from 2000 to 2009 . Wright et al. updated hip fracture rates in the United States using data from a 5% sample of Medicare enrollees . Self-reported race/ethnicity was used based on social security administration records. A total of 821,475 women and 632,162 men were included in the analysis each year. As shown in Table 19.1 , rates were highest in white women followed by Hispanics, Asians, and Blacks. For men, rates were highest in Whites, followed by Hispanics, Blacks, and Asians. Using data from 2008 to 2009, the rate ratio of hip fracture compared to white women was 0.42, 0.51, and 0.71 and compared to white men, 0.67, 0.50, and 0.81 in Blacks, Asians, and Hispanics, respectively. A significant decreasing trend in hip fractures was observed among white men (8% decline) and women (14% decline), similar to a previous report from 1995 to 2005 . However, trends varied by race/ethnicity (see Figs. 19.1 and 19.2 ). Declines were more modest for non-Caucasians overall but separate examination by age revealed significant declines in hip fracture in White (−24.5%), Black (−23.8%), and Asian (−21.6%) women age >75 years. Results were similar in men, although the declines were smaller: Whites (−13.3%), Blacks (−20.7%), Asians (−31.8%), and Hispanics (−5.7%). The declines were statistically significant for white women, black women, and white men age 75 years or older. Unlike a previous report from California , hip fracture rates in Hispanics were not increasing. These decreasing trends may reflect increasing availability and use of osteoporosis therapies, and increasing emphasis on lifestyle (calcium/vitamin D/physical activity). In addition, the epidemic of obesity may also contribute.
| 5% Medicare sample | P Trend | |||||
|---|---|---|---|---|---|---|
| 2000–01 | 2002–03 | 2004–05 | 2006–07 | 2008–09 | ||
| Women | ||||||
| Whites | 1084.6 | 1014.8 | 998.6 | 1001.7 | 975.2 | 0.05 |
| Blacks | 485.6 | 463.9 | 432.6 | 397.3 | 411.7 | 0.22 |
| Asians | 624.2 | 512.3 | 547.2 | 543.8 | 494.4 | 0.17 |
| Hispanic | 720.8 | 643.1 | 621.3 | 645.0 | 691.2 | 0.72 |
| Men | ||||||
| Whites | 560.8 | 544.9 | 546.1 | 543.8 | 525.7 | 0.04 |
| Blacks | 400.7 | 364.0 | 341.3 | 372.9 | 353.3 | 0.28 |
| Asians | 277.6 | 295.5 | 207.8 | 185.1 | 262.0 | 0.42 |
| Hispanic | 418.8 | 379.0 | 396.2 | 421.9 | 424.9 | 0.46 |

Updated analysis of US Medicare claims data from 2002 to 2015 found that age-adjusted hip fracture rates declined from 2002 to 2012 but rates for 2013, 2014, and 2015 were higher than projected, resulting in 11,000 more hip fractures . These data suggest that the decline in hip fracture rates has stopped perhaps due to declines in BMD testing and dual-energy X-ray absorptiometry (DXA) availability . These authors did not report whether these patterns differed by race/ethnicity.
19.5
Hip fracture rate by immigration status
Many countries in Europe are experiencing increasing immigration . There is emerging data on fracture rates in immigrants compared to native born in the United Kingdom and Sweden . The UK data included over three million patients, age 30–100 years (50% men) in the derivation cohort, and reported the incidence of hip, distal, radius, vertebra, or proximal humerus fractures from 1993 to 2011. The Swedish data focus only on hip fracture and included men and women, age 50 years or older in Sweden between 1987 and 2001. The results of the two studies are summarized in Table 19.2 .
| Ethnicity/race | Incidence rate of major osteoporotic fractures | |
|---|---|---|
| White a | 255 (253, 257) | |
| Chinese | 200 (111, 290) | |
| Indian | 152 (129, 176) | |
| Other Asian | 145 (83, 206) | |
| Pakistani | 94 (69, 120) | |
| Black African | 77 (49, 105) | |
| Bangladeshi | 76 (40, 112) | |
| Caribbean | 61 (41, 81) | |
| Other ethnicity | 133 (101, 165) | |
| (B) Incidence rate of hip fracture per 100,000 person-years (95% confidence interval) in Sweden by different regions of birth; 5 years from immigration. | ||
| Regions | Women | Men |
| Swedish | 276 (271, 280) | 446 (439, 453) |
| Outside Sweden | 161 (150, 174) | 247 (231, 263) |
| Africa | 195 (77, 493) | 223 (113, 441) |
| Asia | 212 (164, 273) | 258 (209, 319) |
| Europe | 169 (154, 184) | 263 (243, 284) |
| Without Nordic countries | 130 (115, 147) | 218 (196, 241) |
| Other Nordic countries | 258 (230, 291) | 374 (334, 418) |
| North America | 182 (99, 335) | 293 (167, 515) |
| Former USSR | 163 (95, 277) | 200 (124, 323) |
| South America | 46 (22, 96) | 95 (56, 162) |
In the UK data, all immigrants had significantly lower major osteoporotic fractures, 25%–77% lower in comparison to Whites. Patterns were similar in analyses confined to hip fracture only. In the Swedish-born cohort, hip fracture incidence was almost twice that of immigrants. Hip fracture incidence rose slowly with time from immigration but remained significantly lower than that for Swedish-born individuals.
19.6
Ethnic differences in other fractures
Early data from Medicare/Medicaid showed lower distal forearm and proximal humerus fracture in Blacks compared to Whites . More recently, the incidence of nonspine fractures (per 100,000) was 1090, 580, 3170, and 1680 in white men, black men, white women, and black women, respectively, in subjects age 70–79 years . However, the number of fractures was very low in Blacks: 11 fractures in black men and 39 fractures in black women.
Among women enrolled in the WHI, clinical fracture rates per 100,000 were 2000, 900, 1300, 1200, and 2000 in Whites, Blacks, Hispanics, Asians, and American-Indians . In the National Osteoporosis Risk Assessment (NORA) study, individual fracture rates were not provided but the relative hazard ratios (HR) of fracture (95% CI) compared to Whites were Blacks, HR 0.54 (95% CI 0.41–0.72); Native Americans, HR 0.89 (95% CI 0.59–1.30); Hispanics, HR 0.91 (95% CI 0.72–1.15); and Asians, HR 0.41 (05% CI 0.21–1.79) .
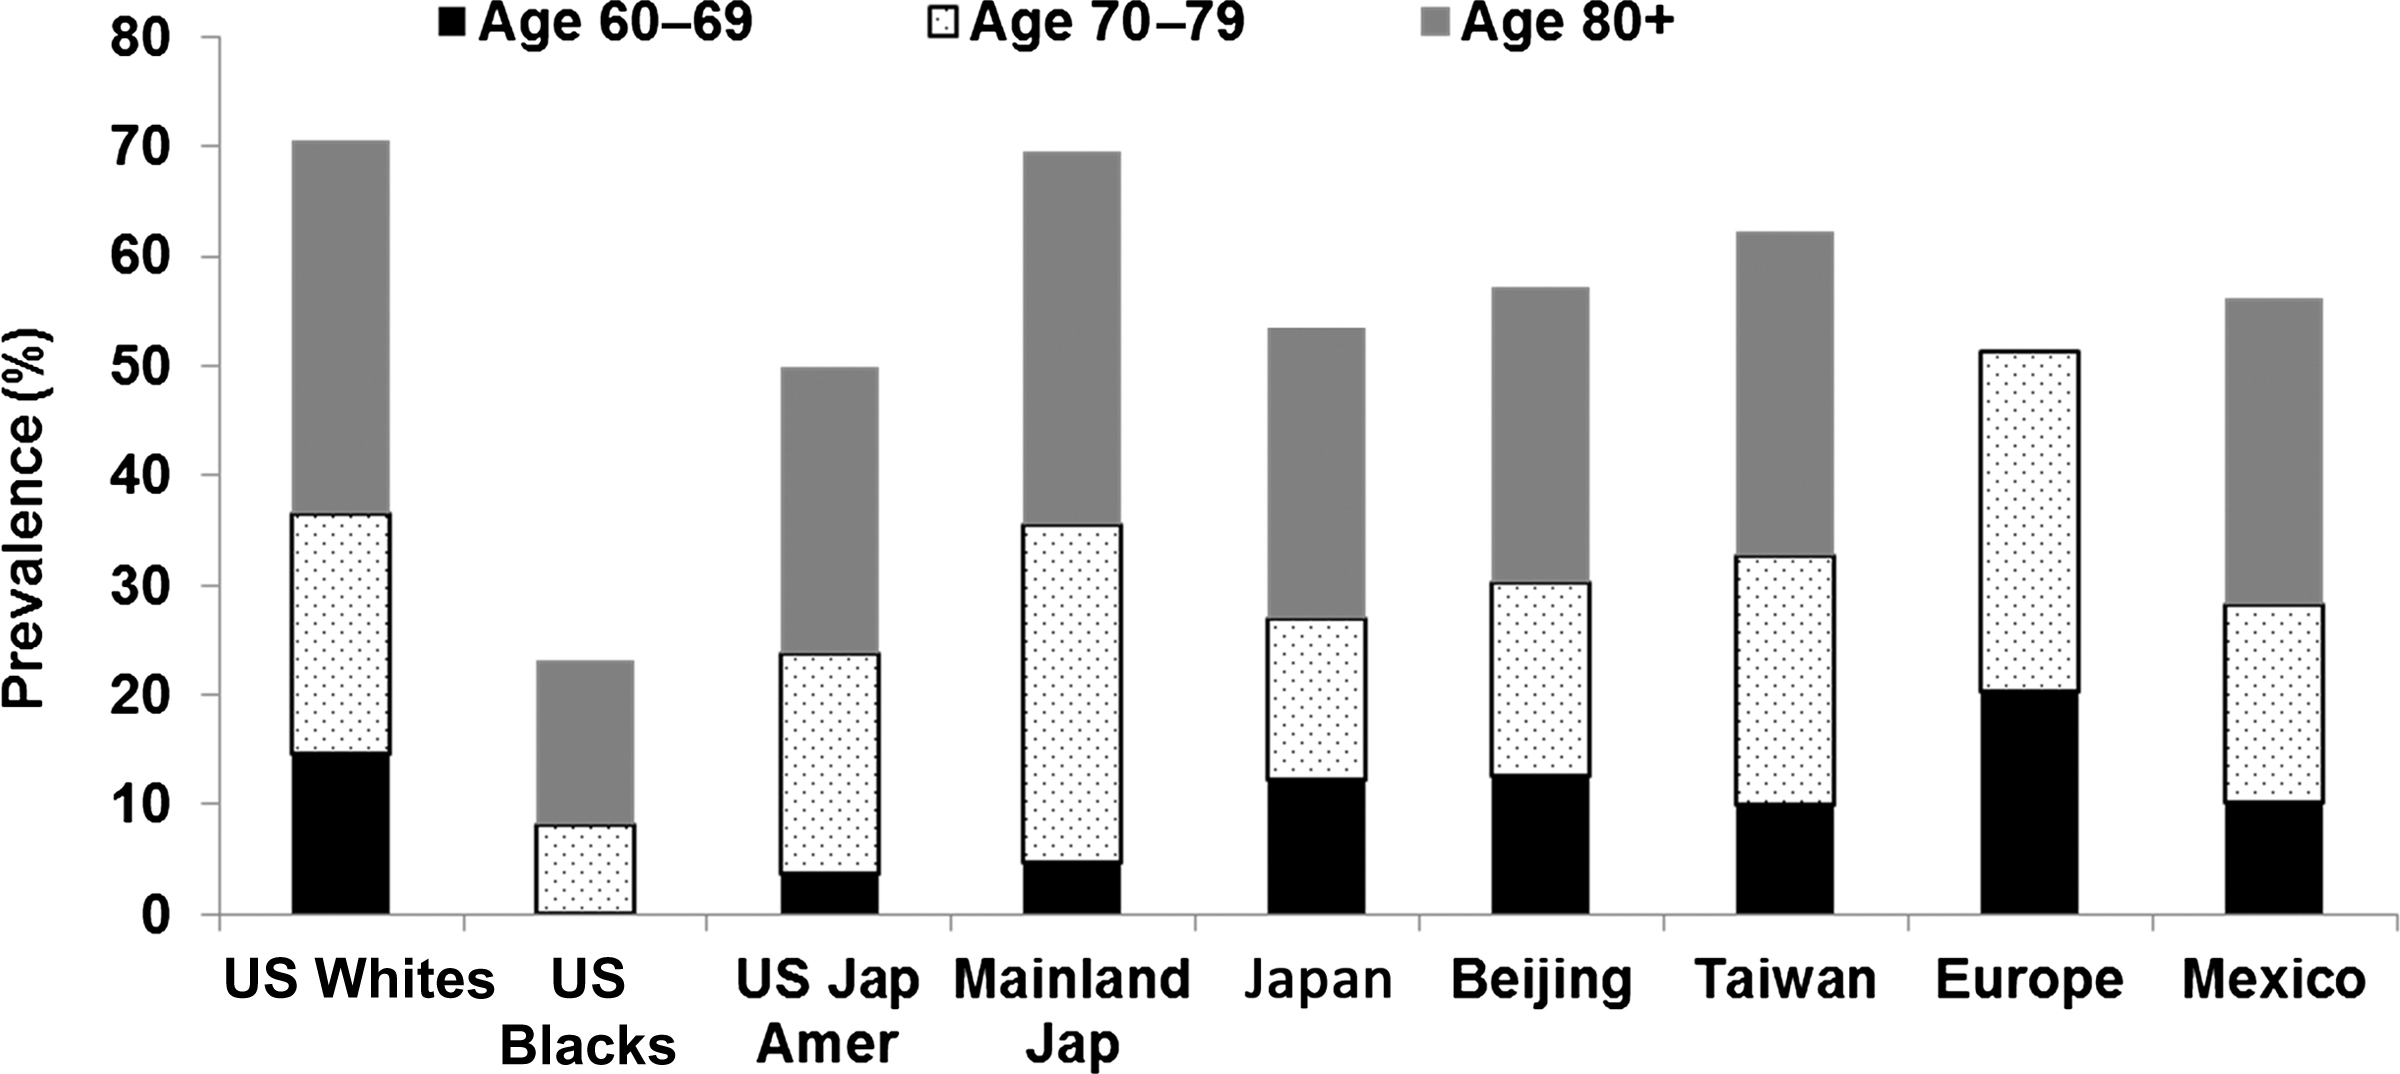
Medicare claims data from 2000 to 2005 were used to examine demographic factors associated with incident nonspine, nonhip fractures . ICD-9 coding and procedure coding were used to identify incident hip, spine, distal radius, ulna, humerus, ankle, and tibia/fibula fractures. As shown in Table 19.3 , ratios were lowest for US Blacks for all sites except ankle and tibia/fibula fractures that were lowest among Asian-Americans. A recent report from the Osteoporotic Fractures in Men Study (MrOS) reported no race/ethnicity differences in wrist fracture, but ethnic minorities accounted for only 10% of the cohort and power were low . Radiographic vertebral fractures, the most common osteoporotic fractures show much less variability in women by race/ethnicity and geography ( Fig. 19.3 ). US black women have the lowest prevalence but the prevalence is similar in Japanese, Chinese, and Mexican women. It is important to note that different methodologies and definitions were used to define morphometric fractures across these studies.
| Hip | Spine | Distal radius/ulna | Humerus | Ankle | Tibia/fibula | |
|---|---|---|---|---|---|---|
| Whites | 1.0 | 1.0 | 1.0 | 1.0 | 1.0 | 1.0 |
| Asians | 0.61 (0.56–0.68) | 0.80 (0.73–0.88) | 0.63 (0.54–0.74) | 0.52 (0.43–0.63) | 0.37 (0.28–0.49) | 0.45 (0.31–0.65) |
| Blacks | 0.46 (0.44–0.48) | 0.25 (0.24–0.27) | 0.32 (0.30–0.35) | 0.36 (0.33–0.39) | 0.67 (0.62–0.72) | 0.88 (0.79–0.97) |
| Hispanics | 0.68 (0.63–0.74) | 0.69 (0.63–0.76) | 0.90 (0.81–1.01) | 0.74 (0.64–0.84) | 0.74 (0.63–0.88) | 0.94 (0.76–1.17) |
| Other | 0.83 (0.77–0.90) | 0.74 (0.67–0.80) | 0.69 (0.60–0.79) | 0.72 (0.62–0.84) | 0.58 (0.48–0.71) | 0.81 (0.63–1.04) |
In summary, many studies of racially diverse populations in the United States have consistently reported higher rates among Whites than among other racial and ethnic groups. Rates among US Hispanics are intermediate between the lower US black rates and the higher white rates . The analysis of Medicare data for individuals age 65 years and older found that age-adjusted hip fracture incidence rates were lower for all Asian groups (Chinese, Japanese, and Korean-Americans) than for Whites .
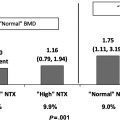
Of interest are racial and ethnic differences with respect to the magnitude of the female:male ratio of hip fracture incidence rates, which usually exceeds two in NHW populations. Among black Americans, hip fracture is more common among women than men; however, the female:male ratio is usually below 2. In the studies conducted in Hispanic populations, the gender ratio is close to 2 . All studies but two in Asian populations demonstrate a higher incidence of hip fracture in Asian women than men, with two studies reporting female:male ratios that exceed 3.0 . In the 2012 report using Medicare data the female:male ratio in hip fracture was 1.86 for Whites, 1.16 for Blacks, 1.89 for Asians, and 1.62 for Hispanics .
Increasing age is an established risk factor for hip fracture in all racial and ethnic groups. An excellent albeit old review of differences in age-specific incidence rates of hip fracture between racial and ethnic groups is provided by Maggi et al. . Although hip fracture incidence increases with age in all ethnic groups, the increase occurs earlier in NHW populations than in US black, Asian, and Hispanic populations . Studies conducted in NHW populations report higher rates of hip fracture among men than women before 50 years of age, whereas after age 50 years, women have higher rates than men.
Environmental lifestyle factors, such as urbanization, diet, level of physical activity, obesity, frequency of cigarette smoking, alcohol intake, and use of hormonal medications, may explain some of the differences in hip fracture incidence observed between racial and ethnic groups. Factors that may contribute to racial and ethnic differences in skeletal health and risk for hip fracture are discussed in the remainder of this chapter.
19.7
Ethnic patterns in bone strength measures
The term “bone mass” can refer to a variety of measurements, including bone mineral content (BMC; in g), areal BMD (aBMD; in g/cm 2 ), and volumetric BMD (vBMD; in g/cm 3 ), although strictly the term should be used only when referring to total BMC. The magnitude of ethnic differences in bone mass reported by various investigators varies with the measurement used as well as other factors. The most important of these is body size (especially body weight), as bone size and therefore bone mass vary directly with body size. Many interethnic and interracial studies in adults do not adjust for differences in body stature, making comparisons difficult.
19.7.1
Areal bone mineral density
The most widely studied interethnic comparisons have been between US black women and white women using NHANES data. US Blacks have significantly greater femoral neck and lumbar spine aBMD than Whites , which is thought to contribute to their lower rate of hip fracture. MAs had significantly lower spine aBMD compared to Whites , but higher femoral neck aBMD . MAs were more likely to have osteoporosis defined by T-score at one skeletal site (lumbar spine or femoral neck) but not the other . Estimates of the 2010 prevalence of US residents with osteoporosis and low bone mass at either the femoral neck or lumbar spine showed a prevalence of osteoporosis of 15.8%, 7.7%, and 204% in NHWs, Non-Hispanic Blacks (NHB), and MA women, respectively. The prevalence of osteoporosis among men was 3.9%, 1.3%, and 5.9% among NHW, NHB, and MA men, respectively. The prevalence of low bone mass in women was 52.6%, 36.2%, and 47.8% and in men 36.0%, 21.3% and 38.3% in NHW, NHB, and MA, respectively . Despite the heterogeneity among Hispanic populations, the higher prevalence of osteoporosis among MA was confirmed in a study of Puerto Rican older adults .
Differences in femoral neck BMD in US adults were compared between NHANES III, 1988–94 and NHANES, 2005–08 . Femoral neck BMD was higher in NHANES 2005–08 than in NHANES III in NHW women (6%), NHB women (1%), MA women (4%), NHW men (2%), and NHB men (2%) but not MA men (−2%). Adjusting for factors that could contribute to these factors [body mass index (BMI), height, weight at age 25 years, smoking, health status, use of osteoporosis therapies, total calcium intake] yielded mean femoral neck aBMD that was similar in the two surveys for men but remained statistically significantly higher in white women in NHANES 2005–08.
In a large cohort ( n =197,848) of community-dwelling postmenopausal women, US black women had the highest aBMD and Asian women had the lowest. After adjustment for aBMD, weight, and other covariates, white and Hispanic women had a similar risk for fracture, with US Black and Asian-Americans having a 50% and 70%, respectively, lower relative fracture risk compared to white women . The study concluded that ethnic differences in aBMD are strongly influenced by weight and that fracture risk is strongly influenced by aBMD.
It has been hypothesized that the higher aBMD seen in US Blacks stems in part from genetic factors. However, the US black gene pool is very heterogeneous and is the result of much admixture over several centuries. It might be assumed that any population of African origin would have a high bone mass similar to US Blacks, but this has not been borne out. Investigations of black people in South Africa and Gambia have shown that their aBMD at most sites does not exceed and, in some cases, is lower than that of age-matched African white people. After correcting for differences in body size, black South African women have similar aBMD at the mid-shaft radius and lumbar spine as South African white women, but femoral neck aBMD is increased in the former. These results are similar to those obtained in a small study of Gambian men . This pattern has also been found in young South African adult men and women, Somali women , and in prepubertal South African children , suggesting that the increased aBMD at the femoral neck in black people in Africa might have a genetic origin. Of interest are the histomorphometric studies of iliac crest biopsies in South African adults, which have shown that South African black adults have thicker trabeculae than white adults . We have shown that femoral neck aBMD was 10% and 20% higher in older (ages 50 years or greater) African-Caribbean males compared to US NHB and NHW males (NHANES III), respectively . Similarly, femoral neck aBMD was 10%–25% higher across all age-groups in Afro-Caribbean women compared to US NHB and white women, respectively . These data suggest on a population level that Afro-Caribbean men and women have the highest aBMD reported to date. We limited our studies to Afro-Caribbean individuals with four grandparents of African heritage. Hence, their higher aBMD in comparison to Black Americans may reflect lower European admixture. European admixture is approximately 25% among US Blacks compared to only 6% in Tobago . A higher European admixture among US Blacks has been associated with lower aBMD . Another potential contributor to the higher aBMD among Afro-Caribbeans is the lack of urbanization and more active lifestyles. These data illustrate the difficulty in generalizing about a “racial” group, when obviously ethnic gradations in bone mass exist within people of African descent, with further differences introduced by acculturation in areas to which black Africans migrated.
We further compared aBMD in African-American, Afro-Caribbean, US Hispanic, US Asian, Hong Kong-Chinese, and South Korean men . In age-adjusted analyses, Afro-Caribbean (8%–20%) and African-American (6%–11%) men had higher total hip femoral neck and lumbar spine aBMD, while US Asians, Hong Kong-Chinese, and South Korean men had lower aBMD than Whites. However, after additional adjusting for weight and height, the differences in BMD among the Asian groups compared to Whites were no longer significant. In women the Afro-Caribbeans, African-American, Hong Kong-Chinese, and South Korean all had significantly higher aBMD at all three BMD sites compared to Whites .
Hispanics have lower hip fracture incidence rates compared to Whites, yet they have BMD lower than NHW in NHANES ; Asian-Americans demonstrated a similar relationship, that is, lower BMD but a lower risk of fracture . Few studies investigating bone health in Native American tribes exist . Unadjusted mean spine BMD did not differ between a random sample of NHW women and American-Indian/Alaskan Native women enrolled in the WHI . However, there was a significant interaction of race by BMI on spine ( P =.003) and whole body ( P =.0003) aBMD; thus analyses were stratified by BMI. Overweight American-Indian/Alaskan Native women had slightly lower adjusted mean whole body and spine BMD than overweight NHW women (whole body: 0.97 vs 1.03 g/cm, P =.02; spine: 0.96 vs 1.03 g/cm, P =.001). Among extremely obese (BMI≥40.0 kg/m) women, adjusted mean total hip aBMD was higher in American-Indian/Alaskan Native women (1.07 vs 0.97 g/cm, respectively, P =.03). BMD was, however, lower in Navajo women across BMI categories .
A number of other studies comparing different ethnic groups in various countries have been performed. Pakistani men and women living in Norway were found to have slightly higher aBMD than ethnic Norwegians at the forearm after adjusting for differences in height . In Singapore, Indian women (age 45–69) had higher femoral neck BMD compared to Chinese and Malay women. However, after adjustments for age, BMI, and height, Chinese women had higher lumbar spine aBMD than Malay and Indian women .
aBMD may not be the factor that best predicts fracture risk in many racial and ethnic groups. At every BMC, BMD, or BMAD level, the absolute incidences of nonspine fracture were 30%–40% higher in white women compared to black women . The relative risk (RR) of fracture in black women versus white women was 0.36 (95% CI 0.28–0.47); adding femoral neck BMD attenuated the RR by about 33% to 0.49 (95% CI 0.38–0.64), suggesting that BMD accounts for about one-third of the lower fracture rates observed in black women. A 1 standard deviation (SD) decrease in femoral neck BMD was associated with a 37% increased risk of fracture in black women (RR 1.37; 95% CI 1.08–1.74) and a 49% increase in fracture in white women (RR 1.49; 95% CI 1.40–1.58). Adjustment for body weight and other risk factors for fracture weakened the association between BMD and fracture, especially among black women: multivariate-adjusted RR per 1-SD decrease in femoral neck BMD for black and white women, respectively (RR 1.20; 95% CI 0.93–1.55 and RR 1.42; 95% CI 1.32–1.52).
Within the WHI, we were able to expand our study of ethnicity and fracture to include other ethnic groups . The age-adjusted HR for clinical fracture in comparison to white women was 0.51 in Blacks, 0.64 in Hispanics, 0.59 in Asians, and 1.03 in American-Indians ( Table 19.4 ). Further adjustment for many risk factors, including age, height, weight, fracture history, and hormone therapy (HT) use, had little effect on the HR for fractures among Blacks, Hispanics, Asians, and Native Americans compared to Whites. In the subgroup of women with aBMD measurements, the lower risk of fracture among Hispanic and US black women was independent of aBMD, but there was some attenuation suggesting that BMD accounts for a proportion of the lower fracture rates in both Hispanics and US black women.
| Ethnicity | ||||
|---|---|---|---|---|
| Black | Hispanic | Asian/Pacific Islander | American-Indian | |
| Total population ( n =159,579) | ||||
| Age-adjusted | 0.51 (0.48–0.54) | 0.64 (0.59–0.70) | 0.59 (0.53–0.65) | 1.03 (0.85–1.25) |
| MV-adjusted a | 0.51 (0.47–0.55) | 0.67 (0.60–0.74) | 0.66 (0.59–0.74) | 0.95 (0.75–1.20) |
| BMD cohort ( n =12,705) | ||||
| Age-adjusted | 0.51 (0.48–0.54) | 0.64 (0.59–0.70) | – | – |
| MV-adjusted a | 0.51 (0.47–0.55) | 0.67 (0.60–0.74) | – | – |
| MV+total hip BMD | 0.65 (0.53–0.80) | 0.75 (0.57–0.99) | – | – |
| MV+lumbar spine BMD | 0.56 (0.45–0.69) | 0.73 (0.56–0.97) | – | – |
a MV models: adjusted for age, years since menopause, education, living with a partner, height, weight, caffeine intake, smoking, fracture history, parental fracture history, falls, current hormone therapy use (>5 year), corticosteroid use (>2 year), sedative/anxiolytics use, arthritis, depression, health status, and parity. BMD: bone mineral density.
In NORA the odds of osteoporosis by BMD (peripheral devices) relative to white women after adjusting for weight, age, education, health status, years since menopause, estrogen use, smoking, corticosteroid use, exercise, and alcohol intake were 0.55 (95% CI 0.48–0.62) for black women, 0.96 (95% CI 0.81–1.14) for Native American women, 1.20 (95% CI 0.19–1.32) for Hispanic women, and 1.05 (95% CI 0.88–1.25) for Asian women . These data on Hispanic women differ from NHANES III, but NHANES III data were unadjusted. The similar prevalence of osteoporosis in Native Americans and white women is consistent with the WHI data showing similar fracture rates in these two groups .
19.7.2
Quantitative computed tomography
Kleerekoper et al. showed that vBMD measured by quantitative computed tomography (QCT) is 40% higher in US black women than white women and considerably greater than the 5%–15% difference in aBMD generally reported for US black versus white adults. Similar results were reported for men . In men, femoral neck aBMD was similar in white and Asian men, but trabecular vBMD of the proximal femur was about 30% higher in Asian men compared to white men . Older black and Asian men had other features of the proximal femur that may increase bone strength, including thicker cortices. Similar findings were reported for Chinese-American women . Using high-resolution peripheral QCT (HRpQCT), US Chinese women had higher trabecular and cortical vBMD, greater trabecular bone-to-tissue volume, greater cortical thickness, and lower total bone area but similar aBMD. Similar findings were reported for Chinese women in Australia . The greater cortical thickness and trabecular vBMD could explain at least part of the paradox of lower hip fractures in Asians despite similar or lower aBMD.
Peripheral QCT in rural Southern Indian men showed reduced biomechanical indices of bone strength compared to US Caucasian and Afro-Caribbean men . In a study from the United Kingdom, South Asian men had smaller cross-sectional area, lower cortical strength–strain indices compared to Whites. The South Asian men were of Pakistani, Bangladeshi, or Indian descent, and thus, results were generally consistent with the data on the rural South Indian men . Global demographic trends show dramatic increases in population aging, especially in developing countries. The lower bone strength among rural South Indians suggests an underlying higher risk of fractures and greater future fracture burden.
19.7.3
Trabecular bone score
Trabecular bone score (TBS) was developed as an indirect measure of vertebral bone microarchitecture derived from texture analysis of spine DXA scans and has been shown to predict fracture independent of aBMD . The Fracture Risk Assessment tool, FRAX has also incorporated TBS into its fracture probability algorithm . As it is based on lumbar spine DXA scans, the TBS may be influenced by degenerative changes in the spine and by body composition, thus care must be taken when interpreting TBS measurements.
Notably, there is little and conflicting information on race/ethnic differences in TBS. The best data come from NHANES because it is a large sample and representative of US adults . TBS declined cross-sectionally by age in each race/ethnic group in both men and women. However, there were significant age×sex and sex by race/ethnicity interaction, Table 19.5 .
Related posts:
 Osteoclast biology
 Biomechanics of hip and vertebral fractures
 Clinical and epidemiological studies: skeletal changes across menopause
 Diabetes, diabetic medications, and risk of fracture
 Relationship between periodontal disease, tooth loss, and osteoporosis
 On the evolution and contemporary roles of bone remodeling
Stay updated, free articles. Join our Telegram channel

Full access? Get Clinical Tree


