Principles of Pharmacokinetics
Jerry M. Collins
Jeffrey G. Supko
It is generally accepted that the biologic effects of a drug are related to the time course of the concentration of the administered compound or an active metabolite in the bloodstream. The realization of this association has evolved through advances in the discipline of pharmacokinetics. This discipline is defined as the study of rate processes involved in the absorption of drug from the administration site into the bloodstream, its subsequent distribution to extravascular regions throughout the body, and its eventual elimination from the body. From a broader perspective, pharmacokinetics may be thought of as the effect that the body has on a drug, whereas the pharmacologic effects that a drug has on the body are the realm of pharmacodynamics (PDs).
In anticancer chemotherapy, the general goal of killing tumor cells or inhibiting their proliferation and metastasis is clearly defined. However, in most cases, we are severely limited by an inability to deliver drugs in a manner that separates antitumor effects from normal tissue toxicity. Much remains to be learned about the exploitable differences between normal and tumor tissues. Thus, although pharmacokinetics is a tool that can be used to evaluate the feasibility of a drug delivery strategy based on intended pharmacodynamic effects, it does not replace knowledge of exploitable differences between host and tumor.
Studies to characterize the pharmacokinetic behavior of a drug have become integral to the preclinical and clinical development of new anticancer agents. One group1 has even suggested that “it is now inconceivable to perform clinical research in cancer chemotherapy without obtaining adequate pharmacokinetic data.” The objectives for undertaking a pharmacokinetic study in the context of a phase I or II clinical trial in cancer patients include (a) initial characterizing of the pharmacokinetic behavior of new chemotherapeutic agents in humans, (b) assessing whether or not an administration schedule provides a potentially effective pattern of systemic exposure to drug, (c) determining the magnitude of intrapatient and interpatient variability in pharmacokinetic parameters, (d) assessing the influence of patient characteristics on drug disposition, (e) establishing predictive correlations between biologic effects and pharmacokinetic parameters, and (f) determining whether combining drugs results in pharmacokinetic interactions. In addition, pharmacokinetic drug level monitoring has been used to improve therapy through dose individualization, to evaluate patient compliance during chronic therapy, and to assess whether alterations in drug disposition or metabolism are associated with the development of toxicity or the lack of effect.
The fundamental obstacle to greater success in the application of pharmacokinetics and clinical drug level monitoring to anticancer therapy is our limited knowledge of pharmacodynamics. A complete understanding of the actions of a drug necessarily requires discerning the nature of the association between its pharmacokinetic behavior and pharmacodynamic effects. Relationships between pharmacokinetics and the severity of toxicity have been established for many anticancer drugs. However, pharmacokinetic associations accounting for the therapeutic effects of a chemotherapeutic agent are more difficult to establish because of the multiplicity of factors involving the host and tumor that influence response, as noted above, as well as the time lapse from initiating treatment to the first indications of a therapeutic response. In succeeding chapters, these relationships are discussed for individual agents. Nevertheless, elucidating the pharmacokinetic behavior of an anticancer drug may benefit efforts to determine the dose, route of administration, and schedule that maximize the therapeutic potential while minimizing serious toxic effects.
The intention of this chapter is to provide readers with a fundamental understanding of clinical pharmacokinetics and its practical application to the development and use of anticancer chemotherapy. Numerous texts with widely varying levels of complexity and focus are available for those interested in a more comprehensive discourse of the subject, ranging from easily understood introductions to the discipline2 to more advanced texts with a mathematical approach.3
Acquisition and Analysis of Pharmacokinetic Data
Sample Collection and Drug Concentration Measurement
Pharmacokinetic studies involve collecting serial specimens of blood and other biologic fluids, such as urine, at predetermined time intervals from subjects following administration of the drug. Plasma is the blood component in which drugs are most commonly measured during pharmacokinetic studies, although determinations are also made in serum and, less frequently, in whole blood. The concentration of drug present in the study samples is measured using an appropriate bioanalytical method. Technical advances in separation and detection methods, especially the maturation of high-performance liquid chromatography coupled to mass spectrometry into a technique suitable for routine use, have provided a greatly improved basis for drug concentration measurement during the past decade. Review articles surveying the current techniques used for assaying drugs in biologic fluids regularly appear in the literature.4
Many anticancer drugs are difficult to measure because of inherent instability, either spontaneously degrading in solution or being degraded by enzymes in blood or tissues. It is therefore important to recognize that the quality of data derived from any pharmacokinetic study ultimately depends on the reliability of the assay used to measure the drug as well as the manner by which samples were processed and stored prior to analysis. The majority of bioanalytical methods used for pharmacokinetic studies measure the total concentration of drug, that is, free drug plus that which is reversibly associated with plasma proteins. However, the reversible binding of a drug to plasma proteins, such as albumin and α1-acid glycoprotein, needs to be considered in the interpretation of total drug concentrations.5 Only the free or unbound drug is pharmacologically active. Protein binding is usually assessed experimentally by ultrafiltration or equilibrium dialysis.
The Plasma Concentration-Time Profile
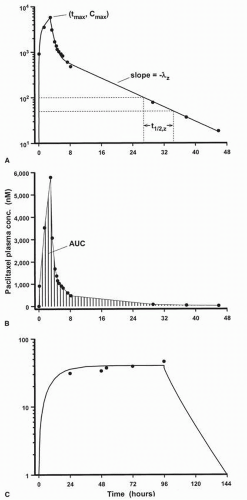
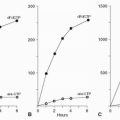
Except for cases in which a drug is given by bolus intravenous injection, the plasma concentration-time (C × T) profile of any drug exhibits an initial region of increasing concentration, the achievement of a peak or maximum concentration (Cmax), followed by a continual decline in concentration (Fig. 4-1A). The concentration of drug in plasma increases as long as the rate of input into systemic circulation exceeds the rate of loss due to distribution into other extracellular fluids, intracellular spaces, and tissues throughout the body, and elimination from the body. The Cmax is achieved when the rate of drug input is equivalent to the rate of loss from plasma, a time point that occurs at the instant that an intravenous injection or short infusion is terminated. During a continuous intravenous infusion, plasma levels of the drug increase at a progressively decreasing rate and eventually become constant, indicative of achieving steady-state conditions, if the infusion is continued for a sufficiently long time (Fig. 4-1C).
Figure 4-1 shows the same C × T data plotted on graphs with semilog axes (panel A) and rectangular coordinate axes (panel B). Presenting pharmacokinetic drug C × T profiles on semilog graphs provides a better visual depiction of the entire data set than a coordinate plot because plasma levels of a drug frequently differ by several orders of magnitude during the course of the observation period. Furthermore, the concentration of many drugs in systemic circulation decays in an apparent first-order manner, exemplified by a terminal region in the plasma profile in which the logarithm of the drug concentration is a linear function of time. Thus, a semilog plot provides some immediate inferences regarding the nature of the pharmacokinetic behavior of a drug.
The pattern of decay in the plasma concentration of a drug that exhibits first-order kinetics comprises one or more exponential phases. In the case of a plasma profile with drug concentrations that decline in a single log-linear phase, the entire body appears to be kinetically homogenous. In this case, the equilibrium of the drug between plasma and other fluids or tissues into which it distributes is very rapidly achieved, before the first blood specimen has been acquired. Polyexponential behavior results from distinguishable differences in the reversible transfer of drug from plasma to various regions or compartments of the body. Thus, for example, the presence of two exponential decay phases implies that the body behaves as if it is composed of two kinetically distinct compartments: the
first comprising plasma and tissues with which equilibrium is rapidly established and the second “deeper” compartment comprising all other regions of the body into which drug distributes more slowly.
first comprising plasma and tissues with which equilibrium is rapidly established and the second “deeper” compartment comprising all other regions of the body into which drug distributes more slowly.
For some purposes, a mathematical equation or model is necessary to interpret pharmacokinetic data, but often questions may be answered without a formal model construction. Recently, there has been a growing trend toward analyzing pharmacokinetic data by empirical approaches that consider only the concentration of drug in the sampled fluid and require few assumptions about model structure. In these techniques, which include model-independent analysis6 and noncompartmental analysis,7 the various exponential decay phases are usually referred to simply as the initial, intermediate, and terminal disposition phases. Regardless of the particular method of analysis employed, the ultimate objective is the same, which is to estimate values of descriptive pharmacokinetic parameters from the C × T data.
Physiologic Pharmacokinetic Models
For pharmacologists interested in developing an understanding of drug disposition in individual tissue compartments, models that incorporate physiologic compartments are of considerable interest. These models require measurements of actual physiologic parameters, such as volumes and blood flow rates, as well as drug concentrations in various compartments, and therefore are based primarily on data from experimental animals. Entry into specific areas such as the central nervous system may be of critical importance in the use of drugs, and physiologic models can allow comparisons of C × T profiles for various schedules and routes of administration. Physiologic models have been constructed for many anticancer drugs. Models have been published for the most important drugs in clinical practice, among which are methotrexate (MTX),8 5-fluorouracil (5-FU),9 cisplatin,10 and doxorubicin.11
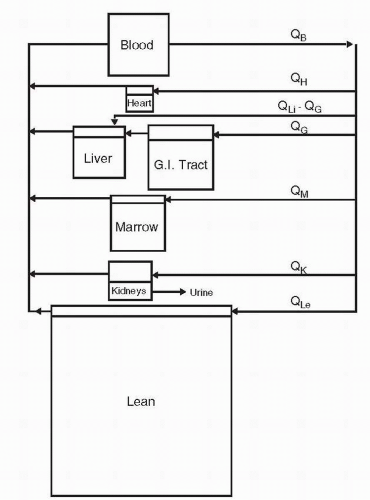
In the most general form, physiologic pharmacokinetic models are overly complex and require too large a database for routine clinical use. However, they provide a basis for understanding a drug’s kinetic behavior that can be incorporated into simpler models, either physiologic or hybrid, assimilating both empiric observations and physiologic information. Physiologic modeling goes beyond the usual goals of empiric pharmacokinetic modeling to allow for incorporation of data obtained in other species or in vitro. The compartments comprising a physiologic pharmacokinetic model have an anatomic basis, and the transfer processes in the model have a physiologic or pharmacologic identity. Each organ is modeled separately; then, the model connections are provided by blood flow. The structure for the physiologic model for cytarabine is presented in Figure 4-2.12
Pharmacokinetic Parameters
Area Under the Curve
Noncompartmental analysis is considerably simpler than any equation-defining method of pharmacokinetic data analysis. All calculations and data manipulations can be performed by most spreadsheet software programs. The observed plasma C × T data are numerically integrated, most commonly by the trapezoidal method. In its simplest application, each successive set of data points, beginning with time zero, is used to define a trapezoid, the area of which is readily calculated. The cumulative sum of the areas of all such trapezoids affords an estimation of the area under the C × T curve to the last sample with a measurable drug concentration ([Ct] AUC0→t). The slope of the terminal log-linear phase of the C × T profile (−λz) is then determined by linear regression using log-transformed concentration values (see Fig. 4-1A). The area under the curve from time zero to infinity (AUC) can then be calculated as
Although the AUC is not a pharmacokinetic parameter per se, because its magnitude depends on the administered dose of drug, it represents an important quantitative measure of total systemic drug exposure, as illustrated in Figure 4-1B. In addition, knowledge of the AUC is required to calculate values of pharmacokinetic parameters, as described in the following section.
Total Body Clearance
The total body clearance (CL) of a drug is formally defined as the volume of plasma from which drug is completely removed per unit time. It is readily calculated as

where Div is the dose of the drug given by intravenous injection or infusion. CL reflects the combined contribution of all processes
by which drug is removed from the body, as represented by the equation
by which drug is removed from the body, as represented by the equation

where CLR and CLNR designate renal and nonrenal clearance, respectively.13 Renal clearance is usually the only route of drug elimination that can be directly and quantitatively determined in patients by noninvasive procedures. All other mechanisms of drug elimination that cannot be readily estimated, including biliary excretion of unchanged drug, metabolism, nonenzymatic irreversible reactions with endogenous molecules, and spontaneous chemical degradation, are grouped together as CLNR. CL has units of volume per time (e.g., milliliters per minute, liter per hour) and is frequently normalized to the body weight or body surface area of subjects (e.g., milliliters per minute per kilogram, liter per hour per square meter) under the presumption of minimizing interpatient variability in the magnitude of the parameter. However, this practice has recently become a topic of considerable controversy because the underlying presumption of a relationship between unnormalized clearance values and body surface area does not exist for a significant number of anticancer drugs.14 The CL values are often compared with glomerular filtration rate and hepatic blood flow, average values of which are approximately 125 mL/min (4.6 L/h/m2) and 1,500 mL/min (56 L/h/m2), respectively, in normal adults.15,16 Although often informative, these comparisons can be extremely misleading unless the extent of plasma protein binding has been taken into account because only the free fraction of drug that is not bound to plasma proteins is usually subject to organ-mediated excretion or metabolism.
Apparent Volume of Distribution
The total body apparent volume of distribution, Vz, is strictly a proportionality constant relating the total amount of drug in the body to plasma concentration. It may be calculated by the equation

and has units of volume, typically expressed in terms of milliliters or liters normalized to body weight or body surface area (e.g., milliliters per kilogram, liters per square meter). Vz is designated as an apparent volume because it is a hypothetical value that is not directly related to any real physiologic space. Nevertheless, it is an informative parameter, providing an indication of the relative extent of drug distribution from plasma. Specifically, for a given amount of drug in the body, the fraction present in plasma decreases as its distribution into peripheral tissues increases, leading to greater values of Vz.17 Therefore, the effective lower limit of Vz is the plasma volume, which is approximately 4.5% of body weight (i.e., 45 mL/kg, 1.7 L/m2) for a normal adult. There really is no upper limit, as Vz can assume extremely large values in cases where the half-life of the terminal disposition phase is long relative to that of the preceding disposition phase, and drug levels decrease by several orders of magnitude before the terminal phase is achieved. For example, some anticancer agents, such as the anthracyclines, have Vz values exceeding 1,000 L/m2 (27 times body weight).
Biologic Half-life
The biologic half-life of a drug (t1/2,z) is the time required for its plasma concentration to decrease by 50% any time during the terminal log-linear phase in the C × T profile (see Fig. 4-1A). It is only applicable to drugs that exhibit apparent first-order pharmacokinetics (see later discussion). As indicated by the relationship,

t1/2,z reflects both the ability of the body to eliminate the drug as well as the extent to which the drug distributes throughout the body. Nevertheless, there is a recurrent tendency in the anticancer drug literature to place undue emphasis on the value of t1/2,z as an indicator of drug elimination. The t1/2,z has an important practical application in that steady-state conditions during administration of a drug by continuous intravenous infusion or a multiple dosing regimen are achieved when the duration of treatment exceeds four times the value of t1/2,z.
Linear and Nonlinear Pharmacokinetics
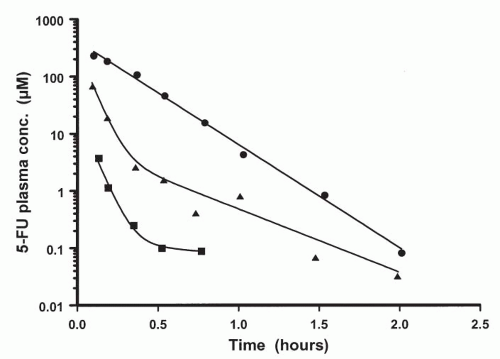
The majority of clinically used anticancer agents exhibit linear or first-order pharmacokinetics, whereby plasma concentrations of the drug decline in an exponential manner following intravenous administration. A distinguishing and defining characteristic of linear pharmacokinetics is that the plasma concentration of drug at a given time after dosing is directly proportional to the administered dose. Thus, the AUC increases proportionately with the dose and values of the pharmacokinetic parameters (i.e., CL, Vz) and are independent of the dose. When a drug is predominantly eliminated by a potentially saturable process, such as hepatic metabolism or active tubular secretion, departures from linear pharmacokinetic behavior may become evident if sufficiently high doses can be administered to patients. As illustrated in Figure 4-3, classic nonlinear pharmacokinetics is indicated by a change in the appearance of the plasma profile from exponential character at lower doses to the appearance of a distinct downward curvature in the semilog plot of the plasma profile at higher doses.18 In addition, the apparent CL exhibits a progressive decrease in magnitude as the dose is escalated. A clear
example of this phenomenon was reported recently for high-dose cytarabine given by continuous intravenous infusions in which small changes in the infusion rate produced disproportionately large increases in the steady-state drug concentration in plasma.19
example of this phenomenon was reported recently for high-dose cytarabine given by continuous intravenous infusions in which small changes in the infusion rate produced disproportionately large increases in the steady-state drug concentration in plasma.19
Drug Elimination
Renal and Hepatic Excretion
Establishing the major pathways of drug elimination in patients is also an important objective of clinical pharmacokinetic studies. Disease states that compromise the function of a major drugeliminating organ, such as the kidneys or liver, can enhance a patient’s sensitivity to the toxic effects of the drug as a result of increased drug exposure. For this reason, patients with significant organ impairment are usually excluded from initial phase I studies to avoid possibly confounding sources of toxicity.
Renal excretion is a quantitatively significant route of elimination for many relatively small compounds, with molecular weights less than about 300, that are also highly to moderately hydrophilic,20 if they are not substantially metabolized. Larger compounds and those with a more lipophilic character tend to be predominantly eliminated by biliary excretion, either directly or after metabolism. Determining CLR involves measuring the amount of unchanged drug present in the urine (Ae) collected during one or more defined time intervals (Δt) following intravenous drug administration. It may be calculated by either of the following equations
depending on whether urine has been continuously collected and pooled from the beginning of dose administration throughout the time that plasma specimens were obtained, or during one or more discrete time intervals after dosing. In the second equation, Cmid is the plasma concentration of drug at the midpoint of the urine collection interval. The amount of unchanged drug in feces cannot be taken as a direct indication of biliary excretion because of the potential for drug metabolism by the gastrointestinal microflora.21
In cases in which renal or biliary excretion is a significant pathway of drug elimination, a predictive correlation may exist between clinical indicators of renal or hepatic function, such as serum creatinine and bilirubin levels, respectively, and CL. Establishing these relationships serves as the basis for defining guidelines pertaining to the minimal organ function required for patient eligibility in phase II studies and devising an empirical algorithm for dosage adjustment, including those documented in Table 4-122 (see also “Organ Dysfunction and its Effect on Drug Clearance”).
Drug Metabolism
Metabolism represents a quantitatively important route of elimination for most anticancer agents. Xenobiotic biotransformation reactions may be broadly categorized into two classes, designated phase I and phase II. The principal phase I reactions are oxidation, reduction, and hydrolysis. Phase II reactions involve the conjugation or coupling of endogenous molecules, including glucuronide, sulfate, amino acid, methyl and glutathione moieties to the parent drug or a precursory phase I metabolite. Hepatic oxidation mediated by the cytochromes P450 (CYP450), a large family of heme-containing isozymes, undoubtedly plays the greatest overall role in drug metabolism among the phase I reactions.23 The CYP450 enzymes are most abundantly expressed in the liver, but they are also present in the kidney, lung, and gastrointestinal epithelium. The predominant enzyme in this family, CYP3A4, catalyzes the oxidation of a multitude of structurally diverse compounds.24, 25, 26 These include imatinib, gefitinib (and most other synthetic inhibitors of tyrosine kinases), docetaxel, etoposide, ifosfamide, vincristine, and paclitaxel. In addition to hepatic metabolism, some important phase I reactions are mediated by ubiquitous enzymes found in virtually
all tissues of the body, such as dihydropyrimidine dehydrogenase, which catalyzes the reduction of 5-FU, and cytidine deaminase, which inactivates cytarabine.27,28


all tissues of the body, such as dihydropyrimidine dehydrogenase, which catalyzes the reduction of 5-FU, and cytidine deaminase, which inactivates cytarabine.27,28
Stay updated, free articles. Join our Telegram channel

Full access? Get Clinical Tree


