- The challenge of optimal childhood nutrition is to match supply with demands throughout the period of growth and development, so that full genetic potential can be realised.
- Worldwide, about 9 million children die each year before reaching the age of 5. Malnutrition is considered to be a sole or contributory cause in about half of these deaths.
- Breast-feeding improves the health of mother and baby, even in industrialised countries.
- Childhood growth involves not only an increase in body size but changes in body proportions, the relative sizes of organ systems, and chemical composition.
- Nutrition has an important role to play in neurological, gastrointestinal, renal, and metabolic maturation.
- Growth monitoring is a fundamental tool in clinical paediatrics and child health surveillance. This necessitates the choice of an appropriate standard or reference.
- Growth faltering among young children in industrialised countries is most commonly the result of chronic energy deficiency arising from inappropriate care practices, rather than underlying physical disease or food shortage.
- A range of dietary products and delivery devices is now available for specialised enteral and parenteral nutritional support of sick children of all ages and sizes.
23.1 Introduction
‘Paediatrics’ is the treatment of disease during growth and development. As a clinical discipline it is inextricably linked to ‘child health’ – the promotion and maintenance of health in children. The child, or ‘paediatric patient’, varies enormously both in maturity and in size, from the 500 g 23-week-gestation neonate to the fully-grown adult. The challenge of optimal childhood nutrition is to match supply with demands throughout this period of age, so that full genetic potential can be realised. Failure to do so compromises the child’s health and chance of survival. It also strongly influences health in adult life.
Why are children nutritionally vulnerable?
Worldwide, about 9 million children die each year before reaching the age of 5. Malnutrition is considered to be a sole or contributory cause in about half. The particular vulnerability of children can be explained by considering influences which act on nutrient demand and supply.
Demands
Growth imposes metabolic demands during childhood. These are particularly high during infancy (the first year of life) and adolescence. Growth is not merely an increase in size. As children grow, their body proportions alter, reflecting maturation in body composition and changes in the partitioning of nutrients between organ systems. These events are developmentally programmed, so that the effects of supply failure depend to a large extent upon the age of the child. For example, severe energy restriction in early childhood, when the normal pace of growth is rapid and the brain is still developing, may never be recoverable. The end result is ‘stunting’, with associated impairment of cognitive development.
Supply
Failure of nutrient supply in children may be attributable to many causes. In the case of babies born too early, immaturity of the absorptive, metabolic, and excretory systems may constrain supply. In older children, illness (acute and chronic, somatic, or psychological) may both increase demands and deleteriously affect supply by reducing appetite or increasing losses. However, the most important factor is simply the availability of food. This is a key distinction between supply failure in children and adults. Adults can more often find the food they need, whereas young children (those with the highest demands) need others to find it for them. Where children are concerned, food shortage is not confined to resource-poor countries; it occurs even in industrialised nations as a result of parenting, educational deficiencies, and socioeconomic deprivation.
Imbalance of supply and demand
Children are more disadvantaged than adults when supply does not meet demand. The smaller the child, the smaller their nutrient stores, and the shorter the period they will last. Additionally, immaturity of the metabolic and excretory systems, coupled with the relatively high demands of essential organs (such as the brain), constrains the capacity for reductive adaptation. The reasons why children are nutritionally vulnerable are summarised in Box 23.1.
These points will be revisited in more detail at later points in this chapter.
Applications of nutritional science in paediatrics and child health
People practising in paediatrics and child health apply nutritional principles daily. Box 23.2 lists some examples relevant to practice in both industrialised and resource-poor countries. Advances in clinical nutrition have had a major impact on child survival globally; for example, well-controlled trials have shown that vitamin A supplementation in resource-poor countries can reduce mortality amongst preschool children by about 30%. In industrialised countries, improved techniques of nutritional support have greatly improved the survival of sick children, such as those born extremely early and those who develop chronic disease or intestinal failure.
- rate of growth;
- amount of metabolically active tissue (e.g. brain) per unit of body mass;
- occurrence of disease.
- immaturity of the absorptive, metabolic, and excretory systems;
- developmental stage (ability to forage and eat);
- neurological impairment;
- psychological disorder;
- social and educational disadvantage;
- effects of disease on appetite, ability to eat, etc.
- absolute body size;
- tissue composition (protein, fat, and water).
- primary prevention, e.g. breast-feeding, vitamin supplementation;
- secondary prevention, e.g. screening for iron deficiency or phenylketonuria (PKU).
- e.g. exclusion diets (coeliac disease, allergy), therapeutic diets (inborn errors).
- e.g. feeding the extremely low-birth-weight (<1000 g) baby, or treating sick infants and children with chronic illnesses.
Long-term relevance of paediatric nutrition
Optimising nutrition in early life is increasingly seen to have relevance to long-term health (Scientific Advisory Committee on Nutrition, 2011). Although many of the mechanisms still require clarification, epidemiological data clearly show that patterns of growth in foetal life and infancy are correlated with later risk of cardiovascular disease and the metabolic syndrome. Effects seem most marked amongst individuals whose early growth was severely restricted, but it is important to realise that there is in fact a gradation of risk right across the normal range of body size and shape observed in populations. Thus the potential later health dividends of providing optimal early nutrition could be considerable.
Figure 23.1 Model for promoting lifelong health throughoptimisation of early nutrition. Maximum functional capacity is achieved as a result of tissue growth and maturation during foetal life (black area) and childhood. Functional capacity then declines during adult life at a rate determined by health, lifestyle, and environmental factors, eventually crossing a ‘disability threshold’. The time taken to reach this point is partly determined by the height of the initial peak around adolescence.
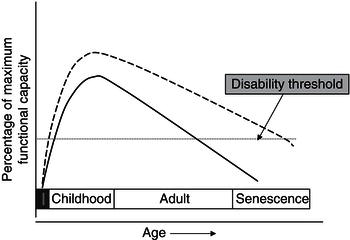
Figure 23.1 shows conceptually how early-life interventions could integrate with later (adult and old-age) interventions to improve health outlook with ageing. If functional capacity is maximised in the early years, the individual has a greater reserve from which decline begins in adult life. Such an approach acts synergistically with interventions in later life aimed at slowing the rate of decline. The effect of both is to prolong the period that elapses before functional capacity crosses a ‘disability threshold’. One example of such an effect might be bone health. Bone mass in later years might theoretically be optimised by attainment of peak bone mass during childhood and adolescent growth, coupled with measures (such as optimal nutrition and lifestyle) to slow decline in adult life.
23.2 Growth
Growth and physical and mental development are processes which distinguish children from adults. Physical growth involves an increase in both the size and complexity of body structure, occurring under genetic and endocrine regulation. The pattern of growth has a characteristic tempo which is disturbed if nutrient supply is inadequate or disease impairs nutrient uptake and utilisation. Therefore, growth monitoring is a key clinical tool in paediatrics and child health.
The process of growth has a number of corollaries for nutrient demands. First, depending on the child’s age, it is ‘expensive’. For example, in early infancy, when growth is most rapid, it may consume half the energy intake. Second, the partitioning of nutrients between organ systems also changes, because their relative size alters substantially with growth, affecting to some extent the balance of nutrient requirements.
Measuring growth: growth references and standards
The pattern of growth can be defined by measuring large numbers of children. Groups of children of differing ages may be measured at the same time (cross-sectional sampling) or a cohort of children may be measured at specified ages as they grow up (longitudinal sampling). The data obtained may be reproduced graphically in the form of growth charts or transformed into the properties of a normal distribution as z-scores (i.e. the number of standard deviations from the mean). The former are most commonly used for day-to-day clinical monitoring of individual children, whereas the latter are most widely used for handling population data. Weight, height (or length), and occipitofrontal circumference (OFC; head circumference) are most frequently measured in clinical practice, though references exist for other measures too, such as skinfold thickness, mid-arm circumference, knee–heel, and foot length. Cross-sectional charts may not adequately depict substantial inter-individual variations in normal growth patterns, particularly during infancy and at adolescence. This observation has clinical implications and is further discussed later.
A key question when designing a growth chart is deciding which children to measure. Two approaches may be followed: one is to measure a group of unselected children from a population; the other is to select children identified as healthy and who are known to be optimally nourished. The former approach generates a growth reference, whereas the latter generates a growth standard. These are conceptually different: a reference describes how a child in the population studied is growing, whereas a standard describes how a child should grow. The World Health Organization (WHO) chart for children 0–5 years of age is an example of an internationally applicable growth standard. Children were selected from relatively affluent social backgrounds and were all singleton infants born at term to nonsmoking mothers who had been well throughout the pregnancy. The children were then exclusively or predominantly breast-fed for the first 4–6 months of life (mean age at introduction of complementary foods was 5.4 months). Their growth was monitored longitudinally for the first 2 years, and the remainder of the chart is derived from cross-sectional data on a similar sample. Children from six countries were studied (Brazil, the USA, Norway, India, Oman, and Ghana), making this a truly international growth standard.
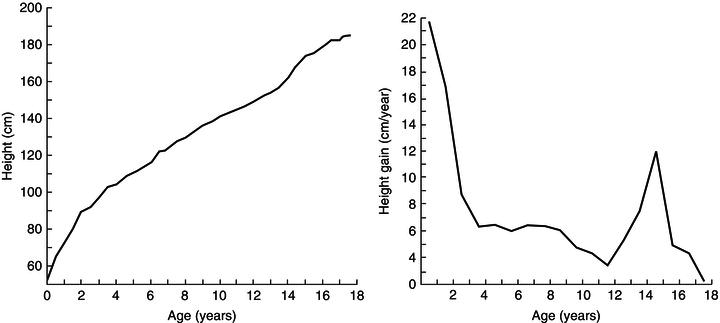
Figure 23.2 Attained-size and growth-velocity plots. Philibert de Montbeillard, an eighteenth-century French aristocrat, made serial measurements of his son’s height throughout childhood. These are plotted in two ways: the left-hand plot shows height attained and the right-hand plot the velocity of growth at any particular age. Reprinted with permission from Tanner (1989).
The growth charts in current use in the UK employ a combination of these approaches. From 2 weeks to 4 years of age the WHO standard is used, and from 4 to 18 years of age the UK 1990 growth reference is used. The latter was compiled from over 25 000 cross-sectional weight and height measurements of white English, Welsh, and Scottish children sampled in seven separate studies conducted 1978–1990. These were normalised to the year 1990. Further explanation of how to use the UK-WHO chart, which was introduced in 2009, may be found elsewhere. The UK growth charts are open-access and may be freely downloaded from the Royal College of Paediatrics and Child Health (RCPCH) Web site (http://www.rcpch.ac.uk/child-health/research-projects/uk-who-growth-charts-early-years/uk-who-growth-charts-early-years). Fact sheets, teaching presentations and plotting exercises can also be found at this site (http://www.rcpch.ac.uk/child-health/research-projects/uk-who-growth-charts-early-years/uk-who-0-4-years-growth-charts-initi).
Distance and velocity charts
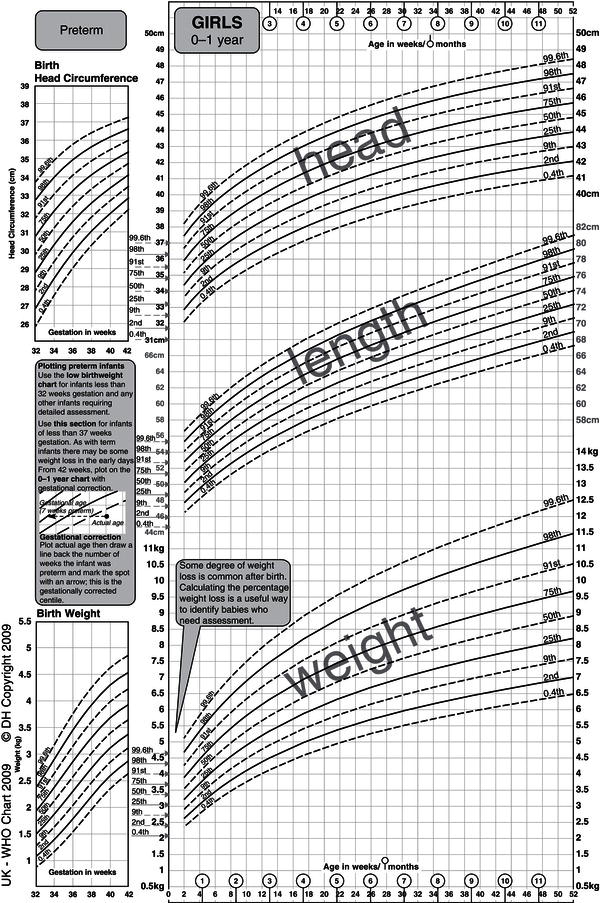
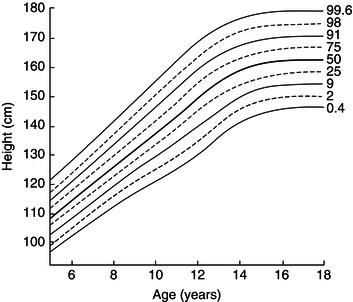
Growth data may be displayed in terms of either absolute attainment (i.e. distance traveled) for age or the speed of growth at a particular age (Figure 23.2). Clinical monitoring is most commonly performed using charts of the former type, inter-individual variation being depicted in the form of centile lines. Both the UK-WHO 0–4 (Figure 23.3) and the UK 1990 4–18 growth charts show nine lines. These represent the 0.4th, 2nd, 9th, 25th, 50th, 75th, 91st, 98th, and 99.6th centiles, each band being spaced two-thirds of a standard deviation above or below the next. Thus it is easy to see how many standard deviations a child’s height (or weight) is above or below the mean (Figure 23.4).
Figure 23.3 The new UK-WHO 0–4 growth chart. Between the ages of 0 and 4 years, the charts show weight, length, and head circumference data from the WHO Multicentre Growth Reference Study. The birth weight and size data on the ordinate are pooled data for all British births between 37 and 42 weeks included in the UK 1990 growth reference. UK WHO Growth Charts, Girls 0–4 years, A4, Department of Health. © Crown Copyright, 2009.
A key assumption in using growth charts for clinical monitoring is that an individual child’s growth trajectory parallels the centile lines on the chart: a phenomenon known as ‘channelling’ or canalisation. With a few physiological exceptions, deviation from such a course signifies under- or over-nutrition, or the presence of an underlying disease process which modifies nutrient assimilation, demands, or losses.
Growth data depicted in velocity/age format are now less commonly used clinically. They have a specialist use in investigation and monitoring in endocrine/growth clinics, but the need for extremely accurate measurements limits their clinical value, as the error in any difference estimate is double that of the individual measurements used. Nevertheless, for the purpose of considering nutrient demands, a useful insight into the overall pattern of growth can be obtained by examining a velocity chart. In fact, the pattern can be resolved mathematically into three overlapping curves: the infant, child, and pubertal phases (Figure 23.5). This is known as the ICP model of infant growth and reflects changes in the dominant influences of growth with age:
- Infant growth is primarily nutrient/insulin- and insulin-like growth factor (IGF)-led, an extension of the foetal pattern.
- Childhood growth is predominantly growth hormone-led.
- Pubertal growth is primarily driven by the influence of sex steroids on growth hormone secretion.
The increase in velocity at puberty is called the pubertal growth spurt. This occurs at a substantially younger age in girls, first because they enter puberty earlier than boys and second because their growth spurt occurs at an earlier stage of puberty, so that it is subsiding by menarche (Figure 23.6), helping to ensure both that the girl’s growth is completed before pregnancy occurs and that foetal nutritional demands are anticipated by the deposition of maternal body stores.
Optimal growth: the place of international standards
Children in resource-poor countries are generally smaller than their counterparts in industrialised ones and it might be argued that local references are more relevant to growth monitoring in such communities. However, studies that have compared the growth of better-off and poor children within such countries have shown large differences in rates of growth, the former often matching patterns seen in richer industrialised countries. This argues strongly for application of international growth standards as a measure for improving the nutritional status of children globally.
The US NCHS (National Center for Health Statistics) reference was used as such a standard for many years, though it had many shortcomings. First, important secular changes in the twentieth century have been associated with changes in the growth patterns of children even in rich countries. The NCHS standards drew on growth data over 50 years old, and today’s children are taller and heavier. Second, many of the infants included in the NCHS reference were artificially fed, and methods of infant feeding exert major influences on the pattern of growth in infancy. For these reasons, the chart has been replaced by the new WHO international growth standard mentioned earlier. Analysis of the growth data from six countries in the WHO Multicentre Growth Reference Study demonstrated that rates of linear growth to 5 years of age showed extremely low intercentre variation, justifying the use of this chart as an international standard.
Physiological deviations from growth references
Although the phenomenon of ‘channelling’ underpins the clinical use of growth charts for longitudinal monitoring, individual children can show patterns of growth which deviate from the centile lines for valid physiological reasons. This tendency to cross up or down centile-line channels is particularly marked at two stages of life: infancy and puberty.
Infancy
As charts are compiled from cross-sectional data, there is a tendency for babies at the extremes of the birth-weight range to show regression towards the mean during the early months, crossing centiles up or down (Figure 23.7). At a given gestational age, birth size is principally affected by placental function (nutrient supply) and maternal, rather than paternal, size. An infant constrained by intrauterine environment will, if optimally nourished after birth, grow in such a way as to seek out his or her genetic potential by exhibiting catch-up growth. Conversely, an infant over-nourished in utero, such as the infant of a diabetic mother, may exhibit catch-down growth. These processes are usually completed by the end of the first year of life, but in extreme cases may continue into the second year. It is sometimes important to distinguish clinically between the catch-down growth of an unusually heavy baby (e.g. the infant of a diabetic mother) and weight faltering. It is therefore essential to know fully the parental measurements and perinatal history when interpreting growth patterns in infancy.
Figure 23.4 A ‘nine-centile’ growth chart, showing centile bands spaced at intervals of two-thirds of a standard deviation (i.e. z-score 0.66). This presentation is now most commonly used in UK clinical practice. Data shown here are for British girls aged 5–18 included in the UK 1990 growth reference. Reproduced from BMJ, Cole TJ, 308: 641–642, 1994 with permission from BMJ Publishing Group Ltd.
Puberty
The age at onset of puberty varies greatly between individuals. For example, although pubic hair appears at an average age of 11.9 years in girls, the 2nd and 98th centiles for this stage are 5 years apart, at 14.4 and 9.4 years, respectively. Because the 50th-centile line on the growth chart reflects the growth trajectory of a child entering puberty at the average age, one exhibiting late puberty may show an apparent downward crossing of centile lines at this age, with later apparent catch-up as puberty occurs (Figure 23.8). The converse may also obtain in early puberty: a child may show apparent early upward and later downward centile crossing. Earlier growth charts (Tanner–Whitehouse, based on data collected in the 1960s) made some allowance for this by showing as a shaded area the age at which variations attributable to puberty might occur. Interpretation may be further confounded by the observation that taller, heavier children tend to develop puberty earlier than those who are shorter and lighter, whereas those with chronic disease may show later puberty. This adaptation may help them catch up to their genetically determined final height despite long-term disease-associated under-nutrition. In 2012, the new UK-WHO growth chart for children aged 2–18 years was published. This incorporates a new system of pubertal assessment and, like the other growth charts, is openly accessible from the RCPCH Web site (www.rcpch.ac.uk).
Figure 23.5 The Karlberg ‘ICP’ model of human growth. The chart shows three lines, which represent the infancy (1), childhood (2), and puberty (3) curves. These summate to form the ‘combined growth’ curve. Reprinted by permission from Macmillan Publishers Ltd: Eur J Clin Nutr (Karlberget al. (1994), Linear growth retardation in relation to the three phases of growth. Eur J Clin Nutr, vol 48 Supp 1, pages S25–43). Copyright (1994).
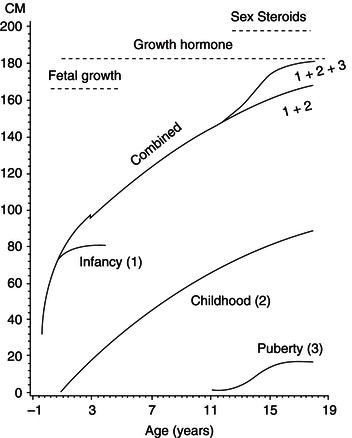
Figure 23.6 Differences in timing of the pubertal growth spurt. Height-velocity curves for boys and girls are overlapped. Comparable stages of puberty (Tanner’s pubic hair (PH) rating 3) are indicated by the arrows. The growth spurt is clearly an earlier pubertal event in girls than in boys.
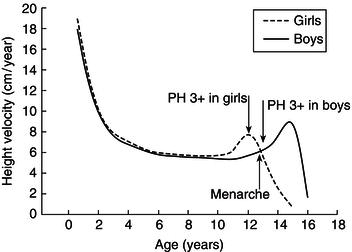
Figure 23.7 ‘Catch-up’ and ‘catch-down’ in infancy. Growth curves are plotted for two babies on the UK 1990 growth reference chart. Baby A, the infant of a diabetic mother, has a birth weight above the 97th centile. Excessive weight gain in utero was the result of maternal, hence foetal, hyperglycaemia and hyperinsulinism. After birth, she ‘catches down’ towards her genetically determined size. Baby B was born at term with birth weight less than the 0.4th centile and head circumference at the 9th centile. This indicates ‘head sparing’ and is typical of late intrauterine growth retardation (IUGR). After birth, the baby crosses several centiles upwards, a pattern indicative of ‘catch-up’ to genetically determined size following release from intrauterine constraint. Chart developed by RCPCH/WHO/Department of Health, Copyright © 2009 Department of Health.
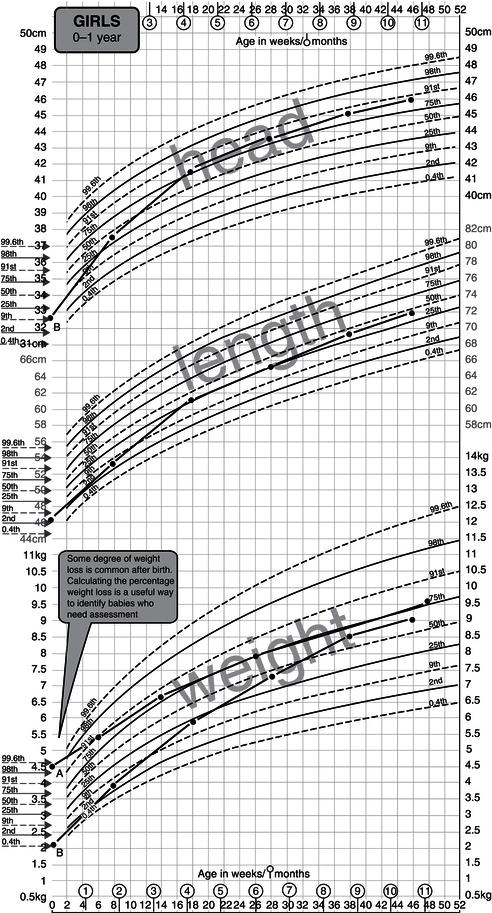
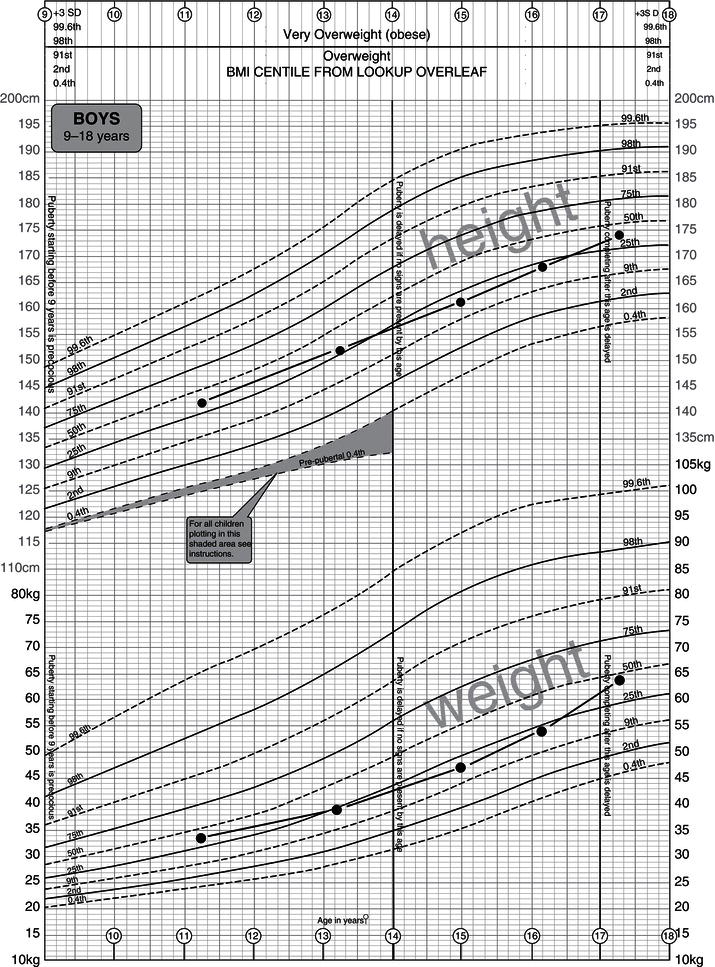
Figure 23.8 Late puberty plotted on the UK-WHO growth reference. This boy did not develop signs of puberty until after the age of 14 years (‘delayed puberty’). Because his pubertal growth spurt is relatively late, there is the apparent effect of crossing down one centile space for both weight and height, with recovery after the onset of puberty. This is because the cross-sectional chart best reflects the growth trajectory of boys entering puberty at average age. Chart developed by RCPCH/WHO/Department of Health, Copyright © 2009 Department of Health.
Body composition and growth
Childhood growth involves not only an increase in body size but changes in body proportions, the relative sizes of organ systems, and chemical composition. These changes have implications for:
- The nature and amount of body nutrient stores.
- The partitioning of nutrients between organ systems.
- The potential for nutrient restriction to have lifelong effects.
Sexual-dimorphism body composition becomes very apparent after puberty but is present to a limited extent well before.
Nutrient stores
Changes in the amount and distribution of body fat reserves exemplify the implications of growth for nutrient stores. Figure 23.9 shows how the body mass is distributed between fat, protein, and water as a child grows to 10 years. The extracellular fluid compartment is relatively large at birth but quickly decreases in size, a process which largely accounts for the normal weight loss of newborn infants in the first week of life. In the first 6 months, body weight more than doubles and the proportion of fat increases from about 14 to 25%. Thus the average fat mass of a 6-month-old baby is about fourfold greater than that of a normal newborn – some 2 kg as opposed to 500 g. This need to deposit large amounts of fat (9 kcal/g) partly explains why growth is so energetically demanding at this stage of development, consuming up to 50% of a baby’s energy intake.
The connotations for surviving a period of starvation are equally important, and are even more dramatic if the extremely preterm baby is considered. The fat compartment of a 500 g 25-week-gestation baby represents only 2–3% of body weight: about 10–15 g or 90–130 kcal. Provision of nutritional support is therefore a matter of urgency in such a patient.
Figure 23.10 Change in energy partitioning with age. Reproduced with permission from Pediatrics, Vol. 47, p169–179, Copyright © 1971 by the AAP.
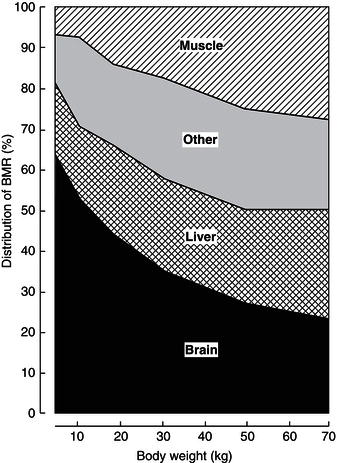
Organ systems and nutrient partitioning
Table 23.1 illustrates the relative contribution of various organ systems to body weight in the infant and adult. A notable difference is the relative size of the brain, which is growing at peak velocity around term and completes much of its growth in the first 2 years of life. These changes have major effects on the contribution brain metabolism makes to resting energy expenditure (REE) (Figure 23.10). As glucose is the principal brain fuel, it also explains why glucose requirements change so greatly with age. In the adult, hepatic gluconeogenesis can be suppressed by an intravenous infusion of 1–2 mg glucose/kg body weight/minute. However, the term newborn needs 3–5 mg/kg body weight/minute and the preterm, growth-retarded newborn (with a relatively much larger brain) some 6–8 mg/kg body weight/minute. If glucose requirements were expressed instead per 100 g of brain weight, a different picture would emerge: requirements are similar across the age spectrum.
This example clearly shows how changes in body composition associated with growth affect nutrient partitioning between organ systems and hence nutrient requirements if expressed on a per-unit-body-weight basis.
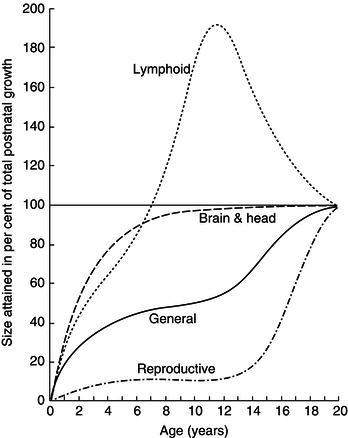
Figure 23.11 Changes in the relative sizes of organ systems with age. The graph shows the ages at which organs attain a given percentage of their size at age 20 (100%). Note that 90% of brain growth is completed in the first 3 years, and that the relative size of the lymphoid organ in childhood significantly exceeds that in the adult. Reprinted with permission from Tanner (1989).
- A growth reference and a growth standard are cocnceptually different.
- A growth chart can be compiled from cross-sectional or longitudinal data.
- Growth references can be represented graphically (centile charts) or statistically (z-scores).
- Cross-sectional charts can conceal normal variation in growth patterns during infancy and at puberty.
- Growth is a sensitive measure of health, nutrient supply, and socioeconomic status. These influences are much stronger than ethnic background.
- The pattern of growth can be resolved into infant, child, and pubertal phases (the Karlberg ICP model). These reflect differing endocrine influences.
- Body composition and the relative sizes of organ systems change as growth proceeds. The timing of a nutritional insult therefore determines the outcome.
- Sex differences in body composition appear at puberty.
- The growth spurt occurs early in female puberty and late in male puberty.
Nutrient restriction and critical growth periods
Figure 23.11 shows the stages in childhood at which various organ systems undergo the most rapid growth. It is particularly important to note that brain growth is virtually completed in the early years of childhood. Prolonged and severe nutrient restriction at this age may be associated with lifelong functional deficit.
Chronic early-life under-nutrition results in stunting (linear growth restriction), which is extremely common in resource-poor countries, with as many as one-third to one-half of all children being affected. At 2 years of age, in such settings, a height greater than 2 standard deviations below the mean on WHO charts (z-score −2.0) seems to be associated with a later IQ deficit of around 10 points. The extent to which this reflects deprivation of nutrients, as opposed to the effects of numerous confounders (e.g. poverty, illness, and low birth weight) is uncertain. Mechanisms exist to spare brain nutrition in the presence of nutrient shortages. For example, the newborn who has suffered intrauterine growth retardation (IUGR) as a result of placental failure has a small body with thin limbs and a large head because blood flow and nutrients are diverted away from the somatic organs to the brain. To a lesser extent, brain sparing, with similar changes in body proportions, is also evident in malnourished young children.
Figure 23.12 Differences between boys and girls in development of the fat compartment. The bars represent fat as a percentage of body weight. Difference between sexes becomes significant only after puberty. Data from Widdowson (1981), copyright Heinemann.
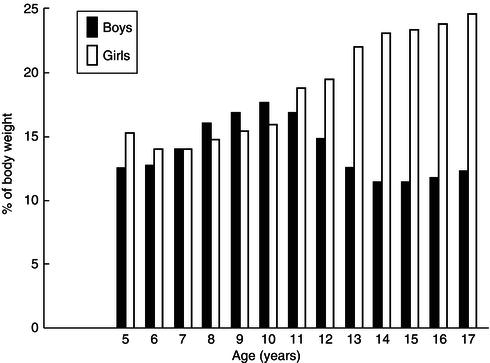
Sexual dimorphism in body composition
Differences in the body compositions of boys and girls are present throughout childhood but become very marked after puberty, as shown in Figure 23.12. In girls, fat represents a much higher proportion of pubertal weight gain than in boys, who deposit more lean body tissue. These differences reflect the dominance of androgenic steroids in boys, but functionally also ensure that girls have more adequate energy reserves to meet the later demands of pregnancy and lactation.
Key points about growth and body composition are summarised in Box 23.3.
23.3 The impact of development on nutrition
‘Children are not just small adults’ – they are growing and exhibit developmental changes which better equip them to meet metabolic demands. For example, developmental changes in the gastrointestinal system enhance the efficiency of nutrient absorption, while those in the liver and kidney progressively increase the child’s ability to adapt to over- or under-supply of nutrients. Most important of all is the child’s neurological maturation, which facilitates transition from total dependence during infancy to the independent adult, capable of seeking out and selecting a food supply. This section examines some of the major nutritional changes that occur as the child develops.
Neurological maturation
Infancy, the first 12 months of life, is a particularly rapid period of developmental change during which the typical term infant will treble in weight and move from total dependence on milk to the acceptance of a mixed diet compatible with the family’s culture. This process of nutritional diversification is gradual and the pace of change needs to respect the timing of normal psychomotor and mental developmental changes, often referred to as ‘developmental milestones’. Those particularly relevant to the development of eating behaviour are shown in Table 23.2. Note that these are approximations only and there can be substantial normal variation between individual children.
When considering Table 23.2, it may be useful to know that paediatricians generally think about developmental milestones in four groups (or ‘fields’):
- gross motor function and maintenance of posture;
- fine motor function (manipulation) and vision;
- speech and hearing;
- psychological and social.
Successful feeding requires convergence in all fields. The child must be able to sit comfortably, hold their head erect and be able to turn (gross motor), have coordinated oropharyngeal movements in order to sweep a spoon, swallow (speech), locate food with their hand and transfer it to their mouth (vision and fine motor), and interact with a carer (psychological). As a result, children with cerebral palsy (a disorder of posture and movement caused by a nonprogressive lesion of the developing brain, in which muscles become stiff or ‘spastic’, making coordinated movements hard to achieve) often have major feeding problems. They need help with body positioning and careful attention must be paid to the texture and consistency of foods offered in order for them to learn to eat.
Table 23.2 Developmental ‘milestones’ of neurological maturation relevant to feeding.
| Milestone | Age achieved |
| Sucking and swallowing | From about 34 weeks of gestation Reflex sucking disappears about 4 months |
| Rooting reflex | Present at term Disappears about 4 months |
| Coordinated acceptance of a spoon | About 6 months |
| Puts hands to mouth | About 5–6 months |
| Sits unsupported | About 7 months |
| Transfers objects from hand to hand | About 8 months |
| Pincer grip | About 10 months |
| Full rotary chewing movements | 1–2 years |
| Holds spoon or cup to feed | 12–18 months |
| Feeds self (but messily) | 18 months–2 years |
- Children mature neurologically in a well-defined sequence marked by ‘milestones’.
- The development of feeding requires integration of milestones in all fields: gross motor, fine motor, speech, and psychosocial.
- Appropriate timing and progression of complementary feeding must recognise this process.
Thinking about the development of complementary feeding skills in this way emphasises a number of other points:
- The child needs to be ‘developmentally ready’: there is no point in offering solids before the child is ready to take them. Indeed, to do so may result in force-feeding and negatively affect eating behaviour.
- The introduction of complementary feeding at appropriate times may also help to reinforce the coordinated use of muscle groups. Sucking from the breast or bottle teat requires the tongue to move only in a sagittal plane, whereas forming solids into a bolus requires the gradual attainment of rotary tongue movements necessary for speech. Anecdotally, there is a frequent association between early feeding problems and speech delay, though whether one is a consequence of the other, or both reflect the underlying delay in neurological maturation is not clear.
The impact of neurological development on nutrition is summarised in Box 23.4.
Gastrointestinal maturation
The gut is anatomically mature by about 24 weeks of gestation and there is transit of fluid through the upper intestine from early in the second trimester of pregnancy. Foetal swallowing can be observed on ultrasonography, and obstruction related to congenital anomalies (e.g. oesophageal or duodenal atresia) results in accumulation of excessive amniotic fluid (polyhydramnios). Swallowed water is absorbed in the small intestine and excreted through the foetal kidneys; there is thus turnover of the water compartment of the amniotic fluid. There is no net transit through the large intestine, which accumulates meconium, a sticky dark green material. Meconium is usually excreted within 24 hours of birth (excretion during labour may be an indication of foetal stress resulting from hypoxia and ischaemia). Delayed excretion of meconium is often an indication of lower intestinal obstruction or dysmotility, such as Hirschsprung’s disease.
Animal studies have shown that feeding is the important trophic stimulus to further postnatal development of the gut. Milk feeding results in both a hypertrophy (increase in cell size) and a hyperplasia (increase in cell number) of the small intestine, and milk of the animal’s own species is more effective than artificial milks in this respect. The newborn’s capacity for mucosal absorption increases rapidly after birth in response to enteral feeding, which also stimulates the release of ‘gut hormones’, including cholecystokinin, motilin, and enteroglucagon, helping to stimulate bile flow, intestinal transit, and the integration of liver metabolism with feeding.
Despite the observation that about half the infant’s energy intake is provided by fat, the pancreas is relatively small at birth, and secretion of pancreatic lipase is reduced. This apparent paradox is explained by the existence of other effectors of luminal fat digestion, including the initiation of fat digestion in stomach, through the release of lingual lipase during sucking, and the presence in breast milk of a bile salt-stimulated lipase active at duodenal pH and stimulated by bile salts. Thus breast-milk lipids are more effectively absorbed than those in formula or other milks. When infants are born prematurely, fat digestion is even less well developed than at term, and initiation of enteral feeding is further hampered by poorly coordinated propulsion due to delay in the propagation of a migrating motor complex. The latter appears at a gestation of about 34 weeks, concomitant with the presence of effectively coordinated sucking and swallowing. It is known, however, that the initiation of feeding can effectively ‘call forward’ the maturation of motility patterns. Enteral feeding in even very preterm infants (from about 24 to 26 weeks’ gestation) is usually therefore commenced in small quantities as soon as possible after delivery, increasing gradually in volume as tolerated.
Another important aspect of gut maturation is the evolution of immune protection during infancy. Diarrhoeal disease is a leading cause of death in infants and young children. Moreover, mechanisms must develop which allow the infant to recognise harmful antigens yet become tolerant to foods. A number of factors are important in this respect:
- The provision of specific passive secretory immunity (secretory immunoglobulin A) through the enteromammary axis of breast-feeding.
- The presence of nonspecific immune factors in breast milk (e.g. lysozyme, lactoferrin, the lactoperoxidase system).
- The promotion of a large-bowel flora dominated by bifidobacteria, rather than coliform organisms. This is partly attributable to the prebiotic effect of nonabsorbable oligosaccharides in breast milk, in which they constitute about 10% of the carbohydrate content.
Although the last has long been cited as important in protecting the gut from infection, the nature of large-bowel flora may also be important in the determination of systemic immune tolerance through regulation of the relative balance of T-helper/suppressor activity (see Chapter 8).
Important factors in gastrointestinal maturation are summarised in Box 23.5.
Renal maturation
At birth, both glomerular filtration rate (GFR) and renal tubular concentrating capacity are reduced. This limits the amount of solute that can be cleared from the blood and increases the demand for free water needed to eliminate dietary excess in a relatively dilute urine. The term ‘renal solute load’ (RSL) is used to describe the amount of absorbed dietary solute surplus to growth demands that must be eliminated through the kidneys. Stressors such as fever or diarrhoea may further compromise excretory capacity by increasing insensible and stool water losses, reducing water availability for urine. Retention of solute then leads to hyperosmolar dehydration.
- Enteral feeding is an important stimulus to early gut maturation.
- Pancreatic fat digestion is relatively immature at birth, though the actions of lingual lipase and a lipase in breast milk help to compensate for this.
- Breast milk particularly helps to promote gut development and is important in protecting the gut from infection.
- The nature of the large-bowel flora (especially the presence of bifidobacteria) is influenced by feeding and may influence the development of systemic immune tolerance.
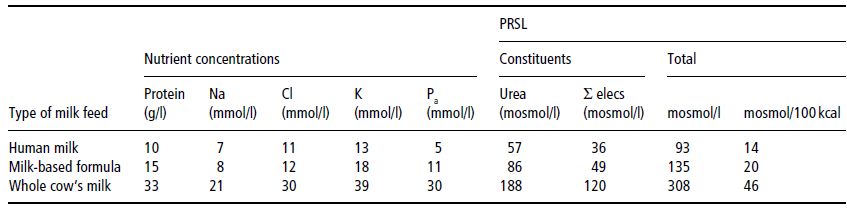
Carbohydrate and fat do not contribute to RSL because they are entirely eliminated through non-renal routes (oxidation to CO2 and water). The principal components of RSL are sodium (Na), potassium (K), chloride (Cl), and absorbed phosphorus (Pa), together with the amount of urea formed by oxidation of protein excess to growth demands. These form the potential renal solute load (PRSL). However, the actual RSL depends not only on the composition of the feed, but on the baby’s rate of growth (which influences the rate of solute retention) and non-renal water losses. In the absence of diarrhoea, the latter can be ignored, so that RSL can be calculated as:

PRSL can in turn be expressed by the formula:

In both formulas, elemental composition is expressed in mmol/l. The factor 0.9 in the first equation is an estimate which allows for the disposal of solute by deposition in growing tissue (0.9 mmol for each gram of weight gained). This observation re-emphasises R.A. McCance’s dictum that growth constitutes the infant’s ‘third kidney’, and explains the paradox by which infants tolerate protein intakes that would be proportionately far too high for an adult with similarly low GFR resulting from kidney disease (see Chapter 14). The divisor of 28 in the second equation, applied to the total fraction of nitrogenous solute (N/mg), assumes that the modal number of nitrogen atoms per molecule of urinary nitrogenous solute is 2; in other words, that it is urea.
A final complication is that the amount of water consumed is partly determined by the energy density of a feed: infants consuming an energy-dense feed will take a lower volume, hence less water. Thus, whereas the calculations above show PRSL in terms of mosmol/l, it is more logical to express it as mosmol/100 kcal. Table 23.3 shows the PRSLs of various feed types calculated in both ways. On both theoretical and epidemiological grounds (risk of hypernatraemic dehydration), it can be shown that feeds with a PRSL < 27 mosmol/100 kcal are safe, whereas those > 38 mosmol/100 kcal are associated with increased risk of developing hyperosmolar dehydration. For regulatory purposes, limits of 30–35 mosmol/100 kcal have been proposed for infant formulas.
The role of renal maturation in nutrition is summarised in Box 23.6.
Metabolic maturation
At birth, the normal newborn must switch rapidly from continuous transplacental nutrient supply to a pattern of intermittent enteral feeding. Initially, during the onset of stage II (postpartum) lactogenesis, the amount of energy delivered by breast milk is small. Typically volumes of only 50–100 ml may be taken on the first day of life, rising to 600–800 ml by the end of the first week. Counter-regulatory mechanisms are well developed, in keeping with the need to meet high obligatory metabolic demands (at this stage, cerebral metabolism accounts for over half of the REE: see Figure 23.10) at this time of low intake. With the cessation of transplacental glucose supply, there is a surge in glucagon secretion, resulting in glycogenolysis. About 1% of the term newborn’s body weight is glycogen, which forms an important short-term energy reserve. The glucagon surge also promotes gluconeogenesis, with glycerol (from fat stores), alanine (from muscle), lactate, and pyruvate acting as substrates.
Adrenaline secretion is also important in opposing the action of insulin, which dominates the foetal metabolic milieu. It stimulates lipolysis in fat stores and protein breakdown in muscle (releasing alanine to fuel gluconeogenesis) during the early hours of life. Growth hormone and cortisol also play important roles; indeed, children with growth-hormone or cortisol deficiency may present with significant neonatal hypoglycaemia. This switch from carbohydrate to fat metabolism is evident as:
- A fall in respiratory quotient from 1.0 in the first hour to 0.8–0.85 by about 8–12 hours of age.
- The appearance of significant ketonaemia at 24–48 hours of age (‘suckling ketogenesis’).
Table 23.3 Calculation of potential renal solute load (PRSL) for various milks. Reprinted from J Pediatr, 134, Fomon SJ & Ziegler EE. Renal solute load and potential renal solute load in infancy, 11–14. Copyright (1999), with permission from Elsevier.
- Young infants, especially those born preterm, have both reduced GFR and reduced tubular concentrating capacity.
- The amount of dietary solute in excess of the need for growth is known as the ‘renal solute load’ (RSL).
- Low GFR, particularly in the very preterm baby, reduces clearance of RSL through the kidneys, contributing to uraemia.
- Impaired tubular concentrating capacity requires that the infant be given sufficient water to eliminate RSL, or else the plasma will become hyperosmolar.
- The PRSL of a feed is normally greater than the RSL because growth consumes solute, effectively acting as a ‘third kidney’.
In contrast, some pathways important to the metabolism of protein are less mature in the young infant, particularly if preterm. The ability to synthesise urea following deamination of amino acids is reduced, as is capacity to interconvert certain essential amino acids. The latter particularly increases metabolic requirements for cysteine and taurine (less easily synthesised from methionine) and for tyrosine (synthesised from phenylalanine at older ages).
These apparent metabolic constraints possibly reflect the observation that the young infant is strongly anabolic and in health has little need to dispose of excessive amino acid. Indeed, the young infant’s metabolic milieu is characterised more by the need to conserve nitrogen in the interests of protein economy. Thus the intake of nitrogen from breast milk is relatively low, but the infant is able to maintain nitrogen balance by virtue of:
- The high quality of breast-milk protein (conventionally used as the reference for calculating the amino acid scores of alternative proteins – such as cow’s milk or soya – used in infant formulas).
- The existence of mechanisms for colonic salvage. Almost a quarter of the nitrogen in breast milk is ‘non-protein nitrogen’ (much of it urea), and there is good evidence that the infant can incorporate this into body protein. (The observation of a high level of non-protein nitrogen has caused some to observe that it is not appropriate to express the protein content of breast milk by applying the conventional factor of 6.25 to nitrogen measured using the Kjeldahl technique. A factor of 5.18 probably reflects more closely the nutritional protein content.)
- Counter-regulatory mechanisms are well developed in the healthy term newborn.
- They are instrumental in effecting the change from continuous transplacental delivery of nutrients to intermittent enteral feeding controlled by appetite.
- High metabolic demands and the immaturity of some metabolic steps mean that a greater number of amino acids is essential or conditionally essential for the young infant.
- The protein quality of breast milk is high.
- High protein quality and the existence of mechanisms promoting nitrogen economy in the baby explain why the nutritional protein content of breast milk at first sight seems low.
The role of metabolic maturation in nutrition is summarised in Box 23.7.
23.4 Infant feeding
Previous sections have shown that infancy is a period of particular nutritional vulnerability: the potential rate of growth is rapid, body stores are small, and functional immaturity constrains adaptation to both over- and under-supply. Feeding during infancy therefore warrants close attention.
Breast-feeding
The establishment of successful breast-feeding is crucial to the general health of mother and baby in all environments (see Public Health Nutrition in this series). In summary, the principal health gains associated with breast-feeding are reduced vulnerability to gastrointestinal and respiratory (including ear) infections and suppression of ovulation, leading to a reduction in demands on family resources. Long-term gains also include an advantage in the child’s cognitive development, a reduced risk of obesity in later life, and a reduction in the mother’s risk of pre-menopausal breast cancer. Although these factors were once considered less relevant to industrialised countries, cohort studies in the UK have clearly shown that babies who are not breast-fed suffer more gastrointestinal and respiratory infections and are more likely to be admitted to hospital. Since exclusive or predominant breast-feeding is associated with the highest standards of health, the growth pattern of infants so fed is regarded as a standard for all infants, regardless of feeding method (see the earlier sections of this chapter).
Key points about breast-feeding are listed in Box 23.8.
- Breast-feeding is associated with better health outcomes for mother and baby, even in industrialised countries.
- Data on the consumption and composition of breast milk constitute a dietary reference for young infants.
- The growth pattern of exclusively or predominantly breast-fed infants is regarded as the ideal (or ‘standard’ pattern; see Section 23.2).
- The production of breast milk is controlled by infant demand: unrestricted access to the breast and an effective feeding technique are both important to success.
- There are technical problems in measuring precisely both the amount of milk the infant consumes and its composition.
Composition of breast milk
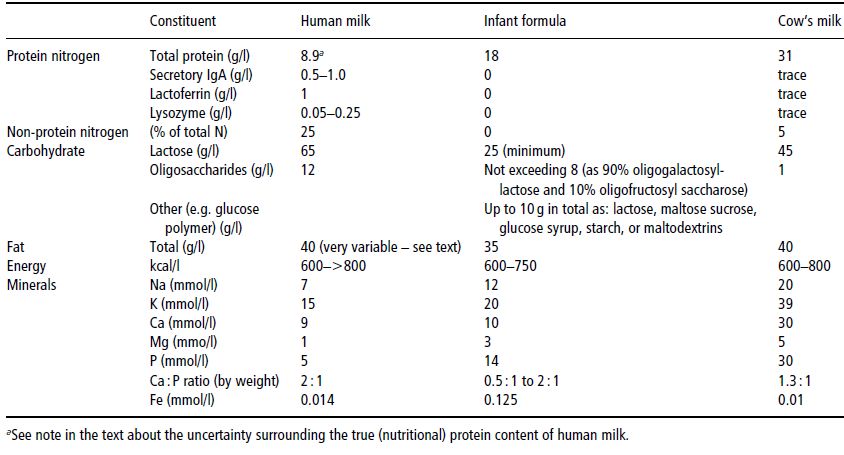
Nutritionally, breast milk alone is viewed as the reference diet for infants younger than 6 months of age. Table 23.4 summarises its composition and compares it with that of a typical infant formula and of unmodified cow’s milk. There is pronounced inter-individual variability in the composition of breast milk. This is attributable to a number of factors, including the gestational age of the baby, the postnatal age of the baby, the volume produced, and the time of day. Even within a single mother–baby pair, the fat concentration rises significantly during a feed.
The nitrogen moiety of breast milk is particularly complex, for a number of reasons. First, many of the proteins serve ‘non-nutritional’ biological functions, such as specific and nonspecific immune protection of the gut and mucosal surfaces. For example, about 10% of the protein is secretory immunoglobulin A (IgA), which is not absorbed. Second, about a quarter of the nitrogenous compounds exist as the so-called ‘non-protein nitrogen’ fraction, which comprises free amino acids, urea, and other small peptides. There is evidence that much of this can be salvaged in the colon. For these reasons, the true, nutritionally available protein content of breast milk is not easily measurable and cannot be simply expressed as a fraction of the total nitrogen content.
The economic utilisation of the nitrogenous compounds in breast milk to match the demands of growth helps to prevent the accumulation of urea, which would otherwise need to be eliminated through the kidneys. This, together with the low macro-element content, minimises the PRSL of breast milk to the extent that the breast-fed baby need not be offered additional free water to facilitate renal solute clearance. Thus breast milk alone is sufficient as both a food and a drink for the first 6 months of life.
Establishment of breast-feeding
The endocrine control of lactation ensures that breast-milk supply matches demands made by infant sucking. In practical terms, the key requirements for successful establishment of breast-feeding at birth are:
- unrestricted access to the breast when the infant is hungry;
- effective milk removal by the infant.
Many clinical problems with breast-feeding, such as breast pain, cracked and sore nipples, mastitis, early dehydration, and poor weight gain, result from errors in breast-feeding technique which hamper the second of these requirements. In order for the baby to remove milk from the breast effectively, he or she must be properly positioned (or held correctly by the mother) and attached at the breast (i.e. take sufficient breast tissue into the mouth, not just the nipple). An account of the skills required to assess and correct such problems is beyond the scope of this text, but early referral to a professional skilled in breast-feeding management is essential should such problems develop.
Table 23.4 Summary of the composition of human milk, infant formula, and cow’s milk. IgA, immunoglobulin A. Data for the composition of infant formula are taken from Ministry of Agriculture Fisheries and Food (1995), © Crown Copyright 1995 and subsequent amendments, taking the mid-point of the legally permissible range unless otherwise stated. Data for the composition of cow’s milk and human milk are taken from Williams (1991).
Consumption of breast milk
The volume of breast milk consumed by a breast-feeding baby has been measured in a number of ways. The oldest is ‘test-weighing’ – measuring the difference in the baby’s (or occasionally the mother’s) weight before and after a feed. Although improvements in the accuracy of scales have reduced the errors inherent in weighing a moving baby, there remains considerable variation in the volume of milk consumed from day to day. The procedure is also intrusive and may alter the mother and baby’s feeding pattern, making measurements of limited value. For these reasons, test-weighing is no longer used for clinical purposes, the most practical measure of breast-feeding adequacy being the baby’s growth rate judged using the UK-WHO chart, which was derived by observation of healthy breast-fed babies. For research purposes, measurements of the breast-milk intake of ‘free-living’ breast-fed babies have been made using isotopic dilution techniques, administering either 2H2O or 2H218O to the baby or to the mother and baby. These suggest that breast-fed babies consume some 400–800 ml/day of breast milk.
The composition of the milk which the baby consumes is also difficult to measure, because it changes during the feed. A number of solutions to this problem have been tried:
- Expressing the entire content of the breasts at a feed. An objection to this is that the baby may not remove all milk from the breast, but choose to leave some behind. Because the fat concentration rises progressively as the breast empties, the expressed sample may overestimate the energy content of milk consumed.
- Expressing samples before and after a feed. This technique has been widely used, but the assumption that changes in concentration follow a linear trend during a feed may not be valid.
- Doubly-labelled water (2H218O) technique. As the 18O exchanges with both the CO2– and 2H-labelled water pools, differences in the rate of elimination can be used to calculate both energy expenditure and milk intake, allowing energy intake to be inferred (see Chapter 2 of Introduction to Human Nutrition in this series).
Formula feeding
Unmodified animal milks (for example, cow’s milk) are unsuitable for young infants for several reasons:
- Protein and mineral content impose too high an RSL.
- Micronutrient content (e.g. iron, folic acid, vitamin D, vitamin A) is inadequate.
- Fat and protein are relatively indigestible.
When a mother chooses not to breast-feed, therefore, the infant should be fed an infant formula. According to UK and European law, this label defines a commercial product which provides the nutritional requirements of infants in good health for the first 4–6 months of life, as set out in legally enforceable compositional requirements. The Infant Formula and Follow-on Formula Regulations 1995 (Ministry of Agriculture Fisheries and Food 1995) (revised in 2007) define the terms ‘infant formula’ and ‘follow-on formula’, setting out legally permissible minimum and maximum nutrient concentrations.
Infant formula must be based on a cow’s-milk or soy-protein source, the amount and type of protein (whey : casein ratio) being adjusted to the baby’s metabolic needs. The carbohydrate moiety of infant formula is usually supplied by lactose and other permissible carbohydrates (Table 23.4) in amounts intended to approximate those of breast milk (about 70 g/l). Vegetable oil blends usually provide the fat: these are substituted for cow’s-milk fat because the latter is less digestible, having a higher saturated fatty acid content. The mineral content of infant formulas is also adjusted. Notably, the sodium content is reduced and the ratio of calcium : phosphorus increased. Finally, infant formulas are fully supplemented with trace minerals and vitamins.
The non-breast-fed infant should receive infant formula for at least the first 12 months of life – alone for the first 4–6 months and later as part of a progressively diversified weaning diet (see the next subsection). Infants over 6 months are, however, sometimes given a follow-on formula. The composition of ‘follow-on formulas’ is also defined in UK and European law, but, unlike infant formulas, they are not required to meet the infant’s whole nutritional requirements. Like infant formulas, they are micronutrient-enriched and promoted commercially as having value in preventing iron deficiency. Although there is good evidence that they are superior to whole cow’s milk in this respect they have not been shown to be any better than infant formula, which remains a suitable choice at this age for the non-breast-fed infant.
All powdered infant formulas need careful reconstitution:
- All utensils must be sterilised.
- Water must be boiled and of appropriate electrolyte composition. It should be tap water drawn from the mains supply (not through an ion-exchange softener) or bottled water of similar composition. The main concern here is the sodium concentration: EU regulations set a maximum [Na] of 200 mg/l at the tap.
- Level measures in the correct measuring scoop (usually supplied with the tin) must be used.
- Powder should be added to the measured amount of water, not vice versa, or the feed may be hazardously overconcentrated.
The amount of formula infants consume averages about 150 ml/kg/day at 2–3 months of age. However, this is merely a guideline and, as with breast-feeding, there is large inter-individual variation. For example, in a well-known study of a group of 3-month-old American infants, consumption varied from 120 to over 220 ml/kg/day.
Key points on infant formula are summarised in Box 23.9.
Complementary feeding
Complementary feeding is the introduction of foods other than breast milk or infant formula into the infant’s diet. The term is now generally considered preferable to ‘weaning’, which misleadingly implied a role in the cessation of breast-feeding. In fact, the primary role of complementary feeding is to increase dietary diversity, not to reduce breast-milk intake. Complementary foods themselves are sometimes also referred to in the literature as beikost (USA) or solids (UK).
- An infant formula is based on cow’s milk or soya protein modified to meet compositional standards such as those set out in UK law and European Commission directives. Infant formula is designed to provide the entire nutritional requirements of healthy, full-term infants for the first 4–6 months of life but lacks the many immune factors found in breast milk.
- Extensive modification of cow’s milk reduces PRSL, enhances protein quality, alters macronutrient balance, and adjusts Ca : P ratio.
- Infant formula is enriched with trace minerals and vitamins.
- Powdered infant formulas must be reconstituted carefully, according to the manufacturer’s instructions.
- The amount of formula consumed averages about 150 ml/kg/day at 3 months of age, but varies greatly between babies.
Although complementary feeding is generally thought of as a mechanism for increasing the nutrient density of the diet, it serves a number of other developmental functions too (see Section 23.3). There has been much controversy over the optimum time at which to introduce foods other than breast milk into the infant’s diet. Introducing them too early will undesirably increase RSL, reduce breast milk intake, compromise the maintenance of lactational amenorrhoea, and expose the infant to dietary antigens such as gluten (see Chapter 8). Leaving complementary feeding too late, on the other hand, may impair growth, because the nutrient density of a liquid diet is relatively low. Moreover, the concentration of some important micronutrients in breast milk (such as iron) is low, and that of some, particularly zinc, declines with the length of lactation.
Historically, a number of different philosophical approaches have been applied to defining the appropriate age for introducing complementary foods:
- Factorial calculation of the intake required to support ‘optimal growth’. If the expected rate of growth is known, it is possible to calculate what energy intake is required after making allowance for losses and maintenance expenditure. Although this approach seems intuitively sensible, considerable problems arise in agreeing what is meant by ‘optimal growth’ and it is now acknowledged that older growth references (such as NCHS) did not accurately describe the early growth pattern of breast-fed infants. The use of such charts was one factor which historically led to overestimation of the energy and protein requirements of growing breast-fed infants. Others were underestimation of breast-milk intake and miscalculation of the nutrient content of breast milk. Better estimation of these quantities subsequently led to a postponement of the recommended age for complementary feeding from ‘about 3 months’ to ‘4–6 months’. More recently, recommendations have been further revised to ‘about 6 months’ on the basis of evidence discussed later.
- Consideration of developmental and biological factors. An alternative way of considering the problem is to ask by what age infants are developmentally prepared to receive foods other than breast milk. Maturation of neurological, gastrointestinal, renal, and immune function can be taken into account and considered together with available data on the morbidity associated with complementary feeding at particular ages. On this basis, the WHO review concluded that exclusive breast-feeding can be continued with benefit for ‘about the first six months’ in healthy infants of appropriate birth weight, though alternative strategies may need to be considered for at-risk groups such as those of low birth weight.
- Controlled studies of interventions. A limited amount of information is available from small controlled trials, mainly conducted in less-developed-country settings. Commercially prepared complementary foods were introduced at 4 or 6 months and the effects on growth and breast-milk intake studied. Introduction at 4 months did not confer a detectable growth advantage, although it was associated with a reduced breast-milk intake. Clearly such studies are difficult to perform and a particular problem with the controlled work described was differential dropout from the study groups, which could have biased the findings.
Related posts:

Stay updated, free articles. Join our Telegram channel

Full access? Get Clinical Tree


