Fig. 7.1
Immunohistochemistry (IHC) of murine testis. (a) Antibody-specific staining of a protein antigen, which is selectively present in male germ cells with maximal levels (dark-brown staining) at spermatogonia-spermatocyte stage, when cells begin to populate the lumen. (b) Is a sequential IHC section of the same specimen, which was stained with an isotype-matched pre-immune (without antigen target) IgG to control for specificity. (c and d) Are identical images as those of a and b, only at a higher amplification as noted by the by the image bars
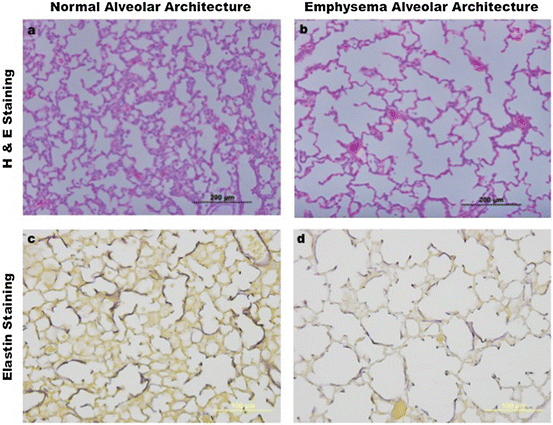
Fig. 7.2
Postnatal development in health and disease. (a) Shows an image of normal murine alveolar development from a paraffin-embedded lung section, stained with hematoxylin and eosin (H&E), as captured by standard light microscopy. (b) Reveals abnormal mouse alveolar development, characteristic of emphysema. Section preparation, H&E staining, and image capture are the same as in (a) and obtained from littermates at the same postnatal age. (c and d) Depict optical images of paraffin-embedded mouse lung sections stained with Harts solution [80], which compare alveolar elastin organization during postnatal development between normal (c) and emphysema (d) mouse littermates
7.2 Electron Microscopy
The aim of this section is to underscore how electron microscopy (EM) has contributed to the advances of optical imaging, particularly in defining cell structure, organelle compartmentalization, protein homing, and molecular interactions and functions.
Based on the “wave of particles” hypothesis by the French physicist Louis-Victor de Broglie [29], which underscored the greater resolution of the shortwave of an electron, the idea of the electron microscope was first conceived [65, 66]. However, the first eukaryote cell EM images are credited to the Canadian-American biologist Keith Porter, despite the notion that the original transmission EM (TEM) of bacteria and virus pictures had been produced by Ruska’s brother Helmut [66, 105, 112].
The groundbreaking EM methods were straightforward and, hence, attracted the interest of researchers in the natural sciences, who wanted to examine cell contours, boundaries, and intracellular compartments. Such a task, which was only possible until resin-embedded tissues and thin section preparations, became available [28, 58, 66, 93, 97, 100, 104].
Since then, EM technology has experienced a total transformation to adapt to the needs to resolve complex 3-D ultrastructure details of cells, organelles, and molecules [68]. Although the basic TEM foundation remained virtually unchanged, key parameters such as sample preparation, image acquisition, and data processing have significantly contributed to the 2-D to 3-D progression [39]. For instance, TEM has played a major role in resolving biological structures, such as mitochondria cristae and intermembrane spaces at sub-nanometer level (Fig. 7.3), a biochemical hub for normal and malignant cell bioenergetics, oxidative stress, and death/survival cues. On the other hand, scanning EM (SEM) has proved to be instrumental in revealing the dynamics of cell mobility and traffic, involving pseudopodia formation, adherence, migration, and aggregation (Fig. 7.4), a turning point in the assessment of cancer metastasis. Major advances resulting from enhanced image acquisition and data processing automation include the SEM and volume EM (VEM), which paved the way for a wide range of biomedical applications with higher resolution and speed imaging [70, 71, 99]. As an example of a specific VEM modality, the serial section TEM (ssTEM) is a manual method intended to produce high-resolution 3-D images [49, 99]. The inherent challenge of this technique is the capture of serial snapshots from extremely thin tissue sections, which mandates dexterous skills to achieve precise image succession. On the other hand, SEM technology can generate images with outstanding resolution, given their field electron emissions combined with powerful detectors [99, 137].
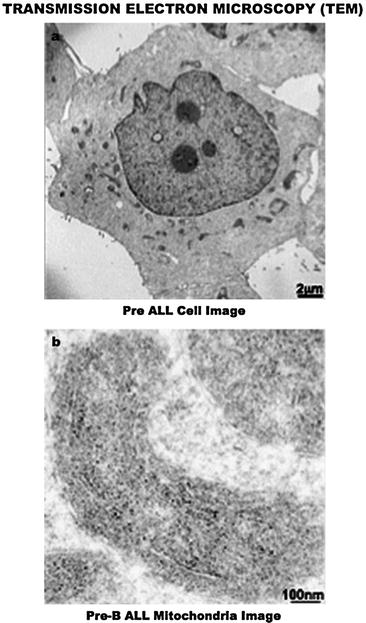
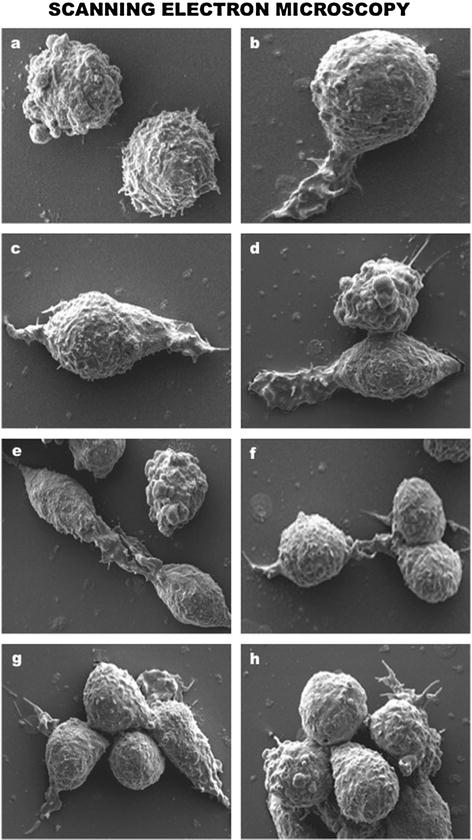

Fig. 7.3
Transmission electron microscopy (TEM) assessment of the intracellular landscape in leukemia cells. (a) A 2 μm image of the PreB acute lymphocytic leukemia cell organization, which displays a prominent nucleus- and mitochondria-rich cytoplasm, a common feature of cancer. (b) A 100 nm image shows the conspicuous presence of an antiapoptotic molecule (silver grain/black dots) within the intermembrane space of the mitochondria

Fig. 7.4
Scanning electron microscopy (SEM) appraisal of T lymphocyte dynamics. (a) Control resting T-lymphocytes without extracellular stimulation. (b–h) Progressive detection of T lymphocyte lamellipodia formation, rolling, migration, and aggregation after genetically engineered activation
Concordant with the 3-D TEM modalities, electron tomography combines the precise angle rotation of relatively thick tissue sections with a coordinate electron beam channeled through a continuous tilt span. Images are serially acquired and instantly converted into a high-resolution 3-D tomography [13, 88, 99]. To optimize the ssTEM, one needs to consider the time that each image acquisition takes in the serial tomography process, to ensure that the entire area of the serial sections are captured, prevent loss of image information, and enhance resolution by deconvoluting serial dataset analysis [13, 99, 127]. This means that while ssTEM is a powerful technology with broad scope and depth, there is room for improvement. In agreement with the creative progression and in response to technological demands, upgraded hardware and software are constantly emerging to reduce the complexity and time of operation, as thoroughly reviewed earlier [99].
The notable advances in electron microscopy are underscored by the range of automation of image capture, resolution, and data processing, which enable researches of all walks of science to sort out the intricacies, molecular compartmentalization, and dynamics of distinct tissues, cells, and organelles.
7.3 Fluorescence Microscopy
In more than two decades, fluorescence microscopy has contributed to major advances in optical imaging, and the inherent power of this remarkable technology has enabled researchers to achieve cell analyses beyond compare, in most biomedical fields [40]. Further innovation and expansion of this technology rely on concerted advances in optical hardware, software development, chemistry, cell and molecular biology, and bioengineering [40].
Early applications of fluorescence microscopy started with the observation that probes conjugated with distinct fluorescent agents could reveal the location of targeted molecules and their potential of complex formation, with the aim to image the occurrence of 3-D molecular interactions in real time [40, 59], under physiological and pathological conditions. Historically, the first fluorescent dye used to label cell nucleic acids in the mid-1900s was acridine orange. While the staining with acridine orange was moderately superior to conventional dyes, it would not match the specificity of fluorescence-conjugated antibodies, which arrived in the 1950s along with the dichroic mirrors [25, 26, 40, 103]. This advancement was subsequently followed by the application of mercury and xenon lamps, after which were subsequently upgraded to laser beam excitation. Concomitantly, major improvements in image capture were being achieved by the invention of instant scanning and CCD processing [23, 40, 44, 53, 126]. These advancements enabled the exploration of histological compartments (Fig. 7.5), which then made it possible to assess the efficacy of vaccine-mediated immune responses and to diagnose malignant cell development.
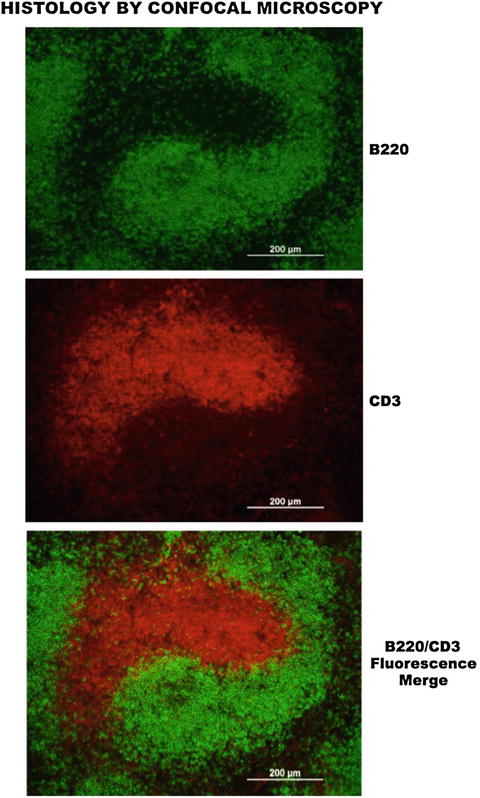

Fig. 7.5
Confocal microscopy delineation of histological compartments. (Upper panel) Shows a strong and selective detection of B220+ B-lymphocytes after reaction with a primary anti-B200-specific monoclonal antibody and revealing the reactivity with a secondary fluorescein-conjugated anti-mouse antibody. (Center panel) Depicts a prominent and specific cell reactivity of CD3+ T cells to a primary rat anti-CD3 antibody, revealed by a secondary rhodamine-conjugated anti-rat antibody. (Lower panel) Reveals the fluorescence merge of B and T cell reactivity to respective anti-B220 and anti-CD3 antibodies, which demonstrates their selective compartments within the spleen microenvironment
Fluorescence microscopy became a key technology in optical imaging because it provided basic and biomedical researchers a dynamic means to uncover the physiology, biochemistry, and molecular intricacies of the cell [113, 121]. While fluorescence still adheres to basic optical concepts, microscope hardware design, image contrast, level of resolution, and software for data acquisition gradually improved [113]. In this section, the principles of broad-field fluorescence microscopy are specifically defined to underscore how different modalities such as laser scanning confocal microscopy, two-photon microscopy, scanning disk confocal microscopy, total internal reflection, and superresolution microscopy have gradually contributed to the success of optical imaging.
7.4 Multiphoton Confocal Microscopy
After the discovery, purification, cloning, and functional characterization of naturally occurring fluorescence proteins [20, 78, 108, 119], optical imaging harnessed the power of broad-spectrum tools to provide the means to study the subtleties of molecular interactions in unparalleled detail [77, 91, 141]. The diverse array of fluorescent wavelength use led to a broader range of applications, including a role of the natural fluorescent proteins as molecular reporters of inducible gene expression (Fig. 7.6). The new developments rapidly led to the creation and use of high-resolution multiphoton confocal microscopy with powerful scanning features and versatile data processing software [15, 30, 52, 75, 141].
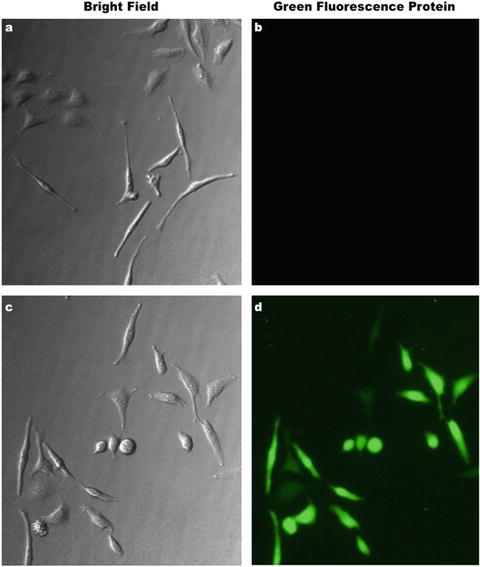

Fig. 7.6
Inducible green fluorescence protein (GFP) expression. (a and b) Bright-field and fluorescence images demonstrate the strong inhibition of GFP gene expression effect under the control of the tetracycline repressor (TetR). (c and d) The same images reveal that after tetracycline-mediated release of TetR repression, GFP is readily and strongly expressed
Fast-forward to decades later, the resolution and scope of fluorescence optical imaging have transformed biomedical research in unprecedented ways, for instance, the stimulated emission depletion (STED) technology capable of reaching a high confocal fluorescence microscopy resolution, by reducing the focal site of light detection to tenths of nm [17, 27, 50, 51, 74]. When data recording became a necessity, structured illumination microscopy (SIM) was implemented to lower the gear of high-frequency information, by shooting light in patterns onto the sample [27, 73, 94, 146]. Other upgrades such as photoactivated localization microscopy (PALM) and stochastic optical reconstruction microscopy (STORM) were similarly adapted, when precision and in-depth 3-D superresolution imaging were required [9, 16, 27].
7.5 Total Internal Reflection Fluorescence
Chemical fluidity of the plasma membrane, through the ion channels, is essential to monitor live inter- and intracellular activity with the microenvironment. In response to the demanding research interests, a new microscope with total internal reflection fluorescence (TIRF), increased resolution, and high-speed scanning capabilities was manufactured to quantitatively image, locate, and measure the activity of ion channels [8, 44, 143]. Basically, in a region in which the optical field is short-lived and cannot propagate (evanescent field), light is selectively flashed to excite fluorescent probes to restrictively image cells in liquid media, which is confined between a glass slide and a cover slip. The overall gain of the TIRF technique is that while the incoming light is reflected by cover slips, the one that penetrates the cell media is evanescently absorbed [8, 44, 143]. The transient light phenomena enable the selective imaging snapshot within a very focused area of no more than 200 nm, namely, the cell plasma membrane (roughly 7–10 nm) against the cover slip [8, 44, 143]. Because the probes are not in proximity to the glass and hence less likely to be reflective, the risk of fluorescence background is negligible. Consistent with these features, TIRF microscopy applications are of significant value for high-definition single-molecule imaging in live cells, at the plasma and sub-plasma membrane levels.
7.6 Förster/Fluorescence Resonance Energy Transfer
With state-of-the-art fluorescent tools, the measurements of the distance between different proteins and their dynamic interactions were then possible to visualize in multiple colors by resonance energy transfer methods postulated nearly 70 years ago [37, 64, 91]. Simply put, Förster or fluorescence resonance energy transfer (FRET) is a nonradioactive technology, which quantitates the fluorescence energy that is exchanged between the emission of a donor molecule and the excitation of an acceptor molecule [23, 64, 92]. To that end, FRET measurements require an overlap between the emission and excitation spectra of respective donor and acceptor molecules, which is key to ensure that enough energy is engaged to support protein interactions [54, 79]. Other parameters for effective FRET imaging include proximity (within 1–10 nm) and orientation of fluorochrome donor-acceptor pairs [54, 64, 92, 120]. Donor molecules include fluorescent proteins, lanthanide group elements of the periodic table, and fluorescence-conjugated nanoprobes [23, 114], whereas metal quencher reagents (with or without fluorescence) and organic chemicals can function as FRET acceptor molecules [23, 72, 114].
7.7 Fluorescence In Situ Hybridization
Among the broad applications of fluorescence in optical imaging, fluorescence in situ hybridization (FISH) is distinguished for its unique property to provide information in the context of nuclear, cellular, and/or histological microenvironments [14, 62, 63, 122, 135, 138]. This powerful technology employs high-resolution methods and probes to quantitatively image DNA, RNA, and protein targets at intracellular compartments [10, 55, 129].
As an example, chromosomal abnormalities are recognized as genetic signatures, which are implicated in diverse diseases and known to affect gene dosage, structure, processing, and function. Consistent with this notion, chromosomal translocations are behind gene duplications, deletions, and rearrangements (Fig. 7.7), which often result in phenotypes that can either be life-threatening or have severe morphological and physiological consequences [7, 14, 122, 140]. The technology that enabled the visualization, identification, and analysis of chromosomes has been fundamental to enable accurate counts, integrity assessments, and detection of genetic abnormalities [43, 149]. Methods like chromosome G-banding (Fig. 7.7) are routine in most laboratories, where cytogenetics studies are performed with high resolution to reveal both subtle and complex gene abnormalities [131, 140]. Other applications include karyotype, chromosome gene assignment, chromatin structure, DNA recombination, gene expression, and radiation dosimetry assessments [83, 111, 145].
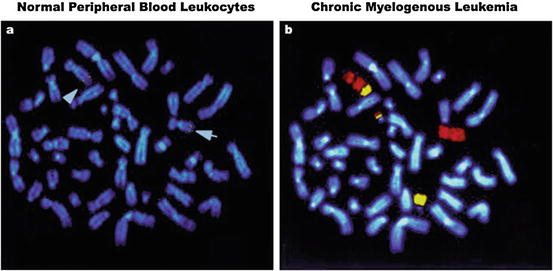

Fig. 7.7
Fluorescence in situ hybridization (FISH). (a) Shows chromosome banding depicts distinctive karyotype features observed in normal leukocytes. Arrows indicate the localization of a targeted gene (yellow dots) on the two chromosome (Chr) 9 alleles, after hybridization with locus-specific genomic DNA. (b) Chr 9 (red) and 22 (yellow) painting reveals classical FISH images of a t(9;22)(q34;q11) translocation, in which segments of the BCR gene of Chr 9 are reciprocally fused with the ABL gene of Chr 22. The fusion resulting from such translocation is known as the Philadelphia (Ph) chromosome, which is commonly found in chronic myelogenous leukemia. The blue fluorescence by DNA dye Hoechst 33342 provides chromosome reference background
Detection of specific chromosome segments to structurally assess inaccessible gene lesions can be laborious and technically demanding. Hence, the need for innovative approaches moved science into the development of technology that made FISH a breakthrough reality [83, 111, 122, 135, 145].
FISH appeared in the laboratory scene over 30 years ago but rapidly evolved into a broad range of basic research and biomedical applications [12, 33, 60, 107, 118, 122, 135]. Progressively, florescent probes were designed by conjugating a comprehensive array of versatile fluorochromes to achieve multiparameter cytogenetic imaging [61]. Irrespective of the application, FISH technology exploded in the past decade, with fluorochrome reagents, probe engineering, and image-capture hardware and software that are diverse and sophisticated [101, 115]. FISH has earned solid credibility for its chromosome/gene mapping capabilities, specificity, precision, flexibility and superb microscopy, and digital imaging support, thus rapidly becoming an indispensable tool in biomedical research [101, 115]. Notably, FISH-dependent genetic queries find widespread use in a variety of scientific fields, including genetics, neurosciences, reproduction, toxicology, ecology, and evolution [101, 122, 138] to name some.
Because of the enormous diversity of the FISH technology, where acronyms are coined for any given application [101, 115, 138], one can justify the inclusion of FISH in the menu of multiple and varied analytical methods. Because the aim of the present section is to underscore the overall contribution of optical imaging to broad diagnostic assessments, only a brief appraisal of FISH applications is herein presented.
For example, when unambiguous karyotype analyses are needed and gene-specific locations, cryptic gene fusions, and intricate chromosome rearrangements have to be simultaneously defined, multicolor chromosome painting was applied [130]. Accordingly, the design of multiple fluorochromes and the development of broad wavelength range detection systems led the way to multiplex-FISH (M-FISH), which gave a record boost to cytogenetics [57, 63, 132, 138]. This innovative improvement to the FISH technology has been particularly important for cancer cytogenetics (Fig 7.7).
Consistent with the continued need for improvements, reworking of FISH protocols is particularly important when genetic alterations result from chromosome multimerization, as it occurs in trisomy syndromes. Because accurate assessment of micronucleation events is not a trivial feat, blocking cytoplasm partition with cytochalasin B (CB) in conjunction with FISH (CB-FISH) has become instrumental in assessing most forms of chromosome segregation abnormalities [46, 138].
Quantitative determination of telomere loss in aging can exploit the power of telomere hybridization, using peptide nucleic acid (PNA) FISH combined with the versatility of flow cytometry (flow-FISH), which can measure fluorescent telomere signals in cell suspensions [6, 10, 48, 90, 106]. The approach enables to manage multiple cell analyses with high resolution and has enormous clinical potential.
Assessment of chromosome loci susceptibility and DNA strand breaks is pathophysiologically important in biomedicine. To that end, a detection method known as the comet assay was developed to measure the degree of DNA breaks at the single-cell level by imaging the electrophoretic exit of DNA from the nucleus onto an agarose gel field [24, 31, 98]. When combined with FISH (comet-FISH), the procedure reveals the chromosome sites with relevant DNA breakage susceptibility [32, 45, 47, 125].
Similarly, the combination of FISH DNA probes with antibody probes (immuno-FISH) to detect precise gene loci has virtually unlimited potential [41, 84, 128, 144, 150]. Likewise, the accurate capture of aberrant sister chromatid exchanges by combining BrdU/cell cycle labeling with FISH (harlequin-FISH) advanced the technology a significant step farther [62, 86, 96].
Focused cytogenetic analysis on gene fusions resulting from chromosome rearrangements found a niche that has relevant diagnostic and prognostic value. By using dual-color FISH probes flanking the breakpoint site of chromosomal translocations (split-signal FISH), precise identification of rearranged loci can be readily achieved [42, 133, 134, 138].
Notably, in situ mRNA expression using fluorescence-conjugated antisense complementary RNA (cRNA) probes opened new means to evaluate gene transcription (Fig. 7.8), mRNA processing, and decay [35, 81, 82, 89, 102, 138, 139]. This expression-FISH method enables to equally assess endogenous transcription, enforced plasmid-mediated overexpression, or retrovirus-dependent transduction in transgenic (Tg) animals [77, 81, 89]. The application of expression-FISH is virtually unlimited, from single-cell gene expression (Fig. 7.8) to phenotypical/pathological differential mRNA arrays, transcriptional regulation, nuclear/cytosol traffic, and diagnosis-based transcriptome analyses [35, 77, 82, 102, 138, 139].
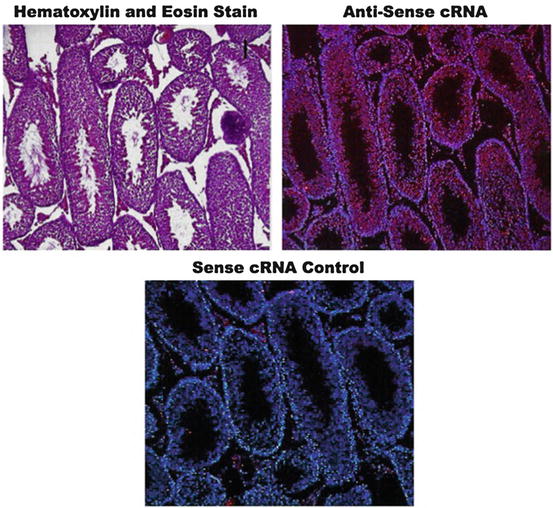

Fig. 7.8
Expression fluorescence in situ hybridization (expression FISH). (Upper panel) A control hematoxylin and eosin (H&E)-stained murine testis section to show the basal architecture of the tissue. (Central panel) Hybridization of a serial section of the same tissue with a red fluorescence-labeled antisense complementary RNA (cRNA) probe to assess the expression of a male germ cell-specific gene. (Lower panel) Control hybridization of a serial section of the same tissue with a red fluorescence-labeled antisense cRNA probe to confirm gene expression specificity. The blue fluorescence by DNA dye Hoechst 33342 provides tissue reference background
Collectively, in situ hybridization technology in general and FISH in particular evolved into innovative multiparameter applications, which provide technical flexibility and predict advances in biomedical research.
7.8 Flow Cytometry
Looking back, the impact of the availability of antibodies has had an extraordinary impact in all fields of biology research. The subsequent progress in quantitative cell imaging by the generation of diverse fluorescence-conjugated antibody probes gave rise to flow cytometry [34, 38, 80, 85, 89]. Briefly, the basic application of flow cytometry involves conjugation of fluorochromes to antibody probes, which target specific cell antigens. Then, laser beams energize the fluorochrome conjugate, which results in fluorescence discharge that is received and quantitated by a signal detection system [117]. As it could be anticipated, different fluorochromes became readily available, and multiparameter flow cytometry was feasible, in which detectors with specific wavelength spectra concomitantly analyzed the emission of fluorochrome-conjugated antibody probes. As the flow cytometry technology continued to emerge, the applications focused on the identification of cell surface protein biomarkers, known as cluster determination (CD) antigens, which served to identify cell lineages and developmental stages [34, 38, 80, 85, 89]. As such, flow cytometry enabled researchers to accurately achieve comprehensive phenotype analyses, discover new and unique cell populations (Fig. 7.9), and provide evidence of cell surface assembly of receptor proteins [5, 19, 21, 76, 109]. Notably, flow cytometry has demonstrated the capability to concomitantly analyze cell phenotypes and physiological activities, such as proliferation (Fig. 7.10), survival, and death [22, 34, 38, 69, 76, 80, 85, 87, 89, 109].
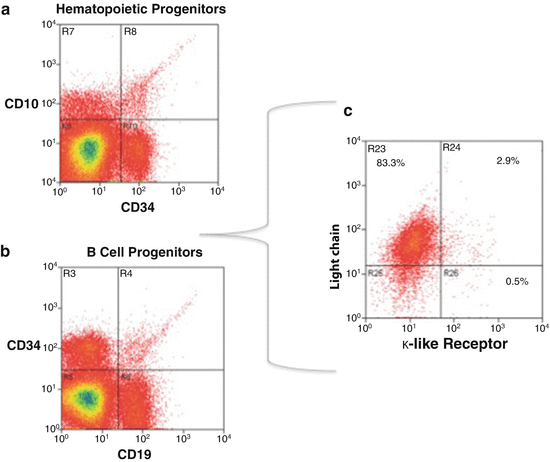
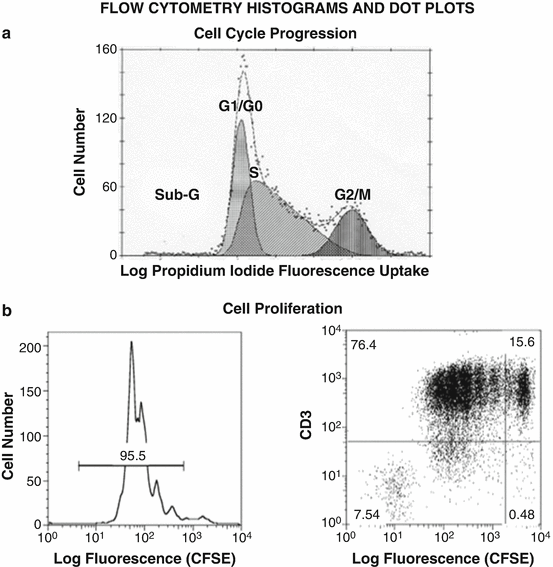

Fig. 7.9
Multiparameter flow cytometry scheme to sort unique cell subsets. (a) Shows the isolation of hematopoietic cell progenitors (HCP) based on identity (ID) cell surface markers CD34 and CD10. (b) After sorting HCP, a specific B-cell progenitor (BCP) subset can be purified by the ID marker CD19. (c) A rare BCP subpopulation (2.9 % of total BCP) can then be isolated by its selective surface expression of a surrogate κ-like ID marker

Fig. 7.10
Distinct flow cytometry formats to assess cell cycle and proliferation. (a) A representative cell cycle histogram of B-lymphocytes stained with nuclear dye propidium iodide (PI), which can quantitatively measure the percentage of cells at G1/G0 transition, S phase, and G2/M transition by flow cytometry. Of note, a sub-G region assesses the percentage of cells undergoing apoptosis. (b) Flow cytometry histogram (left) and dot plot (right) analyses of CFSE fluorescence-stained spleen cells to determine time-dependent cell division rates. It must be noted that while histogram on the left shows the total number of cells in each division peak, the dot plot on the right enables the dual fluorescence of anti-CD3-labeled IgG (red) and CFSE fluorescence (green) to specifically assess the number of proliferating T-lymphocytes (top dot gradients)
Unquestionably, flow cytometry is a powerful optical imaging technology that provides unique biological information to not only assess cell phenotypes and frequency or diversity of cell subsets but also to measure intracellular and cell surface protein expression and molecular interactions [22, 34, 69, 80, 87, 89, 109].
Stay updated, free articles. Join our Telegram channel

Full access? Get Clinical Tree


