Fig. 4.1
Shows the comparison between a conventional PET detector (a) and the depth-of-interaction (DOI) detector (b). The DOI detector eliminates the parallax error, caused by the thickness of the crystals in conventional detectors
Figure 4.1b shows a four-layered DOI detector based on a light sharing method [8, 9], one of the successful proofs of concept made for the jPET-D4, which is a brain prototype PET system with the DOI detectors. It has a nearly uniform spatial resolution of around 2 mm all over the FOV, which was obtained using iterative image reconstruction with the geometrically defined system matrix [10]. This detector has been upgraded to get better spatial resolution at lower production costs. Moreover, the successful identification by the 32 × 32 × 4 array of LYSO crystals (1.45 × 1.45 × 4.5 mm3 in size) with a 64channel flat panel PMT (H8500, Hamamatsu Photonics K.K., Japan) [11] is the base for Shimadzu’s new positron emission mammography products [12].
For treatment, on the other hand, radiotherapy is essential for effective cancer treatment with minimized side effects. Specifically, particle therapy such as proton and carbon ion therapy are expected to be the ultimate radiotherapy because they can concentrate the dose even in a deep tumor. Thus, there has been remarkable progress in PET and radiotherapy, but no one has looked into the great potential to be obtained by the combination of both.
An open-type PET geometry (OpenPET) is a new idea to visualize a physically opened space between two detector rings [13], which will move researchers toward a future joint PET imaging and radiotherapy system. OpenPET is expected to achieve in-beam PET, which is a method to monitor in situ charged particle therapy. Without injecting any PET tracer, positron emitters are produced through fragmentation reactions between the projectiles and the atomic nuclei of the tissue during patient irradiation [14]. Compared with conventional radiation therapy, charged particle therapy can highly concentrate the dose in a tumor. This means if there is any difference between the actual irradiation and the treatment plan, the tumor treatment will be compromised, and the normal tissue around the tumor will be damaged. Therefore, quality of treatment must be assured for in-beam PET.
Dual-head PET cameras have been developed at the Gesellschaft für Schwerionenforschung (GSI), Darmstadt, Germany [15], and at the National Institute of Radiological Sciences (NIRS), Chiba, Japan [16]. They have also been applied to proton therapy [17, 18]. However, they are basically limited to 2D imaging, in which the resolution along the axis vertical to the detector faces is insufficient [19]. Therefore, the OpenPET is expected to be the first practical 3D geometry that does not interfere with the beam paths (Fig. 4.2).


Fig. 4.2
Provides examples of a PET geometry: (a) a typical cylindrical PET geometry, (b) the OpenPET geometry, and (c) a dual-head PET geometry which has been proposed for in-beam PET
4.2 Dual-Ring OpenPET (DROP)
4.2.1 Theory
4.2.1.1 Geometry
The long and continuous FOV including a 360-degree opened gap between two detector rings can be visualized by fully 3D image reconstruction from all the possible lines of response (LORs). Based on the redundant characteristics of 3D PET data, oblique LORs between two separated detector rings are expected to compensate for the missing LORs in the gap, and hence, there is a limited width range in the gap.
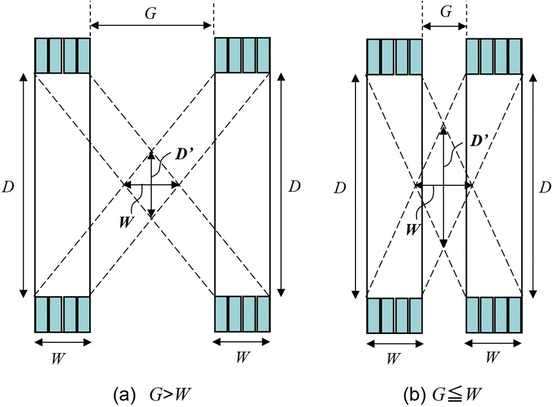
Figure 4.3 illustrates a dual-ring OpenPET (DROP) geometry of two detector rings of diameter D and axial length W, separated by a gap G. When G>W, the FOV becomes axially discontinuous. In addition, the minimum diameter of the FOV is represented as

This means that G must satisfy

when an FOV of more than D 0 in diameter is required. Therefore, in order to obtain the axially continuous FOV of D 0 in diameter, the range of G is limited to


(4.1)

(4.2)

(4.3)

Fig. 4.3
Shows the geometrical analysis of the possible range of the gap G for the DROP geometry of two detector rings of diameter D and axial length W. (a) is the case when G is larger than W, and (b) is the case G = W or shorter. D’ is the minimum diameter of the FOV
4.2.1.2 Image Reconstruction
DROP becomes practical with iterative image reconstruction methods since image reconstruction of DROP is an analytically incomplete problem. Therefore, a 3D version of the ordered subset expectation maximization (OS-EM) [20] with a precomputed system matrix was employed. The basic software was originally developed for the jPET-D4 [10]. The system matrix is designed taking into consideration the geometrical arrangement and the radiation penetration of the crystals. Notably, it is possible to compress the system matrix by eliminating zero elements and applying rotational symmetry and an axial shift property of the crystal arrangement pre-calculation of the system matrix. For the DROP geometries with a variable open space, however, it is not practical to precompute and store a set of system matrixes for each size of open space. Therefore, we proposed a “masked” OS-EM for the DROP geometries with the following conditions:
Next, a long gapless scanner having N = 2N W + N Gmax rings was modeled, which completely covers all possible axial FOVs. Here N w and N Gmax are the numbers of crystal rings, which satisfy W = N w Δz and G max = N Gmax Δz, where G max is the maximum gap width to be supported. Then we implemented the “masked” OS-EM by applying a mask to the original gapless system, as

where f j n,m is the j-th image element in the m-th sub-iteration of the n-th iteration. g i and a ij are the data element and the system matrix element for the N-ring scanner, respectively. S(m) represents a subset of LORs which are used in the m-th sub-iteration. The mask {w i } was defined as

The crystals are arranged axially at a regular interval of Δz.
The gap width, G, is divisible by Δz.
The detector response functions are only dependent on the ring differences and are axially shift-invariants.

(4.4)

(4.5)
4.2.2 Simulation
4.2.2.1 Scanner
In order to evaluate the imaging performance of the DROP geometries, we simulated a DROP of the two detector rings (D = 827.0 mm, W = 153.6 mm) separated by a variable gap (G ranging from 0 to 2 W) as shown in Fig. 4.4a. The maximum gap size to have an axially continuous FOV is W. However, in order to investigate the image quality when the gap exceeded the limitation, we varied the gap size up to 2 W. Each one of the dual scanners consisted of 4 rings of 72 block detectors. Each block detector consisted of 8 × 8 array of BGO crystals with dimensions of 4.1 mm (transaxial) × 4.4 mm (axial) × 30.0 mm (depth). The axial crystal interval was Δz = 4.8 mm (center to center), and the number of crystal rings for each one of the dual scanners was N W = 32.
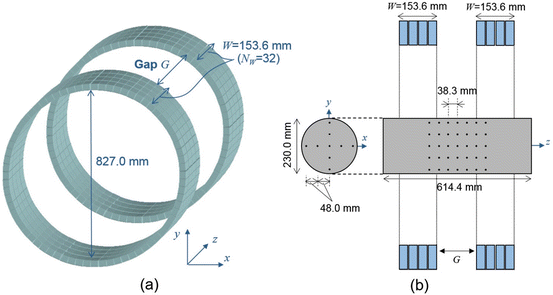

Fig. 4.4
Depicts the simulated DROP scanner (a) and the simulated cylinder phantom (b). Each detector ring of the DROP has similar dimensions to the HR+ (32 crystal rings, 153.6 mm axial length)
Figure 4.5 shows the minimum diameter of the FOV of the simulated DROP as a function of the gap according to Eq. (4.1). The possible range for the gap to have the axially continuous FOV is also shown according to Eq. (4.3). At the maximum gap for the axially continuous FOV, i.e., G = W, the minimum diameter of FOV is decreased to 413.5 mm.
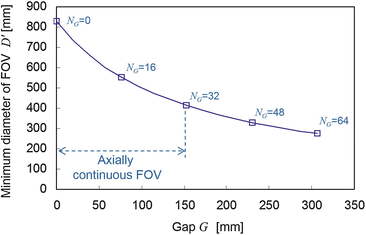

Fig. 4.5
Reveals that the relation between the gap G and the minimum diameter of FOV D’ for the simulated DROP. N G is the number of truncated rings, which satisfies G = N G Δz
To cover the maximum gap of 307.2 mm, i.e., N Gmax = 64, the long gapless scanner of N = 128 crystal rings was simulated. The voxel size was 2.4 mm3 and the “mash” factor of two was applied, i.e., two adjacent views were averaged to reduce angular samplings. Then, with the restricted FOV of 268.8 mm in diameter, the dimensions of the projection data became 120 bins × 144 views × 1282 ring pairs. Projection data were generated by the forward projection using the system matrix. Attenuation and scattering were not included in the simulation.
4.2.2.2 Phantom
In order to demonstrate the imaging performance of the DROP geometry, we simulated a “warm” cylinder of 230.0 mm in diameter and 614.4 mm length, which included 63 “hot” spheres of 4.0 mm diameter (Fig. 4.4b). The warm cylinder was filled with background activity and the hot spheres contained higher activity. The contrast between background and the hot spheres was 1:5. The mask for the gaps of G = 0.0 mm, 76.8 mm, 153.6 mm, 230.4 mm, and 307.2 mm was applied to the noise-free projection data. The masked 3D OS-EM with 8 subsets and 20 iterations was applied.
4.2.2.3 Results
Reconstructed images are shown in Fig. 4.6. Since the coronal and the sagittal views are identical, only the sagittal views are displayed. In addition, two transaxial slices at the center and at 114.9 mm off-center are shown. The central slices (slice A) of G ranging from 0.0 to 307.2 mm were very similar. The off-center slices (slice B) of G ranging from 0.0 to 153.6 mm were also similar. However, when G>153.6 mm (i.e., the maximum limitation for axially continuous FOV), the blank areas where there is no LOR appeared on both sides of the open space. With the blank areas, distorted point spread functions and low-frequent artifacts were also observed.
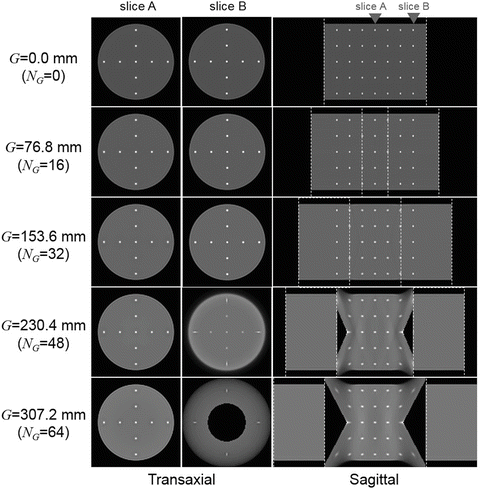

Fig. 4.6
Shows reconstructed images of the simulated warm cylinder phantom with hot spheres for the DROP (G ranging from 0.0 to 307.2 mm). In addition to sagittal views, the central slice (slice A) and the off-center slice (slice B) are shown. White dotted lines represent the boundary of the area where detectors are located
The simulation results showed that the DROP visualized a long FOV including the open space. However, it is necessary to minimize the open space according to applications because there is a trade-off relationship between image quality and the size of the open space. In the simulation, artifacts including distorted point spread functions started to appear on both sides of the open space when the gap exceeded 153.6 mm, i.e., the maximum limit for the axially continuous FOV.
4.2.3 Development of a Small Prototype
4.2.3.1 Prototype
We developed a small prototype to show a proof of concept of the OpenPET imaging [21]. The prototype was designed as a compact system (Fig. 4.7) so that it can be easily transported between PET areas and therapy areas such as the Heavy Ion Medical Accelerator in Chiba (HIMAC) [22]. Two detector rings of 110 mm diameter composed of 8 block detectors were placed with a variable gap. The height of the center of the detector ring was 125 cm, which equals the height of the HIMAC beam line. Power supply devices and the data acquisition (DAQ) system including positioning and coincidence circuits were placed in the base rack. Details of the DAQ system are available in [23]. In order to reduce radiation damage to electronic circuits caused by secondary particles such as neutrons, front-end circuits such as preamplifiers were separated from photomultiplier tubes (PMTs) and connected by 120 cm long coaxial cables.
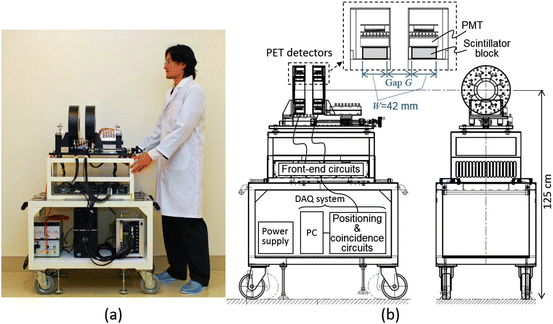

Fig. 4.7
Depicts the small DROP prototype: (a) a photograph of prototype and (b) sketches showing the positions of the detectors, front-end circuits, data acquisition (DAQ) system, and power supply
Each block detector, which has four-layer DOI capability [11], was composed of a 14 × 14 × 4-layer array of 2.9 × 2.9 × 5.0 mm3 Lu1.8Gd0.2SiO5:Ce (LGSO) crystals (Hitachi Chemical Co., Japan) and a H8500 PMT. Axial length of the crystal blocks W was 42 mm. The gap G (i.e., axial length between crystal blocks) was also adjusted to 42 mm, which was the maximum value possible to obtain the axially continuous FOV. The real gap between the two gantry ends of two detector rings was limited to 27 mm by the gantry structure, but the gap will be over 20 cm, which is enough for radiation therapy, if the gantry is extended to the scale of a human body. The energy window was 400–600 keV. At this development stage, we have not completed the timing correction, and the coincidence time window was 60 ns.
As the image reconstruction algorithm, the 3D OS-EM algorithm [20] was applied. Acquired list-mode data were transformed to histogram data before image reconstruction. Random correction was applied by subtracting delayed coincidence, but attenuation correction and scatter correction were not applied. System matrix elements were calculated based on the geometrically defined detector response functions [24]. Iteration parameters were 8 subsets and 10 iterations. The FOV defined in the image reconstruction was 114 mm in diameter and 126 mm in axial length. Two choices of voxel size, (1.5 mm)3 and (0.75 mm)3, were applied. The major specifications of the small DROP prototype are listed in Table 4.1.
Table 4.1
Major specifications of the developed small DROP prototype
Scanner | |
Crystal material | LGSO |
Crystal size | 2.9 × 2.9 × 7.5 mm3 |
Crystal array | 14 × 14 × 4-layer |
PMT | 64ch flat panel PMT (Hamamatsu H8500) |
Detector arrangement | 8 blocks × 2 rings |
Ring diameter | 110 mm |
Gap between crystal blocks (G) | 42 mm (minimum 15 mm) |
Image reconstruction | |
Algorithm | 3D OS-EM |
Detector response function | Geometrically defined |
Voxel size | (1.5 mm)3 or (0.75 mm)3 |
4.2.3.2 Imaging Performance
Absolute Sensitivity
We obtained the absolute sensitivity at the center of the FOV by measuring a 0.047 MBq 22Na point source for 10 min. In order to evaluate loss of sensitivity due to the gap, the absolute sensitivity at the center of the FOV was measured by reducing the gap to the minimum as G = 42 mm, 33 mm, 24 mm, and 15 mm. Then the absolute sensitivity for G = 0 mm was estimated using an extrapolation (Fig. 4.8). The sensitivity for G = 0 mm is estimated at 8.7% by linearly extrapolating measurement data, while the sensitivity for G = 42 mm is 6.6%. The results comparing the gap case (G = 42 mm) and the non-gap case (G = 0 mm) clearly show what we have sacrificed for the open geometry: about 24% of the sensitivity is lost due to the solid angle effect.
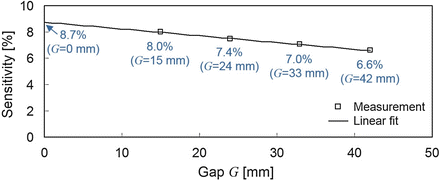

Fig. 4.8
Reveals the absolute sensitivity at the center of the FOV with varying the gap. The sensitivity for G = 0 mm was estimated with the linear extrapolation
Phantom Imaging
For demonstration, we measured a small rod phantom, which had a similar structure to a micro-Derenzo phantom (Fig. 4.9). The phantom consisted of an outer hollow cylinder and an inner solid cylinder of 36.1 mm diameter and 17.8 mm length. The inner solid cylinder contained rods of various diameters (1.0 mm, 1.6 mm, 2.2 mm, 3.0 mm, 4.0 mm, and 4.8 mm). First, the phantom was placed vertically with the rods parallel to the axial direction (“vertical” position), and then, it was placed horizontally (“horizontal” position). In addition, the phantom was placed in two positions: in-ring and in the gap. The phantom (filled with 1.3 MBq 18F solution) was measured in the order of in-ring vertical, gap vertical, in-ring horizontal, and gap horizontal. Scan times, which were adjusted to correct for radioactive decay, were 20 min, 23 min, 28 min, and 34 min, respectively. With the random rate varying from 15 to 6%, the measured prompt coincidence counts were 14.1 M, 29.7 M, 21.2 M, and 28.3 M, respectively. The 0.75 mm voxel was used in image reconstruction. The comparison of transaxial slices obtained in-ring (Fig. 4.9a) and in the gap (Fig. 4.9b) supports the feasibility of the OpenPET imaging since almost the same image is obtained even in the gap. The image in the gap seems to be rather superior to that in the ring, because sensitivity in the gap is about twice as high as that in the ring. Rods of 2.2 mm diameter are completely separated. On the other hand, the effect of the loss of axial spatial resolution is seen in the comparison of coronal slices obtained in-ring (Fig. 4.9c) and in the gap (Fig. 4.9d), although the rods are still separated in the gap.
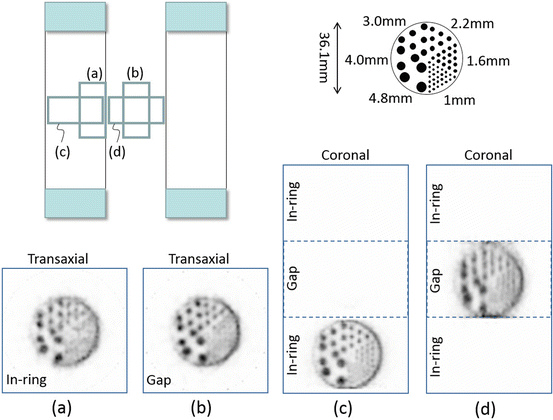


Fig. 4.9
Shows the reconstructed images (0.75 mm voxel) of the small rod phantom at four different positions (a–d)
Stay updated, free articles. Join our Telegram channel

Full access? Get Clinical Tree


