Obesity is an increasingly common condition in childhood and adolescence, and it has emerged as one of the most serious public health concerns in the 21st century. The growing prevalence of childhood obesity has brought with it an increase in the incidence of obesity-related comorbid disease prior to adulthood. The profound personal and economic impacts of childhood obesity require a thorough examination of this complex topic leading to serious efforts toward prevention and early intervention.
Discussion of this topic must begin with a consensus as to how overweight and obesity are to be defined in the pediatric population. Multiple different indices and techniques can be used to estimate the degree of adiposity. The most commonly used measure is body mass index (BMI), defined as kilograms (kg) of body weight per height in square meters (m2). Adults are defined as overweight if their BMI is 25.0 to 29.9 kg/m2 and obese if it is greater than 30.0 kg/m2. This index of adiposity, however, is less accurate in children that have not yet achieved full adult height. The number of children defined as obese using the adult criteria would be greatly underestimated. Therefore, the BMI percentile is a more accurate index of body mass in the pediatric age group. BMI percentile curves have been generated using data from the 2000 National Health and Nutrition Examination Survey (NHANES) and take into account both age and gender (Figures 9-1A and 9-1B). The Centers for Disease Control and Prevention (CDC) define children as overweight if the BMI is greater than 95th percentile and, at risk for overweight, if it is between the 85th and 95th percentile. The BMI percentile graphs only include children older than 2 years. For children younger than 2 years, standard weight-for-length curves can be used to assess body mass.
Figure 9-1
BMI percentile curves. Age- and gender-specific curves generated using data from the National Health and Nutrition Examination Survey (NHANES). (Source: National Center for Chronic Disease Prevention and Health Promotion, Centers for Disease Control and Prevention, Atlanta, Georgia.) A = boys and B = girls. (http://www.cdc.gov/growthcharts.)
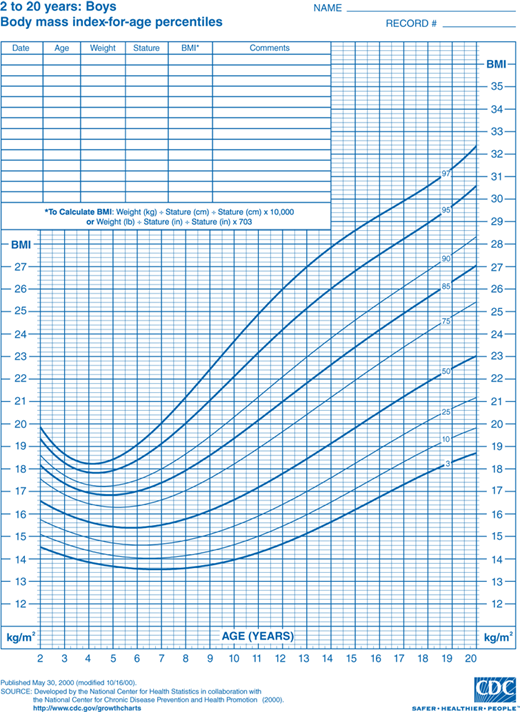
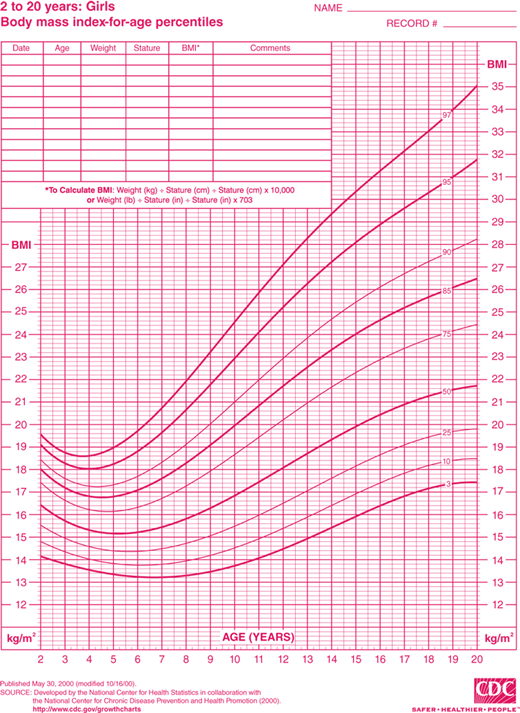
Multiple national surveys have indicated a significant increase in the frequency of overweight children over the past 30 years. With current prevalence of overweight and obese children ranging from 12% to 30% in developed nations and from 2% to 12% in the developing world, overnutrition is now one of the most common health problems in childhood.1 The most recent NHANES data indicate that 31.8% of American children and adolescents aged 2 to 19 years have a BMI more than 85th percentile, with 16.9% having a BMI greater than 95th percentile.2 Although there was a significant increase in the prevalence of obesity in the 1980s and 1990s, significant increases were not seen in the latest NHANES data set (2007-2008) except in the highest BMI cohort (97th percentile) of 6- through 19-year-old males. No change has been seen in the prevalence of obesity in females since the 1999-2000 NHANES study. The risk of overweight and obesity is not evenly distributed, with low-income groups and minorities most affected in industrialized societies. In the United States, for example, childhood obesity rates are 24% among African American and 21% among Hispanic populations versus 14% among Caucasians.2
Increased adiposity can lead to both immediate complications in children and adolescents and long-term health consequences as adults. Insulin resistance frequently accompanies obesity, specifically abdominal obesity, reflecting increased visceral and hepatic fat deposition. Insulin resistance is directly related to the degree of adiposity and is further influenced by underlying genetic predisposition and ethnicity. Many of the consequences of obesity, including impaired glucose tolerance (IGT) and type 2 diabetes mellitus (T2DM), dyslipidemia, hypertension, polycystic ovarian syndrome (PCOS), and acanthosis nigricans, are related to insulin resistance. Other consequences of obesity not related to insulin resistance include pulmonary, gastrointestinal, and orthopedic complications. In addition, obese children often suffer from psychosocial complications including depression and low self-esteem.
The prevalence of T2DM is increasing in parallel with the epidemic of childhood obesity. Previously considered an adult disease, the SEARCH for Diabetes in Youth Study Group reported an incidence rate of 11.8 per 100,000 persons per year in the 15- to 19-year age group with the majority of these new cases occurring in African American, Native American, and Hispanic ethnic groups.3 The prevalence of prediabetes in obese pediatric populations is also on the rise. Prediabetes is defined by the American Diabetes Association as either impaired glucose tolerance (IGT), defined as a fasting glucose greater than 100 mg/dL, a 2-hour postoral glucose load level between 140 and 200 mg/dL, or a hemoglobin A1c between 5.7% and 6.5%. Based on NHANES data collected in their 2005-2006 report, approximately 30% of obese adolescents have elevated fasting glucose with 8% exhibiting IGT.4
The relationship between hypertension and obesity is well established in adults. Population, meta-analyses, and screening studies are demonstrating similar relationships in children.5 The rate of hypertension in school-aged children is as high as 10% among children with BMI greater than 97th percentile.6 Although the mechanisms of hypertension in obese children are not completely understood, increased circulating volume and cardiac output have been shown to be important factors. Additional contributions from insulin resistance, sympathetic nervous system activity, inflammation, the renin-angiotensin-aldosterone system, and structural changes in the kidney and cardiovascular system have also been proposed.7
Dyslipidemia is an emerging comorbidity of childhood obesity. Unlike familial hypercholesterolemia (FH), which is characterized by an elevated low-density lipoprotein cholesterol (LDL-C) and a family history of hypercholesterolemia, the pattern of dyslipidemia associated with pediatric obesity consists of a combination of hypertriglyceridemia (TG), decreased high-density lipoprotein cholesterol (HDL-C), and normal to mildly elevated LDL-C.8 NHANES data indicate that this pattern is highly prevalent (42.9%) in children with BMI greater than 95th percentile.9 The nomenclature, secondary atherogenic dyslipidemia, is applied when hypertriglyceridemia, low HDL-C, and normal to elevated LDL-C are found in conjunction with components of the metabolic syndrome.10 In normal-weight children, the same lipid profile is called familial combined dyslipidemia.
The association of dyslipidemia with endothelial dysfunction and accelerated formation of atherosclerotic lesions is well established. Hypertriglyceridemia in adults has been identified as an independent risk factor for coronary artery disease, and is also associated with increased risk of acute pancreatitis.11
Adolescent females with obesity often present with signs and symptoms consistent with hyperandrogenism and ovarian dysfunction, including amenorrhea or oligomenorrhea, acne, and hirsutism. Hyperandrogenism appears to primarily result from hyperinsulinemia. PCOS affects approximately 5% of adult women, primarily those who are overweight or obese, with most women first becoming symptomatic during adolescence (see Chapter 3 for more information on PCOS).
Gastrointestinal disease, including fatty infiltration of the liver and cholelithiasis, may occur in overweight children and correlates with the severity of adiposity. In studies of obese children, 10% to 25% have been found to have elevation of liver enzymes and approximately 50% to 75% have evidence of fatty infiltration of the liver on ultrasound,12 which can progress to liver fibrosis and cirrhosis. Nonalcoholic fatty liver disease (NAFLD) is now the third most common reason for liver transplant accounting for one in every eight liver transplants.13 The duration of obesity, but not its severity, is correlated with the extent of fibrosis. In addition, NAFLD is much more common in obese Hispanic adolescents than in Caucasians. Obese African American adolescents have the lowest prevalence of NAFLD. Furthermore, familial aggregation studies, heritability studies, and genome-wide scans suggest that there is a significant genetic underpinning for the risk of developing NAFLD in association with obesity.14
Obesity is also a risk factor for cholelithiasis and gallbladder disease. Although these are collectively rare in children, almost 50% of cases of cholecystitis in adolescents are associated with obesity.
Pulmonary disease, including both asthma and obstructive sleep apnea, is common in overweight children. The incidence of sleep apnea in obese children is four to five times that seen in nonobese children.15 Severe sleep apnea may ultimately lead to cor pulmonale.
Obesity is a risk factor for the development of orthopedic disorders, including both Blount disease and slipped capital femoral epiphysis (SCFE). Blount disease, also termed tibia vara, occurs when the inner part of the tibia just below the knee fails to develop normally, causing angulation of the tibia. Unlike benign tibia vara that tends to correct with age, Blount disease is progressive and can cause severe bowing of one or both legs. Adolescent-onset Blount disease affects African American males almost exclusively, with a prevalence of 2.5% among the obese adolescent black male population.16
SCFE occurs when the epiphysis of the proximal femur begins to slip off the corresponding metaphysis. SCFE presents as a limp combined with hip pain and/or referred pain to the knee. The affected limb appears to be externally rotated on examination, and there is pain with passive manipulation. Data from a number of studies indicate that 51% to 72% of all SCFE cases occur in obese individuals.16
The most prevalent consequence of childhood obesity may be the stigmatization experienced by the obese child. Teasing is common by both peers and family members, and even health care professionals may display negative biases in their interactions with obese children and adolescents. Multiple studies have shown poor body image, low self-esteem, depression, and even suicidal ideation in children and adolescents teased about their weight.17 Severely overweight children have demonstrated health-related quality-of-life scores comparable to children with cancer.18 The social and economic impacts of childhood obesity may be far-reaching, with at least one study showing that women with a history of overweight in adolescence ultimately completed less schooling, were less likely to be married, had lower household incomes, and had higher rates of poverty than matched controls who had not been overweight.19
The growing economic impact of childhood obesity is staggering. In youth aged 6 to 17 years, financial costs related to treatment of obesity-associated diseases more than tripled from a cost-of-living adjustment of $35 million in 1979-1981 to $127 million in 1997-1999. A recent study estimated that approximately 21% of annual US healthcare spending in 2010 (or $190.2 billion) was related to costs of treatment for overweight, obesity, and their sequelae in both children and adults, with 14 billion attributed to childhood obesity alone.20
Obese children tend to become obese adults. Those at highest risk are adolescents in the highest weight categories who come from families with at least one obese parent.1, 21 The probability of adult obesity (BMI > 30 kg/m2) is more than 50% among children older than 13 years whose BMI percentiles meet or exceed the 95th percentile for age and gender.21
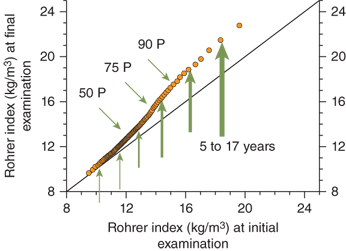
Obesity is clearly a “genetic” disorder that is heavily influenced by environmental factors. Twin studies indicate that 50% to 80% of the tendency to gain weight is genetically determined.22 The adiposity of a child’s parents also has a profound effect on that of the child.23 Furthermore, data from the Bogalusa heart study indicate that the increase in BMI observed in children over the past few decades is not evenly distributed among the population.24 When age-, sex-, and race-adjusted data collected from children in the 1970s are compared to a cohort of children in the 1990s, the adjusted BMI that defines the lower percentiles (ie, the thinnest individuals) changes very little. However, there is a significant further increase in adiposity in individuals already at higher body mass in BMI percentiles (Figure 9-2). Data from the National Health and Examination Survey (NHES) and NHANES III studies demonstrate a similar phenomenon. In summary, there has been little change over the years in adiposity in those individuals genetically predisposed to thinness. Adverse environmental changes in our society appear to have the greatest impact on individuals with a genetic predisposition to obesity.
Figure 9-2
Bogalusa heart study. Graph compares Rohrer index percentiles in cross-sectional studies from 1973 to 1976 (initial examination) and 1992 to 1994 (final examination). The Rohrer index (also referred to as the ponderal index) is often used in statistical analysis when data sets contain very short to very tall individuals. Arrows demonstrate a greater effect of environmental changes on weight gain in the segment of population with a higher body mass. Environmental changes have had less effect on the population genetically predisposed to thinness. (Adapted from Freedman et al.24)
There is no question that changes in the environment have had a profound effect on the prevalence of overweight children. These changes have adversely impacted energy balance, particularly in the genetically susceptible individual. The typical modern Western diet is characterized by high-fat, calorie-dense foods with larger portions. Physical activity has declined in parallel with the increase in the incidence of overweight children.25 Television, computers, and video games have changed how children entertain themselves, with more time spent in sedentary activities. The resulting decrease in caloric expenditure combined with an increase in caloric intake is having profound consequences.
Genetic traits predisposing to obesity likely evolved from genetic modifications that provided a selective advantage for survival. Individuals with a genetic predisposition toward obesity preferentially shunt consumed calories toward storage in adipose tissue and further protect energy stores during starvation by efficiently decreasing energy expenditure.26 Food-seeking behaviors are also more pronounced. In other words, individuals susceptible to obesity have a “thrifty” phenotype that optimizes utilization of energy resources, a selective advantage during famine.
In contrast to those with a “thrifty” phenotype, thin individuals tend to be less efficient with caloric resources, that is, have a “wasteful” phenotype that tends to store less energy as adipose tissue and have less intense food-seeking behaviors. Because genes that comprise the “thrifty” phenotype confer selective advantage during times of famine, these genes would become more prevalent in populations subjected to starvation. There are many historical examples of enrichment of “thrifty” genes that exist in populations.27 Unfortunately, the emergence of a Western diet and sedentary lifestyle has resulted in profound increases of obesity-related complications in these metabolically efficient, thrifty ethnic populations.
Physiologic mechanisms exist that tightly regulate food intake and energy expenditure, even in most overweight and obese individuals. The existence of a tightly regulated feedback system can be demonstrated in long-term clinical studies of weight loss. Weight loss induced by very-low-calorie diets and/or behavior modification is rarely maintained over time. Most individuals tend to gain weight back to a point at or near the prestudy weight. A similar phenomenon can be demonstrated in individuals who are overfed and forced to gain weight.28 These subjects gain adipose mass, but they are generally unable to maintain this degree of adiposity when the study is stopped. They rapidly lose weight and, as a group, end up near their prestudy weight. These observations imply that most individuals have a genetically determined “weight set point.”
The weight set point is maintained in most individuals by adjustments to metabolic rate in response to changes in body mass. Total energy requirements to maintain weight stability in both non–weight-reduced obese and nonobese subjects are similar. Obese individuals who have undergone weight loss, however, require 10% to 15% fewer calories to maintain weight stability than a “non–weight-reduced” person of similar body composition and weight.26 Further weight loss results in further decline in total energy expenditure in an attempt by the individual to protect adipose stores. A sustained decrease in caloric intake in overweight subjects eventually results in a new steady-state body weight, rather than continued weight loss, as the decline in daily energy expenditure equilibrates with the decline in energy consumption (Figure 9-3A). Furthermore, the diet-reduced adipose mass leads ultimately to an increased appetite and difficulty in maintaining the lower caloric intake. A resumption of the “prediet” caloric intake will almost certainly result in a return to the previous obese body weight set point.
Figure 9-3
Weight set point. Changes in caloric intake result in compensatory changes in metabolic rate and appetite as a function of adiposity. (A) If caloric intake decreases, metabolic rate decreases with decreasing adiposity until a new weight set point is achieved that balances caloric intake with energy expenditure. Obese individuals may achieve a normal body mass, but often with a lower than “normal” metabolic rate, and will require a decreased caloric intake despite increased appetite. (B) Small increases in caloric intake have a profound effect on body mass in individuals predisposed to obesity. (C) In contrast, individuals predisposed to “thinness” robustly defend body mass.


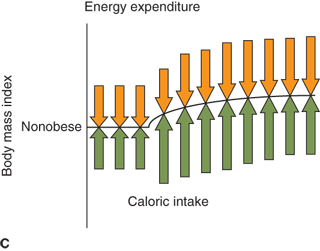
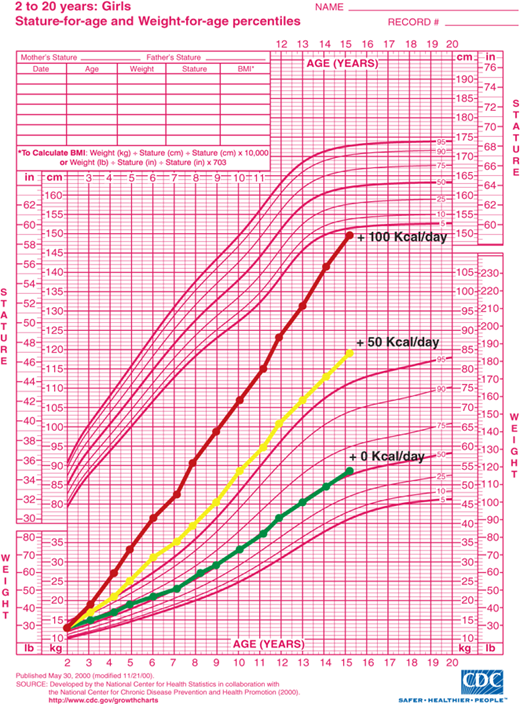
A tightly regulated feedback system that controls body weight is absolutely necessary to keep an individual’s weight relatively stable over time. Thin and normal-weight individuals have feedback systems that regulate appetite and metabolic rate tightly in response to changes in adiposity (Figure 9-3B and C). Feedback systems in individuals genetically predisposed to obesity are not as tightly regulated allowing for greater increases in body mass. If these homeostatic mechanisms did not exist, small, but persistent, increases in caloric intake would result in significant obesity. It has been estimated that approximately 1 lb of adipose tissue is added for every 3500 kcal consumed in excess of caloric requirement for energy expenditure and growth. Assuming no compensatory increase in metabolic rate with increased adipose mass, as little as 50 extra kcal/day for 10 years would result in a 50-lb gain in adipose mass. A caloric intake of 200 kcal/day in excess of caloric expenditure would result in a 100-lb weight gain in as little as 5 years (Figure 9-4). Fortunately, most individuals defend “ideal weight” by alteration of both energy expenditure and food intake. Therefore, the weight of most children tends to follow standard published growth curves. However, if the homeostatic mechanisms are not intact, dramatic weight gain can occur.
Figure 9-4
Estimated weight gain from excess caloric consumption. Projected weight gain assumes all calories consumed in excess of growth and development requirements are converted to body mass and no compensatory adjustments occur in energy expenditure. Lines represent projected weight gain from age 2 to 15 years with 0 kcal/day, 50 kcal/day, and 100 kcal/day in excess of requirements for normal growth and development. (Source: Centers for Disease Control and Prevention, Atlanta, Georgia.)
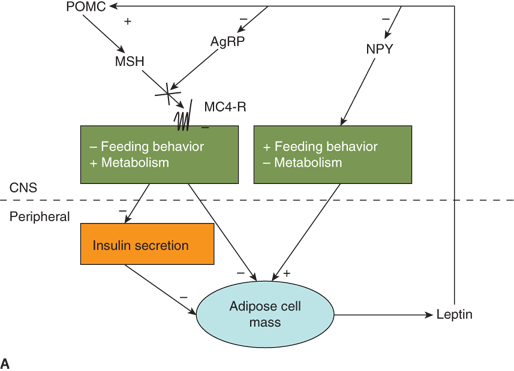
Energy balance and weight set point regulation are accomplished by a complex feedback system. Adequacy of energy stored in the adipocyte is communicated centrally by the adipocyte-derived hormone, leptin. Secreted from adipocytes in proportion to the degree of adiposity, leptin acts at the hypothalamus to inhibit feeding behavior, decrease insulin secretion, and increase metabolic rate.29 As an animal gains weight, leptin levels rise resulting in decreased appetite and increased metabolic rate. Likewise, weight loss leads to a decline in leptin levels and an increase in food-seeking behavior with a decrease in basal metabolic rate.
Leptin signaling in the hypothalamus is primarily via receptors located in the arcuate nucleus. The arcuate nucleus lacks a blood-brain barrier allowing direct communication of peripheral “metabolic” signals including both nutrients and hormones. Leptin signals centrally by inhibiting neurons that contain neuropeptides (neuropeptide Y [NPY] and agouti-related peptide [AgRP]) that stimulate appetite/decrease metabolic rate, while stimulating neurons that contain neuropeptides (eg, MSH derived from proopiomelanocortin [POMC]) that inhibit appetite/increase metabolic rate through binding of the MC4-R receptor (Figure 9-5A).
Figure 9-5
Neuroendocrinology of weight and energy homeostasis. (A) Chronic regulation: Increased leptin secretion in proportion to adipose mass stimulates POMC and inhibits AgRP/NPY neurons. These neurons signal increased feeding behavior, decreased metabolic rate, and decreased insulin secretion. The result is decreased energy storage in adipose tissue and decreased leptin secretion. (B) Acute regulation: Nutrient intake results in increased PYY, increased insulin, and decreased ghrelin levels. These hormones may modulate leptin signals to alter energy homeostasis acutely in response to a meal. AgRP, Agouti-related peptide; MC4-R, melanocortin-4 receptor; MSH, melanocyte-stimulating hormone; NPY, neuropeptide Y; POMC, proopiomelanocortin; PYY, peptide YY.
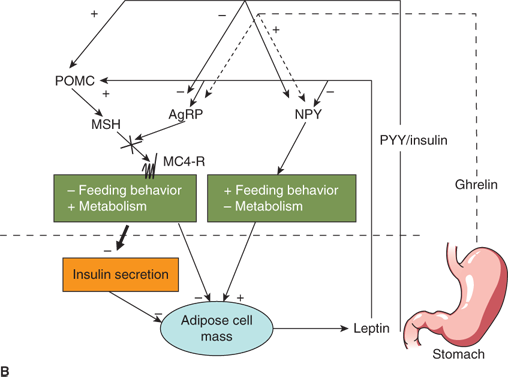
Peripheral signals other than leptin also appear to play a role in appetite regulation and energy homeostasis. Ghrelin, an orexigenic hormone secreted by the stomach, stimulates NPY/AgRP neurons centrally.30 Ghrelin levels rise in the fasted state and decrease with feeding. Another gastrointestinal peptide, peptide YY (PYY), is secreted from the intestine.31 In contrast to ghrelin, PYY appears to be upregulated with feeding. PYY inhibits NPY/AgRP neurons while stimulating POMC neurons. It is theorized that, while leptin serves as a more general indicator of energy stores, ghrelin and PYY modulate leptin signaling to provide short-term feedback on caloric intake (Figure 9-5B). Insulin also appears to signal satiety via central nervous system (CNS) mechanisms similar to leptin. Therefore, postprandial increases in insulin in response to a carbohydrate meal may also act to decrease further food intake.
This complex interplay between peripheral signals of “energy status” and central control of feeding and metabolism must be intact to maintain normal weight homeostasis. If it is loosely regulated or interrupted by genetic defects or hypothalamic injury, energy imbalance and obesity can result.
The type of fat present may also play a role in determining body mass and obesity. There is increasing evidence to support the existence of brown fat in adult humans.32 This mitochondria-rich fat cell was once thought to exist only in newborns but has now been found in diffuse locations within white adipose tissue in adults. White adipose tissue functions as an energy storage depot while brown adipose tissue has a role in the generation of heat from existing energy stores. Activation and uncoupling of the mitochondria in brown adipose tissue result in the generation of heat in response to mild-to-moderately decreased ambient temperatures, a phenomenon termed nonshivering thermogenesis. A well-known trait in other mammals and in newborns, it has recently been established that nonshivering thermogenesis also occurs in many adult humans. Although similar in function, it is likely that the brown adipose tissue discovered in adult humans differs somewhat from that found in other animals including rodents. Classic brown fat found in rodents derives from a common lineage with skeletal muscle. However, the brown fat found in adult humans may derive from cells in white adipose depots that take on a brown adipose cell-like appearance after cold stimulation. In addition, these cells, sometimes referred to as “beige adipose tissue,” are regulated differently than are classic brown adipose cells. Furthermore, this beige adipose tissue seems to increase in white adipose tissue when exposed to the hormone irisin, a peptide secreted from muscle in response to exercise. These discoveries have led to significant research into methods to safely recruit brown and beige adipose tissue in obese individuals as a potential therapeutic approach to obesity treatment.
White adipose tissue was long thought simply to be an energy storage depot. The discovery of leptin, as detailed previously, led to a new understanding of white adipose tissue as an important mediator of a number of metabolic functions. Since this discovery, the list of hormones and cytokines that are released from white adipose tissue, often referred to as “adipokines,” grows longer every year (Table 9-1).33 Collectively, these hormones and inflammatory cytokines mediate many of the metabolic and cardiovascular effects associated with obesity. For example, adiponectin, omentin, apelin, and chemerin may be cardioprotective and inhibit inflammation and endothelial dysfunction while leptin, resistin, and visfatin may contribute to obesity-mediated atheroschlerosis and inflammation. It is very likely that the role of these hormones differs in normal-weight and thin individuals compared to obese individuals. For instance, adiponectin levels are higher in normal-weight subjects and considerably lower in obese subjects, making the cardioprotective role of adiponectin somewhat less relevant in obesity than it is in normal-weight individuals. The relative imbalance of these adipocyte-derived hormones and cytokines in obese states likely contributes to the higher incidence of cardiovascular disease and abnormalities of glucose tolerance seen in obese subjects.
| Adipokine | Major Functions |
|---|---|
| Leptin | Appetite control |
| Adiponectin | Reduces hepatic gluconeogenesis, increases hepatic fatty acid oxidation, and enhances insulin sensitivity |
| Resistin | Increases hepatic and muscle insulinresistance, and induces endothelialdysfunction |
| Visfatin | Acts as an insulinometic and reduces blood glucose levels |
| TNF-α | Induces insulin resistance |
| Omentin | Enhances insulin-mediated glucose uptake |
| Apelin | May be involved in regulation of vascular tone and fluid balance |
| Chemerin | Stimulates lipolysis; decreases glucose uptake in muscle, liver and adipocytes; and recruits macrophages as achemoattractant |
| Vaspin | May enhance glucose uptake |
The metabolic syndrome is defined as a group of factors related to insulin resistance, which predict increased risk for T2DM and cardiovascular disease. The metabolic syndrome definition was initially developed to describe a combination of abdominal obesity, glucose intolerance, hypertension, and dyslipidemia in adults. However, the definition has recently been adapted to include adolescents34, 35 (Table 9-2). The adult-specific criteria were adapted for adolescents to include age- and gender-specific criteria. Although presence of the metabolic syndrome in adults predicts risk for T2DM and cardiovascular disease, the same future risk of cardiovascular disease cannot necessarily be extended to adolescents. Long-term prospective studies to demonstrate a direct connection between the presence of metabolic syndrome in adolescents and cardiovascular disease as adults have yet to be designed. However, adolescents with metabolic syndrome tend to become adults with metabolic syndrome. Therefore, until conclusive studies are available, metabolic syndrome-related risk of future cardiovascular disease is inferred and may warrant early aggressive interventions to increase insulin sensitivity in adolescents with metabolic syndrome.
| International Diabetes Federation Criteria35 | |
|---|---|
| Central obesity (required feature) | |
| Waist circumference | > 90th %ile for age, gender, and ethnicitya or Male ≥ 94 cm Female ≥ 80 cm |
| Plus any two of the following: | |
| Raised triglycerides | ≥ 150 mg/dL |
| Reduced HDL cholesterol | < 40 mg/dL (< 50 mg/dL in females > 16 years) |
| Raised blood pressure | Systolic: ≥ 130 mm Hg or Diastolic: > 85 mm Hg |
| Elevated fasting plasma glucose | Fasting plasma glucose ≥ 100 mg/dL or Previously diagnosed type 2 diabetes |
| Modified Adult Treatment Panel (ATP III) Criteria34 | |
| Any three or more of the following criteria: | |
| Waist circumference | > 75th %ile for age and gendera |
| Raised triglycerides | > 100 mg/dL |
| Reduced HDL cholesterol | < 50 mg/dL, except in boys aged 15-19 years, in whom the cut point is< 45 mg/dL |
| Raised blood pressure | Systolic > 90th %ile for gender, age, and heightb |
| Raised fasting plasma glucose | Fasting plasma glucose > 110 mg/dL |
Estimates of the prevalence of the metabolic syndrome in adolescents depend on the definition used (see Table 9-2). The International Diabetes Federation (IDF) criteria require an increase in waist circumference, emphasizing the role of abdominal adiposity as a predisposing and presumed necessary factor in the pathogenesis of the metabolic syndrome. The Modified Adult Treatment Panel (ATP III) criteria treat waist circumference as an independent and not absolutely necessary factor, implying other factors may predispose an individual to developing the metabolic syndrome independently of significantly increased abdominal fat. It is difficult to directly compare data generated using the IDF criteria with the results from ATP III given their significantly different definitions of metabolic syndrome. Presently, there is no consensus on which definition best reflects the pathophysiology of the metabolic syndrome.
An analysis of data from 2001-2006 NHANES found that 8.6% of US adolescents from 12 to 19 years of age met the ATP III criteria for metabolic syndrome.36 This included 10.8% males and 6.1% females. More Hispanic adolescents (11.2%) had the metabolic syndrome than did Caucasians (8.9%) or African Americans (4.0%). The low prevalence among African American adolescents would be expected to translate to a lower risk of cardiovascular disease in black adults compared to white adults. However, multiple studies indicate that the prevalence of metabolic syndrome-associated morbidities is higher in black adults than in whites further emphasizing the need to use caution in making a direct association with pediatric metabolic syndrome and adult disease.
In adolescents and some children, obesity is often associated with features of the metabolic syndrome, including dyslipidemia, abnormal glucose homeostasis, and hypertension (see Table 9-2). However, body fat distribution is likely to be the most important risk factor for these obesity-related disorders. Increased visceral and hepatic fat, the classic “apple” body type, rather than subcutaneous fat, the classic “pear” body type, is associated with the metabolic syndrome, suggesting distinct biological differences in these two adipose depots.
The specific mechanisms responsible for central adiposity leading to the metabolic syndrome and insulin resistance are not known. Current evidence suggests that metabolic products of omental and mesenteric adipose depots, including inflammatory cytokines and adipocyte hormones, are secreted and released directly into the portal venous system (Figure 9-6). Free fatty acids released from these sites can directly induce hepatic insulin resistance and provide substrate for lipoprotein synthesis. Mediators of inflammation, predominantly tumor necrosis factor-α (TNF-α) and interleukin-6 (IL-6), are elevated in central obesity and decline with weight loss.37 TNF-α signaling cascades appear to directly inhibit insulin-mediated tyrosine phosphorylation of insulin receptor substrate (IRS)-1 leading to insulin resistance in liver and other tissues.38 TNF-α has also been associated with the development of early atherosclerosis. Adiponectin, an adipocyte hormone or “adipokine,” has both insulin-sensitizing and anti-inflammatory actions.39 Unfortunately, levels of adiponectin decline with increasing adiposity. Leptin, an adipokine that increases with increasing adiposity, also promotes insulin sensitivity, likely via central mechanisms within the hypothalamus. However, obesity appears to induce a state of central leptin resistance leading to an inability of high levels of leptin to augment insulin sensitivity with increasing fat mass.
Figure 9-6
Evolution of the metabolic syndrome due to abdominal obesity. (A) Adiponectin is elevated with low abdominal adiposity, leading to increased hepatic and skeletal muscle insulin sensitivity. (B) Adiponectin declines with increased abdominal adiposity while TNF-α and free fatty acids increase. Resulting insulin resistance leads to elevated insulin, dyslipidemia, glucose intolerance, hypertension, and ultimately increased cardiovascular risk. TNF-α, tumornecrosis factor-α.
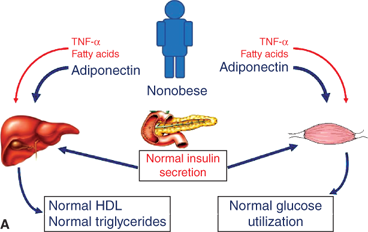
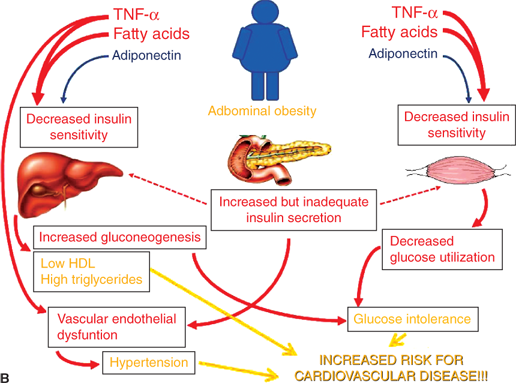
Increasing visceral adiposity leads to decreased hepatic insulin sensitivity, increased gluconeogenesis, increased triglyceride/VLDL synthesis, and decreased HDL cholesterol via the mechanisms discussed previously. In muscle, decreased insulin sensitivity leads to decreased glucose utilization. Increased glucose production and decreased utilization lead to compensatory increased insulin levels to maintain euglycemia. Eventually, insulin production is inadequate leading to glucose intolerance. Ongoing glucose and lipid exposure to the β-cell can lead to further decline in β-cell function and the development of T2DM. Hyperinsulinemia, in addition to obesity-induced inflammatory factors, leads to vascular dysfunction and hypertension. When coupled with an atherogenic lipid profile, risk for future cardiovascular disease is markedly increased.
Dyslipidemias are disorders of lipoprotein metabolism, resulting in abnormal serum levels of LDL-C, HDL-C, and/or triglycerides (TG). NHANES has providedpopulation-based gender- and age-specific standards for lipid and lipoprotein concentrations in children and adolescents.40 Values exceeding the 95th percentile for TG and LDL-C or below the 5th percentile for HDL-C (Table 9-3) are considered abnormal.7 Dyslipidemias in children may be hereditary, secondary, or associated with environmental factors such as diet and physical inactivity.
| Normal (mg/dL) | Borderline (mg/dL) | Abnormal (mg/dL) | |
|---|---|---|---|
| Total cholesterol | < 170 | 170-199 | ≥ 200 |
| Triglycerides | < 90 | 90-129 | ≥ 130 |
| HDL-C | > 45 | 40-45 | < 40 |
| LDL-C | < 110 | 110-129 | ≥ 130 |
| Non–HDL-C | < 120 | 120-144 | ≥ 145 |
Major disorders of monogenic primary hypercholesterolemia are summarized in Table 9-4. Other monogenic dyslipidemias, leading to insufficient LDL-C levels (abetalipoproteinemia, hypobetalipoproteinemia, proprotein convertase subtilisin/kexin type 9 loss-of-function mutations, and primary bile acid malabsorption), are very rare and not addressed in detail in this chapter.
| Phenotype | Disorder | Genetic Defect | Transmission | Frequency | Lipid Values |
|---|---|---|---|---|---|
| Hypercholesterolemia | Homozygous familial hypercholesterolemia (HoFH) | LDLR | AD | 1:1,000,000 | LDL-C ↑↑↑ |
| Heterozygous familial hypercholesterolemia | LDLR | AD | 1:500 | LDL-C↑↑ | |
| Autosomal dominanthypercholesterolemia | Familial defectiveapolipoprotein B | Apo B-100 | AD | 1:700 (North-central Europe) | LDL-C↑↑ |
| PCSK9 gain of function | PCSK9 | AD | Rare | LDL-C↑↑ | |
| Recessivehypercholesterolemia | Autosomal recessive hypercholesterolemia β-Sitosterolemia | ARH ABCG5 ABCG8 | AR AR | 1:100,000 Rare | Similar to HoFH LDL-C↑↑ and plasma sitosterol and campesterol↑ |
| Hypertriglyceridemia | LPL deficiency | LPL | AR | 1:1,000,000 | |
| Apo CII deficiency | Apo CII | AR | 1:1,000,000 | ||
| Hyperchylomicronemia | Apo AV deficiency | Apo AV | AR | Very rare | |
| LMF1 deficiency | LMF1 | AR | |||
Hypercholesterolemia and Hypertriglyceridemia Hypoalphalipoproteinemia | GPIHBP1 deficiency Cholesterol ester Storage disease Wolman disease Tangier Disease LCAT deficiency | GPIHBP1 LIPA LIPA ABCA1 LCAT | AR AR AR AR AR | Rare Rare Very rare Very rare | LDL-C and TG↑ HDL-C↓ TC↑↑ and TG↑↑ HDL-C↓↓↓ HDL-C↓↓↓ |
Stay updated, free articles. Join our Telegram channel

Full access? Get Clinical Tree


