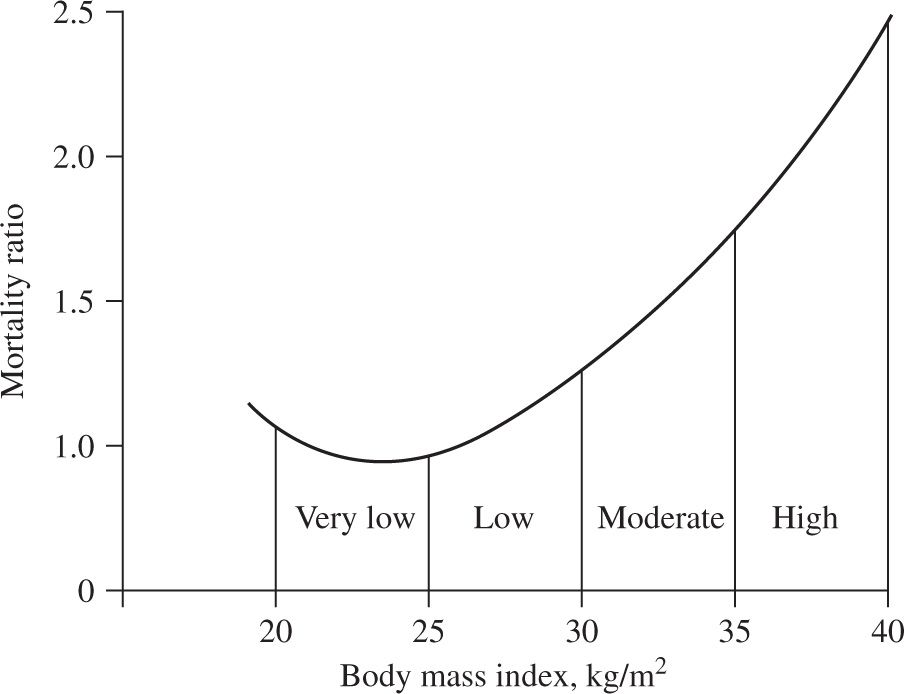
Figure 14-1. Relationship between body mass index and mortality risk in adult men and women in the United States. (Bray GA. Obesity: basic considerations and clinical approaches. Dis Mon 1989;35:454.)
Obesity paradox. The relationship between BMI and mortality risk is also complicated by the presence of certain concomitant diseases. Being overweight or obese in patients with cardiovascular disease (CVD; myocardial infarction, congestive heart failure, hypertension and coronary heart disease, coronary artery bypass graft surgery, heart transplant), end-stage renal disease, hip fracture, rheumatoid arthritis, and tuberculosis is associated with lower mortality rates than patients with normal BMI values (9–17). The reason for this phenomenon, known as the “obesity paradox”, is not known.
BMI and disease. The relationship between BMI and disease risk differs from the relationship between BMI and mortality risk. Therefore, overweight can be a risk factor for certain medical conditions without being a risk factor for mortality. In fact, the risk of developing an obesity-related disease, such as diabetes, begins to increase at BMI values that are within the normal-weight range (23 kg per m2 in women and 24 kg per m2 in men) (Figure 14-2) (18,19). Other factors, such as body fat distribution (intrahepatic triglyceride content, intra-abdominal fat volume, and waist circumference) (20–22), level of cardiopulmonary fitness (23,24), and ethnic/racial background (25,26), also modify BMI-related risk. For example, at the same BMI values as Caucasians, Asian-Pacific populations are at increased risk for the development of diabetes and CVD. Accordingly, the World Health Organization has proposed maintaining the current BMI cutoff points as international classifications in Southeast Asian populations, but reducing the BMI cutoffs for potential public health action to 17.5 to 22.9 kg per m2 as “normal weight”, 23.0 to 27.4 kg per m2 as “overweight,” and greater than or equal to 27.5 kg per m2 as “obese” (27).
Body Mass Index (BMI)–Associated Mortality Risk |
| Obesity Class | BMI (kg/m2) |
Underweight |
| <18.5 |
Normal |
| 18.5–24.9 |
Overweight |
| 25.0–29.9 |
Obesity | I | 30.0–34.9 |
| II | 35.0–39.9 |
Extreme obesity | III | ≥40.0 |
Adapted from National Institutes of Health, National Heart, Lung, and Blood Institute. Clinical Guidelines on the Identification, Evaluation, and Treatment of Overweight and Obesity in Adults—The Evidence Report. Bethesda (MD): National Heart, Lung, and Blood Institute; 1998 Sep. Report No.: 98-4083.
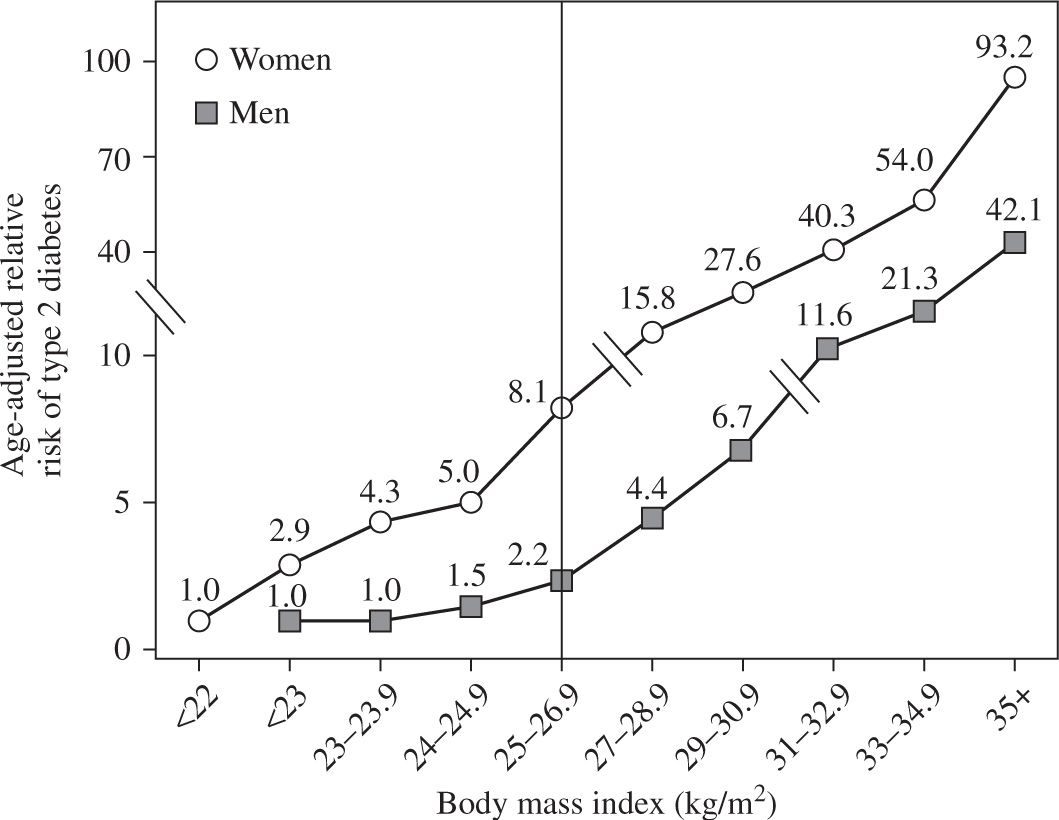
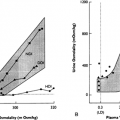
Figure 14-2. Relationship between body mass index and type 2 diabetes in men and women. The vertical line separates lean from overweight and obese persons. Data from: Colditz GA, Willett WC, Rotnitzky A, et al. Weight gain as a risk factor for clinical diabetes mellitus in women. Ann Intern Med. 1995;122:481–486; Chan JM, Rimm EB, Colditz GA, et al. Obesity, fat distribution, and weight gain as risk factors for clinical diabetes in men. Diabetes Care. 1994;17:961–969.
Childhood obesity. In children, the BMI normal range changes with age and is different in boys and girls. In infants (birth to 36 months), “obesity” is defined as weight more than 95th percentile for length and sex (Figure 14-3A and B). In children and adolescents (age 2–20 years), “obesity” is defined as BMI greater than 95th percentile for age and sex (Figures 14-3C and D) (www.cdc.gov/growthcharts). Obesity-related diseases that typically are seen in adults, such as type 2 diabetes mellitus, hyperlipidemia, hypertension, orthopedic complications, sleep apnea, gallbladder disease, and nonalcoholic steatohepatitis, are now being seen with increasing frequency in children. In addition, early-onset obesity is associated with an increased chance of being an obese adult and an increased risk of obesity-related diseases (28,29).
PREVALENCE
The global prevalence of obesity in children and adults has continued to increase from 1980 to 2013 in both developed and developing countries, although the rates have markedly slowed in some developed countries such as the United States. Island nations in the Pacific and the Caribbean and countries in the Middle East and Central America have the highest prevalence rates of obesity (30). Data from the 2011–2012 NHANES found that 16.9% of youth (age 2–19 years) and 34.9% of adults (age ≥20 years) in the United States were obese (31). Although the overall prevalence of obesity did not differ between men and women, it was much higher in non-Hispanic Black women (57%) than men (37%). In addition, the prevalence of obesity was higher among non-Hispanic Black (48%), Hispanic (43%), and non-Hispanic White (33%) adults than among non-Hispanic Asian adults (11%).
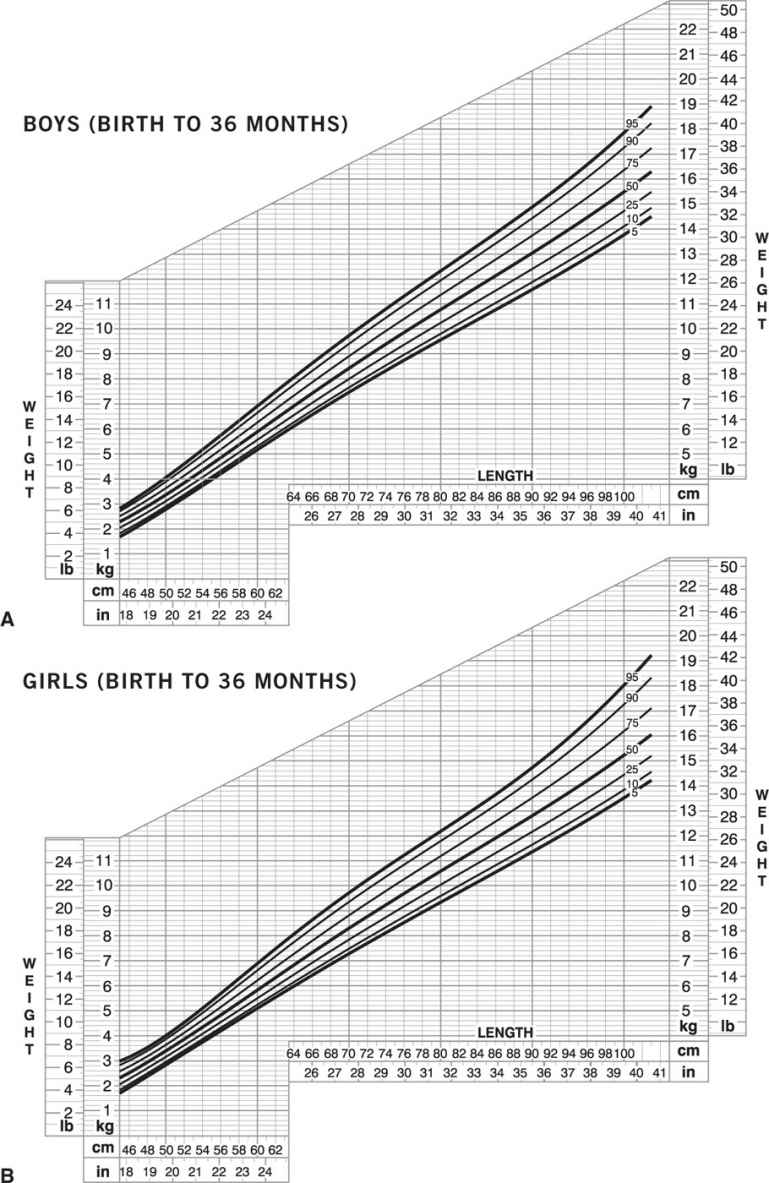
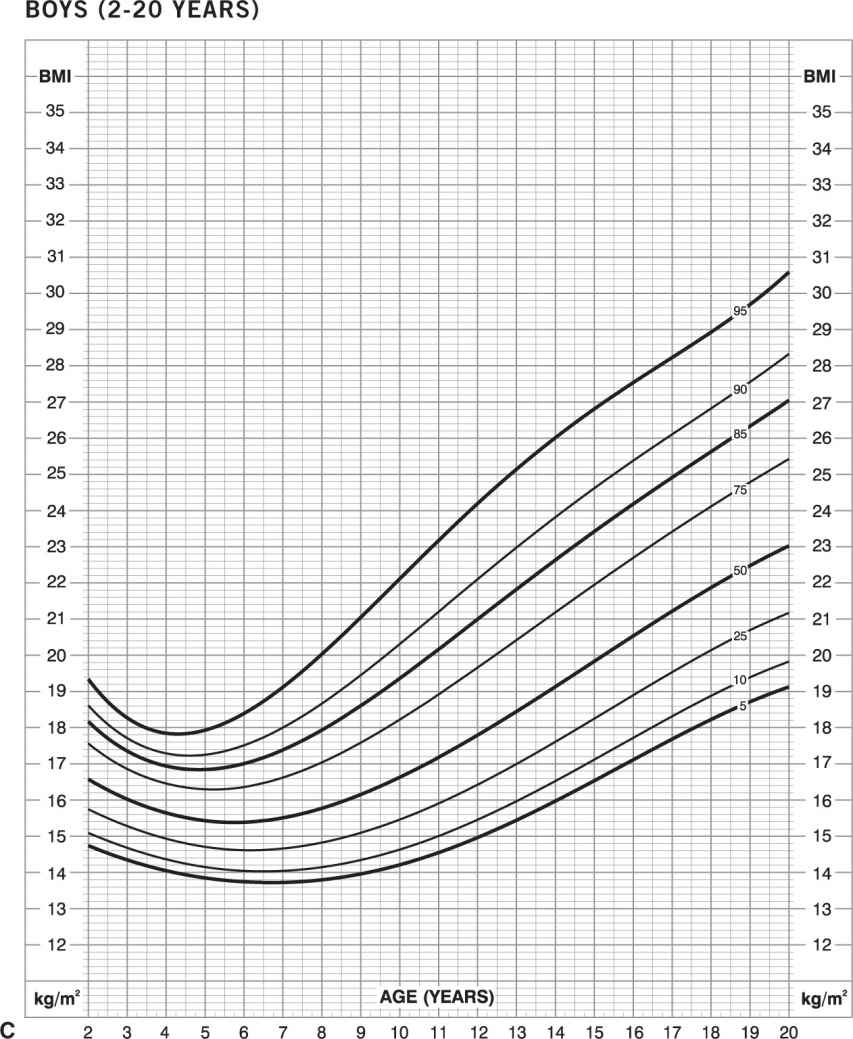
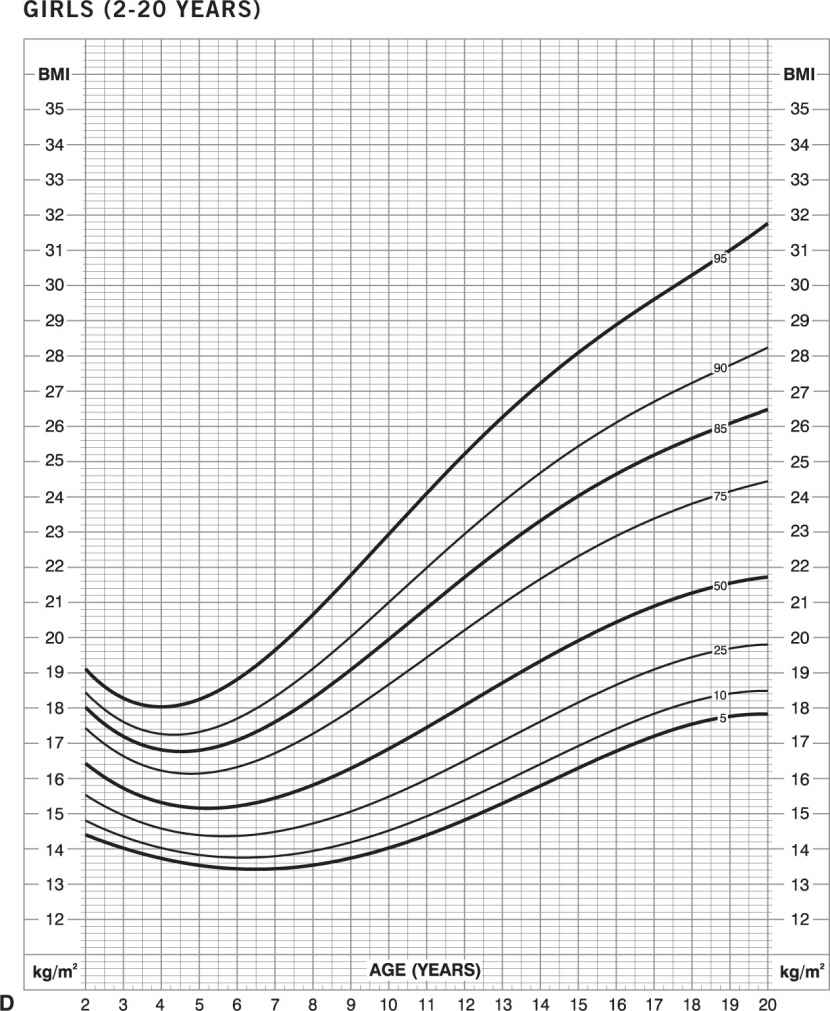
Figure 14-3. Growth charts for children. Obesity is defined as weight greater than or equal to 95th percentile for length and sex in infants (birth to 36 months): boys (A) and girls (B). Obesity is defined as BMI greater than or equal to 95th percentile for age and sex for children and adolescents (age 2–20 years): boys (C) and girls (D) (www.cdc.gov/growthcharts).
PATHOGENESIS
Energy balance. In all persons, obesity is caused by ingesting more energy than is expended (and needed for organ growth and development in children and adolescents) over a long period of time. This initial positive energy balance generates an accumulation of body fat, which must be maintained by continued adequate energy intake. However, the mechanisms responsible for ultimate body weight involve a complex interaction among genetic, endocrine, neurologic, psychologic, behavioral, developmental, and environmental factors, and differ among individuals.
Dietary energy components are comprised of carbohydrate, protein, and fat, and a smaller component from alcohol. However, not all ingested calories are absorbed; approximately 5% of energy intake is lost in feces, but the exact amount of energy absorbed from the diet depends on the specific foods eaten, food preparation, mastication, and intestinal factors. Daily total energy expenditure (TEE) is comprised of (1) resting energy expenditure (REE, i.e., energy expended for normal cellular and organ function during postabsorptive resting conditions; approximately 70% of TEE), (2) thermic effect of food (i.e., the increase in energy expenditure associated with digestion, absorption, and increased sympathetic nervous system activity after eating a meal; approximately 10% of TEE), and (3) energy expended in physical activity (i.e., energy cost of volitional mechanical work, such as exercise and daily activities, and nonvolitional activity, such as fidgeting, spontaneous muscle contractions, and maintaining posture; approximately 20% of TEE). Energy requirements differ among body tissues. Highly active organs, such as the liver, gut, brain, kidney, and heart, have the highest energy requirements per gram of tissue. In a lean adult, these organs account for approximately 75% of the resting metabolic rate, although they constitute only 10% of total body weight. In contrast, resting skeletal muscle consumes approximately 20% of resting metabolic rate but represents approximately 40% of body weight, and adipose tissue consumes less than 5% of resting metabolic rate but usually accounts for more than 20% of body weight.
Daily TEE in obese people is almost always greater than daily TEE in lean people who are the same height, because the larger body mass, comprised of active organs and tissue, consumes more calories at rest and requires more energy for weight-bearing physical activity. Therefore, an obese person must consume more calories than a corresponding lean person to maintain a larger body mass. In fact, defects in REE or TEE have not even been found in “diet-resistant” patients, who fail to lose weight despite claiming strict adherence to a low-calorie diet (32,33). These patients unknowingly underestimate their food intake and can consume twice as many calories as recorded in daily food records.
Small but chronic increases in energy intake can lead to large increases in body fat. For example, consuming an additional 10 kcal every day will lead to approximately 1 lb of eventual weight gain, when body weight reaches a new steady state and energy intake equals energy expenditure (34). It will take about 1 year to achieve 50% and approximately 3 years to achieve 95% of this increase in weight. Consuming an extra candy bar (~220 kcal) as a snack every day will result in a gain of approximately 11 lbs (5 kg) in 1 year and approximately 22 lbs (10 kg) in 3 years.
Genes and environment. A small percentage of obese people have a primary genetic cause for their obesity. More than 50 loci related to Mendelian obesity syndromes, often associated with mental retardation, dysmorphic features, and organ-specific developmental abnormalities, have been mapped, and hundreds of people have been identified whose obesity is the consequence of single-gene mutations, such as leptin, leptin receptor, prohormone convertase 1, pro-opiomelanocortin, melanocortin 3 and 4 receptors, and SIM1 (35–41). Chromosomal defects can also cause obesity. The Prader–Willi syndrome, in which genes on chromosome 15 (q 11–13) are deleted or unexpressed on the paternal chromosome, is characterized by chronic hunger with excessive eating and life-threatening obesity, cognitive disabilities, short stature, and secondary hypogonadism; it is the most common syndromic cause of obesity, occurring in 1 of every 25,000 births (42). Even though more than 200 genes have been linked with the human obesity phenotype and more than 250 quantitative trait loci for obesity-related phenotypes have been identified (43), these genes are responsible for only a small fraction of the variance in body weight among people. Nonetheless, the remarkable similarity in BMI values among monozygotic twins reared together or apart suggests a strong influence of genetics on ultimate body weight (44,45).
Alterations in environmental factors have occurred in the last several decades that facilitate an increase in energy intake and a decrease in physical activity, thereby contributing to the development of obesity. More meals are now eaten outside the home, there is greater availability and consumption of convenience and snack foods, serving sizes are larger, and daily physical activity has decreased because of sedentary lifestyle and work activities. Persons with certain genetic backgrounds are particularly predisposed to weight gain and obesity-related diseases when they are exposed to a “modern” lifestyle. For example, Pima Indians living in Arizona have experienced a dramatic change in their lifestyle, which has led to an epidemic of obesity and diabetes in the last 60 years (46). These Pimas now eat a high-fat, high-calorie diet rather than their traditional low-fat diet and are much more sedentary than when they lived as farmers. In contrast, Pima Indians who live in the Sierra Madre Mountains of Northern Mexico have been isolated from Western influences, eat a traditional Pima diet, and are physically active as farmers and sawmill workers. The Pimas of Mexico have a much lower incidence of obesity and diabetes than those who live in Arizona.
Early life factors. The in utero environment can affect the future risk of obesity and obesity-related metabolic diseases in adulthood. Adults who were small for gestational age at birth, defined by a low birth weight, low ponderal index (birth weight/length3), or small head circumference, are more likely to have a higher BMI, the metabolic syndrome, and coronary artery disease than men and women who were normal-sized at birth (47,48).
Both childhood and parental obesity affect the risk of obesity in adulthood (49). The probability of a child becoming an obese adult increases based on the age and severity of obesity in childhood and whether one or both parents are obese. For example, an obese child at 1 or 2 years of age who has lean parents does not have an increased risk of obesity in adulthood, whereas being obese after 6 years of age is associated with more than a 50% chance of being an obese adult. In addition, the presence of obesity in one or both parents increases the risk of obesity in their offspring. If neither parent is obese, the offspring have a 10% chance of becoming obese, whereas having one obese parent increases the risk for obesity to 40%, and the risk increases to 80% if both parents are obese.
Circadian rhythm and sleep: Many physiological processes are influenced by internal recurrent daily rhythms, which likely represent an adaptation to the Earth’s rotation around the sun and the recurrent 24-hour light–dark cycles in the external environment. These circadian rhythms are important for maintaining health; disruption of circadian rhythm can have adverse effects on body weight and metabolic function. Inadequate sleep is associated with an increased risk of developing obesity. Experimentally-induced sleep restriction increases hunger and appetite, and data from both prospective and cross-sectional epidemiological studies show an association between short-duration and/or poor-quality sleep and the prevalence of obesity and the cardiometabolic complications associated with obesity (diabetes, metabolic syndrome, hypertriglyceridemia, and hypertension) (50,51).
MEDICAL COMPLICATIONS OF OBESITY
Obesity is an important risk factor for many serious medical complications (Table 14-3), which lead to impaired quality of life, considerable morbidity, premature death, and economic burden (52). The most common complications of obesity involve alterations in metabolic function that are risk factors for CVD, namely insulin resistance, diabetes, dyslipidemia (increased serum TG and decreased serum HDL-cholesterol), and increased blood pressure (53). However, not all obese persons develop metabolic complications, and approximately 25% of obese adults are “metabolically normal” based on insulin sensitivity measured by using the hyperinsulinemic euglycemic clamp technique (54). In addition, data from the 1994 to 2004 NHANES found that about one-third of obese adults were metabolically normal, defined as having less than one cardiometabolic abnormality (based on blood pressure, homeostasis model assessment of insulin resistance [HOMA-IR] value, and plasma glucose, triglyceride, HDL-cholesterol, and C-reactive protein [CRP] concentrations) (55). Metabolically-normal obesity, also known as “metabolically healthy but obese,” “uncomplicated obesity,” and “metabolically benign obesity,” is further characterized by less visceral and liver fat compared with metabolically-abnormal obese persons (56,57). Moreover, metabolically-normal obese persons are at lower risk of developing future diabetes and CVD than metabolically-abnormal obese or metabolically-abnormal lean persons, but are usually at higher risk than metabolically-normal lean people (58,59).
Medical Complications Associated with Obesity |
Endocrine/metabolic | Insulin resistance, prediabetes, type 2 diabetes, dyslipidemia, metabolic syndrome, polycystic ovary syndrome |
Cardiovascular | Hypertension, coronary heart disease, congestive heart failure, dysrhythmias, pulmonary hypertension, ischemic stroke, venous stasis, deep vein thrombosis, pulmonary embolus |
Respiratory | Abnormal pulmonary function, obstructive sleep apnea, obesity hypoventilation syndrome |
Gastrointestinal | Gallstones, pancreatitis, abdominal hernia, nonalcoholic fatty liver disease, gastroesophageal reflux disease |
Musculoskeletal | Osteoarthritis, gout, low back pain |
Gynecologic | Abnormal menses, infertility |
Genitourinary | Urinary stress incontinence |
Ophthalmologic | Cataracts |
Neurologic | Idiopathic intracranial hypertension |
Cancer | Liver, pancreas, stomach, esophagus, colon, gallbladder, kidney, prostate, multiple myeloma, postmenopausal breast, uterus, cervix, ovary, non-Hodgkins lymphoma |
Postoperative events | Atelectasis, pneumonia, deep vein thrombosis, pulmonary embolus |
WEIGHT MANAGEMENT APPROACH TO THE OBESE PATIENT
Clinical Evaluation
The medical evaluation (history, physical examination, and blood tests) should include (1) a history of body weight, previous attempts at weight loss and lifestyle (dietary activity and sleep) habits to assess effectiveness of previous weight loss efforts and help identify potential lifestyle factors that contribute to the person’s obesity; (2) a review of family history of obesity and obesity-related diseases; (3) an assessment of medications (Table 14-4) and medical conditions (e.g., Cushing syndrome) that can increase body weight; and (4) an evaluation to determine the presence and severity of obesity-related disease risk factors for disease, active medical diseases, and functional quality of life (Table 14-5). This approach provides important information that can help guide therapeutic options and align the intensity and type of weight loss therapy with the medical need to lose weight and the treatment options that are likely to have the most success. In addition, an understanding of the patient’s obesity-related health risks and complications helps define clinical targets that indicate successful weight loss outcomes rather than simply the amount of weight loss itself.
Therapy
General Principles
The key to obesity therapy is to eat fewer calories than are expended in order to consume endogenous fat stores as fuel. Decreasing daily energy intake by 10 kcal will result in about a 1 lb weight loss; it will take approximately 1 year to achieve 50% and approximately 3 years to achieve 95% of this weight loss (34). The decrease in body mass induced by a negative energy balance results in a decrease in daily TEE. At some point, the reduced-energy diet consumed will equal energy expended, so weight loss will stop and body weight will plateau at a new lower level. Successful weight management strategies should appreciate the following 10 principles: (1) the major goals of weight loss therapy are to improve or eliminate obesity-related health risk factors, comorbidities, and/or improve physical function and quality of life; (2) obesity is a chronic illness that requires long-term treatment for long-term success; (3) even compliant patients will stop losing weight and reach a weight plateau (usually after ~6 months of therapy), so further weight loss will require a greater reduction in energy intake or increase in energy expenditure, or both; (4) a patient must be willing and ready to make lifestyle changes to achieve successful weight loss; (5) a slow rate of weight loss (<2% body weight loss per week) achieved by consuming a low-calorie diet is associated with less risk of developing weight loss–induced gallstones than rapid rate of weight loss achieved by consuming a very-low-calorie diet (VLCD; <800 kcal per day); (6) behavioral therapy, particularly encouraging self-monitoring, is necessary for long-term lifestyle changes; (7) exercise has important metabolic, cardiovascular, functional, and psychological benefits, but does not produce effective weight loss in most people; (8) attempts to change a patient’s medications from those that cause weight gain to those that are weight neutral or induce weight loss should be made, if medically acceptable; (9) minimal weight loss (as little as 2%) can have therapeutic cardiometabolic benefits, and greater weight loss results in progressive dose–response improvement in health outcomes; and (10) more aggressive therapy (greater dietary restrictions and meal replacements, more intensive behavioral therapy, pharmacotherapy, and bariatric surgery) should be initiated in patients who are unable to achieve weight loss targets with current therapy.
Prescription Drugs Associated with Weight Gain |
Psychotropic medications
Second-generation antipsychotics (atypical antipsychotics):
High risk: clozapine, olanzapine
Medium risk: iloperidone, paliperidone, quetiapine, risperidone
Low risk: aripiprazole, asenapine, lurasidone, ziprasidone
Antidepressants: paroxetine, mirtazapine, tricyclics, monoamine oxidase inhibitors
Mood stabilizer: lithium
Antiseizure medications: valproic acid, divalproex, carbamazepine, gabapentin
Diabetes medications: meglitinides, thiazolidinediones, sulfonylureas, insulin
Antihypertensives: clonidine, amlodipine,
β-Adrenergic blockers: propranolol, atenolol, metoprolol
Steroid and sex hormones: prednisone, methyl prednisolone, tamoxifen, estrogen, progestins
Antihistamines: diphenhydramine, cetirizine, fexofenadine
Protease inhibitors
Indications for Intensive Obesity Therapy |
Obesity-Related Risk Factors for Cardiometabolic Disease:
Poor glycemic control: impaired fasting glucose, impaired glucose tolerance, HbA1c 6%–6.5%
Abnormal lipid profile: increased triglyceride, decreased HDL-cholesterol, increased small dense LDL
Increased blood pressure
Metabolic syndrome
Family history of diabetes and cardiovascular disease
Common Obesity-Related Diseases:
Diabetes
Hypertension
Hypertriglyceridemia
Nonalcoholic fatty liver disease
Pulmonary dysfunction: obstructive sleep apnea, obesity hypoventilation syndrome
Cardiovascular disease
Osteoarthritis
Infertility
Obesity-Related Effects on Quality of Life and Function:
Joint pain
Impaired mobility
Poor endurance
Impaired quality of life
Consideration of Specific Treatment Options
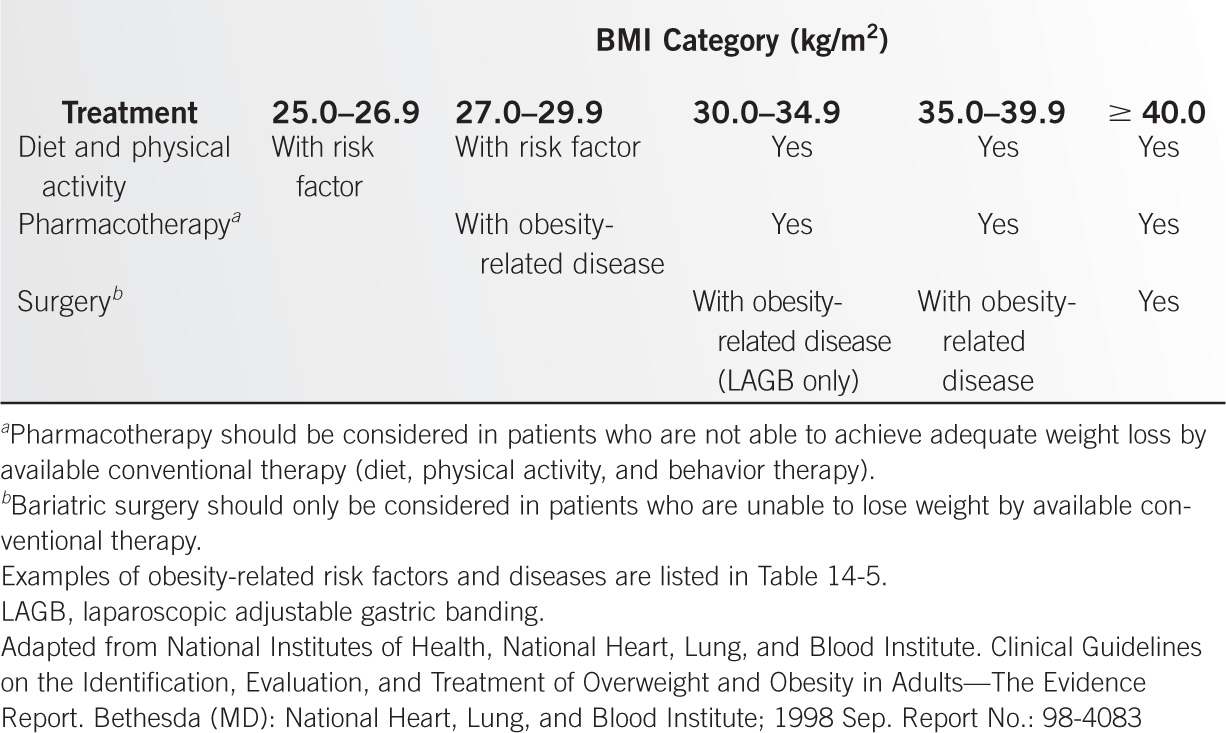
The current therapeutic options available for weight management include lifestyle intervention (diet, physical activity, behavior modification), pharmacotherapy, and surgery. In general, the weight loss efficacy of pharmacotherapy is greater than lifestyle intervention (dietary intervention, physical activity, behavior modification), and the weight loss efficacy of bariatric surgery is greater than pharmacotherapy, and these modalities can be used alone or in combination with each other. However, the increase in treatment efficacy is associated with increased costs and risks of complications. The indications for using specific weight loss therapies, based on the clinical guidelines developed by an expert panel convened by the National Heart, Lung and Blood Institute, was published as a monograph in October 2000 (Table 14-6) (60). This approach was focused on the prevention and treatment of CVD. The composite of body weight classification (based on BMI), current cardiovascular illnesses, and risk factors for future coronary heart disease (identified by the medical examination) is used to determine the need for and aggressiveness of obesity therapy. An effective treatment plan must also consider patients’ willingness to undergo therapy, their ability to comply with specific treatment approaches, access to skilled caregivers, and financial considerations. Weight loss therapy is not recommended for patients with a BMI less than 25 kg per m2; however, providing recommendations for a healthy lifestyle, including dietary and physical activity modification, is reasonable for lean persons who have, or are at increased risk for, metabolic and CVDs. An algorithm for the evaluation and treatment of the obese patient was recently developed by The Obesity Society, the American College of Cardiology, and the American Heart Association (Figure 14-4) (61). This algorithm incorporates a chronic disease model into the treatment of obesity and uses a stepwise series of questions to guide evaluation and therapy. The algorithm is disease-focused, rather than simply weight-focused, in that it highlights the need to identify and treat obesity-related medical complications, incorporates an assessment of health risk in the need to lose weight, and includes both health targets and weight loss targets as treatment goals.
Lifestyle Intervention
Although many obese persons can achieve short-term weight loss by making lifestyle changes in dietary intake and physical activity, successful long-term weight maintenance is much more difficult to achieve and most people who lose weight regain their lost weight over time. Collaboration with other health-care professionals (e.g., an experienced weight management dietitian or behaviorist) for additional counseling should be considered to provide more effective therapy. The initial goal of therapy should not simply be to reach a targeted body weight, but also provide goals related to specific health outcomes and quality of life. The effectiveness of even intensive lifestyle therapy and a low-calorie diet is moderate, and usually results in 5% to 10% weight loss in one year. Nonetheless, this amount of weight loss can have considerable medical benefits. However, these results are derived from studies conducted in obese subjects who are ready to lose weight and have enrolled in weight loss trials.
Diet Therapy
Decreasing energy intake is the cornerstone of weight loss therapy, and is most effective when diet education is provided in conjunction with behavioral therapy. Most diets proposed for losing weight vary in energy content and macronutrient composition. However, the energy content, not the relative macronutrient composition of the diet, is the primary determinant of weight loss. The calorie content of selected common foods is provided in Table 5-9, Chapter 5
Related posts:
 Nutritional Considerations in Chronic Diseases
 Dietary Management of Diabetes, Renal Disease, and Hyperlipidemia
 Use of Diets and Dietary Components in Clinical Practice
 DIABETES INSIPIDUS
 Cryoablation Therapy for Metastatic Paraganglioma
 A Huge Adrenal Myelolipoma in a Patient With a Suboptimally Controlled Congenital Adrenal Hyperplasia
Stay updated, free articles. Join our Telegram channel

Full access? Get Clinical Tree


