Chapter 18 Nelfinavir
Nelfinavir (Viracept) was the fourth protease inhibitor (PI) approved by the US Food and Drug Administration (FDA) for the treatment of human immunodeficiency virus (HIV)-infected individuals and the first PI to receive concomitant approval in both children and adults. Similar to the other drugs in its class, nelfinavir diminishes HIV replication by inhibiting the HIV-1 protease enzyme required for viral particle maturation. Nelfinavir monotherapy given for 28 days lowers levels of HIV RNA in the plasma by 1–2 log10 copies/mL in protease-naive patients. Like the other available PIs, nelfinavir is extensively metabolized by cytochrome P450 (CYP) including CYP3A4 and CYP2C19. Primarily CYP3A4 is inhibited at concentrations within the therapeutic range, necessitating careful attention to concomitant medication administration. Gastrointestinal side-effects can accompany nelfinavir administration, but overall the drug is well tolerated.
STRUCTURE
The development of nelfinavir is an example of ‘rational’ drug design, wherein computer technology is applied to design compounds based on the crystallographic structure of a target enzyme, circumventing traditional drug development, which relies on mass screening of thousands of potential compounds.1,2 Nelfinavir is the mesylate salt of a basic amine that was designed to maximize binding and stability of the ligand to the active site of HIV protease. Its molecular weight is 663.90 (567.79 as the free base); and it is slightly soluble in water at pH 2 or lower and freely soluble in methanol, ethanol, isopropanol, and propylene glycol. It is a nonpeptidic PI (KI 2 nM) that is active against HIV-1 and HIV-2. Computer models using evolutionary programming to predict docking of flexible ligands reproduced the structure of nelfinavir in 34 of 100 simulations.3,4
MECHANISM OF ACTION AND IN VITRO ACTIVITY
Nelfinavir blocks HIV replication by competitively inhibiting the cleavage of HIV p55 Gag and pl60 GagPol precursor polyproteins to structural proteins and enzymes by the protease enzyme. The target of nelfinavir and other PIs is the final enzymatic step required to produce mature viral progeny. HIV precursor polyproteins, transcribed and translated from cells with integrated proviral DNA, must be cleaved at eight distinct sites to produce functional, mature virions. Virions produced in the presence of nelfinavir and other PIs are defective particles, which (as seen by electron microscopy) lack the electron-dense core characteristic of mature, infectious HIV. They are unable to infect new cells and are cleared from the circulation by an unknown mechanism.5
The antiviral activity of nelfinavir has also been evaluated against wild-type and drug-resistant HIV-1 strains in lymphocyte cell lines and in monocyte cell culture. In vitro, the mean inhibitory concentration is 21 nM (range 9–60 nM) in models of acute infection that include HIV-1 strains IIIB, RF, and the clinical isolate HIV-1 RoJo.6 During infection of a macrophage cell line with HIV-1 strain Ba-L, the inhibitory concentration is low at 23 nM. Similarly, nelfinavir has also been evaluated and found to be effective against HIV-1 strains resistant to zidovudine and non-nucleoside reverse transcriptase inhibitors (NNRTIs), including pyridinones, nevirapine, and TIBO compounds.7,8 The 50% cytotoxic concentration ranged from 23 to 28 μM for HIV-1 RF in CEM-SS cells and HIV-IIIB in MT-2 cells, respectively, yielding a therapeutic index of 526–916.6 This high therapeutic index of nelfinavir reflects the potent antiviral activity and relatively low cytotoxicity present in cell culture systems.
PHARMACOKINETICS
The absorption of nelfinavir has been compared across several formulations, including: 250 mg tablet, 625 mg tablet, oral powder and liquid suspension.9 Nelfinavir (250 mg tablet) is well absorbed with an estimated oral bioavailability of 78%. Concomitant administration of food enhances both the maximum plasma concentration (Cmax) and area under the curve (AUC) plasma concentrations two- to threefold. Fat content of meals does not influence absorption. However, in a study of healthy volunteers given a single oral dose of 1250 mg, the two formulations (250 mg and 625 mg tablet) were not bioequivalent in the fasted state.10 The 650 mg formulation had greater absorption with an AUC and Cmax that were 34% and 24% higher than the 250 mg formulation. Administration with a meal improved the bioavailability of the 250 mg formulation to levels comparable with the 650 mg tablets. In addition, nelfinavir pharmacokinetics after a single dose with food in healthy volunteers were similar for the oral powder and liquid suspensions compared to the 250 mg tablet formulation.9,11
Plasma levels and antiviral activities were determined in HIV-infected patients for nelfinavir and its metabolites during 28 days of therapy with 750 mg three times daily.12 Nelfinavir was the major chemical species reaching a peak plasma concentration of 5.04 + 2.56 μM 2 to 5 h after dosing, followed in decreasing quantities by its metabolites hydroxyl-t-butylamide (M8) and 3′-methoxy-4′-hydroxynelfinavir (M1). Antiviral activity was determined in CEM-SS cells with HIV-1 RF strain and the 50% effective concentration of nelfinavir, M8, and M1 were 30, 34, and 151 nM, respectively. At steady state, the mean Cmax and minimum plasma concentration (Cmin) for nelfinavir were 4.96 and 1.73 μM, and corresponding values for M8 were 1.96 and 0.55 μM. Equilibrium dialysis experiments demonstrate that nelfinavir is highly bound (98%) as is the M8 metabolite (97%), indicating similar antiviral activities for nelfinavir and its M8 metabolite. Although peak levels exceed the in vitro inhibitory concentration by more than 100-fold, because of the large degree of protein binding, the free drug concentration exceeds the inhibitory concentrations by only several-fold. The large volume of distribution (2–7 L/kg) of nelfinavir would suggest that nelfinavir penetrates most tissues. However, like most PIs, nelfinavir does not penetrate cerebrospinal fluid (CSF). CSF concentrations were not detectable in 25 samples from six patients despite appropriate plasma concentrations.13 Further, a study of 13 patients treated with nelfinavir-based combination therapy for at least 6 months showed decreased penetration into both genital tract (semen to plasma concentration ratio of 0.08) and lymphoid tissues (lymph node tissue to plasma concentration ratio of 0.58).14
The predominant metabolic pathways for nelfinavir are through the hepatic microsome P450 enzymes (CYP). Metabolism of nelfinavir by the CYP2C19 isoform leads to the formation of M8, the most common and active metabolite.12 Subsequently, nelfinavir and M8 are both eliminated via the CYP3A4 pathway. Because CYP enzymes, in particularCYP3A4, metabolize many other drugs, inhibition of these enzymes by PIs can alter the pharmacologic activity of concomitant medications (see section on Drug Interactions). Nelfinavir is an inhibitor of CYP3A4, similar to saquinavir, but is a less potent inhibitor than either indinavir or ritonavir. In vitro assays for inhibition of other P450 isoforms by nelfinavir (CYP2C9, CYP2C8, CYP2E1, CYP2C19, CYP2D6, CYP1A2) suggests that in vivo effects are minimal.15 Co-administration of low-dose ritonavir to inhibit CYP3A4 pathways is increasingly used to enhance plasma concentrations of other PIs. In a study with healthy volunteers, nelfinavir 1250 mg twice daily was given with either 100 or 200 mg ritonavir.16 Fourteen days of ritonavir combination therapy resulted in a minor increase of the AUC of nelfinavir by 20% and 39%, respectively.
The terminal half-life of nelfinavir in the plasma is3.5–5.0 h. Nelfinavir is excreted unchanged (22%) and as oxidative metabolites (65%) in the stool. Only 1–2% of nelfinavir is excreted in the urine. The pharmacokinetics of nelfinavir have not been studied in patients with altered renal function, but clearance of only a small fraction of the drug through the urinary system suggests that effects should be minimal. Further, no significant pharmacokinetic differences have been detected between men and women, or between African-American and Caucasian patients.9,17 However, hepatic insufficiency has been associated with reduced CYP drug elimination and increased PI plasma concentrations.18 Nelfinavir pharmacokinetics were studied in 119 HIV-infected individuals at steady state (74% were taking 1250 mg twice daily) of which 67 were without liver disease and hepatitis C infection (HCV), 32 were HIV-HCV co-infected without cirrhosis, and 20 were HIV-HCV co-infected with cirrhosis.19 HIV-HCV co-infected patients with and without cirrhosis had significantly lower nelfinavir clearance than purely HIV-infected patients (28% and 58% lower, respectively; P < 0.05). These differences in metabolism resulted in a 2.5- and 1.3-fold increase in plasma concentrations in HIV-HCV co-infected patients with and without cirrhosis compared with patients with purely HIV infection without liver disease. In contrast, M8 concentrations were reduced in cirrhotic individuals, suggesting that CYP2C19 impairment is particularly sensitive to liver disease.
The pharmacokinetics of nelfinavir differs greatly during pregnancy, in infancy and through childhood. Studies in children (ages 2–13) have demonstrated the clearance to be two to three times greater than adults. A dose of 20–30 mg kg−1 day−1 in three divided doses in children produces plasma levels similar to those present in adults receiving a 750 mg thrice-daily regimen (∼10 mg kg−1 day−1).20 Infants (less than 2 years) also demonstrate increased metabolism resulting in highly variable nelfinavir and M8 concentrations that are lower than what is observed in older children and adults.21,22 In addition, nelfinavir and M8 exposure is also reduced during pregnancy either from induction of CYP3A4, or inhibition of CYP2C19, or both.23
TOXICITY
The most common nelfinavir-associated adverse event described in clinical trials was diarrhea or loose stools. This toxicity rarely resulted in treatment discontinuation and often resolved with or without over-the-counter antimotility agents. Data from 583 patients in two randomized, phase 3 studies support the finding that diarrhea was the most significant toxicity associated with nelfinavir.24,25 In these studies, patients received nucleosides alone or in combination with 500 or 750 mg three times daily (Study 511) or 1250 mg twice daily of nelfinavir (Study 542). Twenty percent of patients treated with 750 mg thrice daily of nelfinavir had moderateto severe diarrhea in Study 511, compared to 3% of zidovudine (ZDV)/lamivudine (3TC)-treated patients. The two nelfinavir doses did not differ in terms of the rate of diarrhea (14% vs 20%; P = 0.2) and only two patients discontinued study medication while receiving the higher dosing regimen (Table 18-1). Similarly, a dose increase to 1250 mg twice a day in Study 542 also did not result in higher rates of diarrhea than with 750 mg three times daily (12% and 11%, respectively).
Table 18-1 Patients with Adverse Events of Moderate or Severe Intensitya or Severe Laboratory Toxicity Reported in ≥2% of Patients
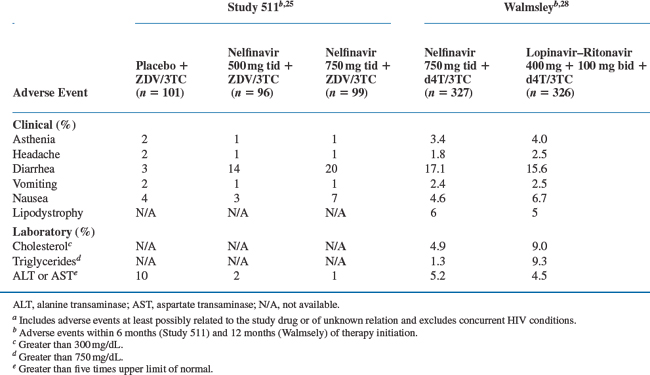
The overall rate of toxicity with nelfinavir compared favorably to that seen with other PI regimens (see section on Efficacy Trials). Although diarrhea was more common with nelfinavir use than fosamprenavir–ritonavir (16% vs 9%; P = 0.008)26 or atazanavir (56% vs 15–20%; P < 0.01),27 the rates of treatment discontinuation were not different. In a randomized, placebo-controlled trial comparing nelfinavir (750 mg thrice daily) with lopinavir–ritonavir (400 + 100 mg twice daily) diarrhea was the most common adverse event in both groups occurring in ∼16% of patients (Table 18-1).28
Dyslipidemia and lipodystrophy have been associated with PI use,29 though the clinical significance of these lipid changes remains unclear.30 After 48 weeks of therapy, median changes in total cholesterol, low-density lipoprotein (LDL) cholesterol and triglycerides were similar between patients receiving nelfinavir and fosamprenavir31 or fosamprenavir–ritonavir.26 Treatment with lopinavir–ritonavir did result in greater increases in triglycerides (125 mg/dL vs 47 mg/dL; P < 0.01) and total cholesterol (53 mg/dL vs 48 mg/dL; P = 0.17) than those receiving nelfinavir, but no difference in the presence of lipodystrophy or lipoatrophy (6% vs 5%).28 By contrast, patients who received atazanavir (400 mg daily) had significantly lower increases in baseline total cholesterol (8.6 mg/dL vs 40.5 mg/dL; at 48 weeks), fasting LDL cholesterol (5.2 mg/dL vs 22.5 mg/dL; at 56 weeks), and fasting triglycerides (9.2 mg/dL vs 53.4 mg/dL; at 48 weeks) than treatment with nelfinavir.27
EFFICACY TRIALS
Monotherapy Studies
Two small open-label studies of escalating doses of nelfinavir monotherapy were the first to demonstrate the antiviral activity of the drug. At low doses (900 and 1200 mg/day) used in study 504,32 five of 20 therapy-naive patients had a reduction in HIV RNA levels of 1 log10 copies/mL that persisted past 28 days. In Study 503, 30 patients with CD4+ T-lymphocyte counts of more than 200 cells/mm3 received higher nelfinavir doses (1500, 2250, and 3000 total mg/day in divided thrice-daily doses).33 These patients had median HIV RNA log10 decreases of 1.4, 1.0, and 1.7 copies/mL, respectively, after 28 days at the three increasing dose levels. Follow-up of 15 patients for 4 months showed the greatest HIV RNA reduction (1.5 log10 copies/mL) in the highest dose group.
Study 505 randomized patients to placebo or nelfinavir (500 mg vs 750 mg three times daily). Placebo patients crossed over to one of the two doses of nelfinavir after 4 weeks.34 The 91 patients had a mean HIV RNA level of 4.9 log10 copies/mL and a mean CD4+ lymphocyte count of 275 cells/mm3 at baseline. At 4 weeks the mean viral load was reduced by 0.1, 0.9, and 1.3 log10 copies/mm, and the CD4+ lymphocytes increased 10, 84, and 100 cells/mm3 in the placebo, low-dose nelfinavir, and high-dose nelfinavir groups, respectively (placebo versus nelfinavir; P < 0.01). After 16 weeks the mean log10 reduction in HIV RNA was 0.6 copies/mL for the 750 mg dose group, which was significantly greater than the reduction for the 500 mg group.
Treatment-Naive Studies
Triple-therapy combinations with nelfinavir and dual nucleoside reverse transcriptase inhibitors (NRTIs) has been studied in antiretroviral naive patients and compared with regimens containing a NNRTIs, other PIs, and PIs boosted with low-dose ritonavir. The trials selected for review were well designed and most were powered to demonstrate noninferiority with nelfinavir. Although cross study comparisons are not ideal, the efficacy of nelfinavir (proportion of patients with HIV RNA < 500 copies/mL at 48 weeks) ranged from 51% to 68% of participants (Table 18-2).
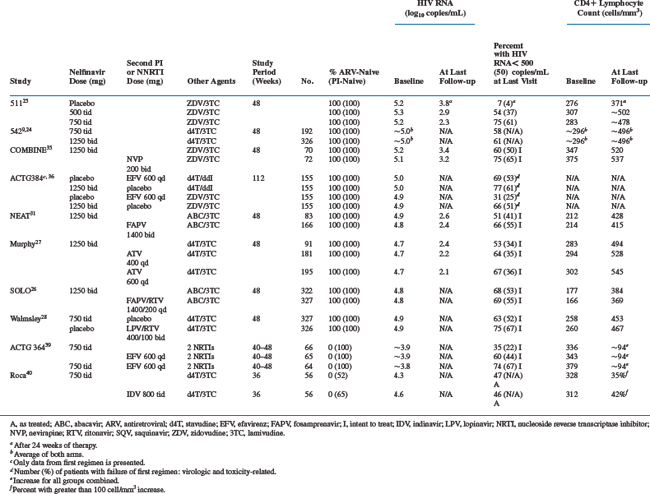
Two randomized studies clarified the optimal dosing regimen for nelfinavir in combination with nucleoside analogs. In Study 511 a series of 297 therapy-naive patients with a mean baseline HIV RNA level of 5.2–5.3 log10 copies/mL and CD4+ lymphocyte count of 276 to 307 cells/mm3 were randomized to nelfinavir (500 or 750 mg thrice daily)/ZDV/3TC versus ZDV/3TC alone.25 Baseline characteristics were balanced across treatment arms. The proportions of patients at 24 weeks with HIV RNA of less than 400 copies/mL were 77% and 50% for the high-dose and low-dose nelfinavir groups, compared to 7% in the ZDV/3TC group (P < 0.001). Follow-up for an additional 6 months confirmed that the proportion of patients in whom HIV RNA remained undetectable at 48 weeks was significantly higher in the 750 mg group (75%) than in the 500 mg group (54%). Study 542 was a phase 3 study powered to determine equivalency between the twice-daily dosing (1250 mg twice daily) of nelfinavir to three times daily (750 mg three times daily) dosing.9,24 A total of 323 patients received the 1250 mg twice-daily dosing and 192 patients the 750 mg thrice-daily dosing of nelfinavir in combination with stavudine (d4T) and 3TC. Mean baseline CD4+ lymphocyte count was 296 cells/mm3 with an HIV RNA level of 5.0 log10 copies/mL. At 48 weeks, 61% in the 1250 mg group and 58% in the 750 mg group had achieved plasma HIV RNA levels of less than 400 copies/mL, confirming similar efficacy between dosing regimens.
Nelfinavir and the NNRTIs have been studied in two recent clinical trials. In the COMBINE study,35 a total of 142 patients were randomized to receive either nevirapine 200 mg twice daily (n = 72) or nelfinavir 1250 mg twice daily (n = 70) plus ZDV/3TC. At 12 months, 75% of patients in the nevirapine group and 60% in the nelfinavir group had plasma HIV RNA below 200 copies/mL (P = 0.06). Notably, both drugs had a high incidence of study drug discontinuation due to adverse effects. Nelfinavir was discontinued in 20%, primarily due to diarrhea, and 17% discontinued nevirapine with rash and liver enzyme elevations.
ACTG 384 used a four arm factorial design to compare pairs of sequential triple therapy combinations with either nelfinavir or efavirenz combined with d4T/didanosine (ddI) or ZDV/3TC.36 A total of 620 patients were enrolled (155 subjects each arm) of which 243 had treatment failure of their first regimen (190 were viral failures and 53 were toxicity related). For the secondary endpoint analysis, failure of the first regimen, there was a significant interaction between the treatment factors, i.e., between the selection of nucleoside backbone and the initial use of efavirenz versus nelfinavir (P = 0.002). Subjects who received the nucleoside combination of ZDV/3TC had a lower risk of treatment failure when combined with efavirenz versus nelfinavir (hazard ratio for failure of the first regimen, 0.39; 95% confidence interval (CI), 0.24 to 0.64). However, no significant difference in failure rates were observed when d4T/ddI was the nucleoside combination used (hazard ratio for failure of the first regimen, 0.88; 95% CI, 0.61–1.29). Although interpretation of this data is complicated by an interaction from the factorial study design, in post hoc analysis after adjustment for all six possible pair wise comparisons, the combination of efavirenz and ZDV/3TC was superior to all other triple-therapy combinations used in this study.
The NEAT study was a noninferiority study that compared 166 patients on fosamprenavir 1400 mg twice-daily with 83 on nelfinavir 1250 mg twice-daily dosed with a background combination of abacavir (ABC) and 3TC for 48 weeks.31 The study population was generally well-balanced between arms, but patients had advanced HIV disease with 48% having a baseline CD4+ cell count less than 200 cells/mL. In intention-to-treat (ITT) analysis (missing = failure), the proportion of patients achieving a plasma HIV RNA less than 400 copies/mL was greater in the fosamprenavir group (66%) than the neflinavir group (48%) after 48 weeks of treatment. Further, over twice the numbers of patients in the nelfinavir arm were prematurely discontinued from their randomized study drug than the fosamprenavir group due to insufficient viral load response (19% vs 7%, respectively). While the study lacked sufficient power to assess superiority of fosamprenavir, the 95% CI of 2–28% suggests a true difference between treatment groups.
In contrast, nelfinavir demonstrated equivalent efficacy with atazanavir at the currently recommended dose of 400 mg once daily.27 A total of 467 patients were randomized in a phase 2 dose-ranging study of atazanavir (400 or 600 mg once daily) compared to nelfinavir (1250 mg twice daily), each given with d4T and 3TC. In ITT analysis (noncompletion = failure), a comparable proportion of patients on atazanavir 400 mg daily (116/156; 64%) and nelfinavir (48/80; 60%) achieved a plasma HIV RNA less than 400 copies/mL after 48 weeks of therapy. Although patients receiving 600 mg daily of atazanavir did achieve higher rates of viral control, the increased incidence of jaundice with the higher dose resulted in the decision to favor the 400 mg dose for clinical use.
Unlike the NEAT study,31 the viral response of nelfinavir (1250 mg twice daily) in the SOLO trial26 was similar to boosted fosamprenavir–ritonavir (1400 + 200 mg ritonavir once daily). This was a larger trial that randomized 322 patients to fosamprenavir–ritonavir and 327 to nelfinavir and again included participants largely with advanced HIV disease, having a median CD4+ T-cell count below 200 cells/mm3. At week 48, 69% of the patients in the fosamprenavir–ritonavir group and 68% in the nelfinavir group achieved a plasma HIV RNA less than 400 copies/mL (95% CI: −6 to 8%). This equivalence was observed despite a higher adherence rate in the fosamprenavir–ritonavir once-daily group compared with the nelfinavir twice-daily group (78% vs 67%, respectively). However, in subgroup analysis of patients with pretherapy viral load above 500 000 copies/mL, more patients in the fosamprenavir–ritonavir group (73%) achieved viral control than the nelfinavir group (53%).
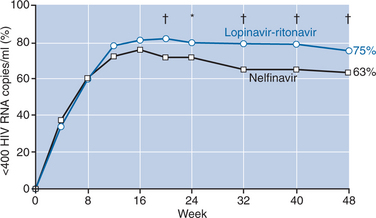
A large double-blind, placebo-controlled study of lopinavir–ritonavir (400 mg lopinavir + 100 mg ritonavir twice daily) compared with nelfinavir (750 mg three times daily) demonstrated superior antiviral activity of this boosted-PI combination over nelfinavir.28 A total of 326 patients received lopinavir–ritonavir and 327 patients received nelfinavir plus d4T and 3TC for 48 weeks. Tolerability of the regimens compared favorably, except for lipid abnormalities, which were more common with lopinavir–ritonavir. In the primary analysis, patients treated with lopinavir–ritonavir had higher proportions of undetectable viral loads (less than 400 copies/mL) at week 24 than those treated with nelfinavir (79% vs 71%, respectively; P < 0.05). Additional follow-up showed an increasing difference in response rates with 75% of patients on lopinavir–ritonavir achieving viral suppression compared with 63% of nelfinavir-treated patients (P < 0.001) (Fig. 18-1). Although CD4+ T-cell increases were comparable at 48 weeks, the time to loss of viral response was greater for patients on lopinavir–ritonavir with 84% maintaining viral control compared with 66% of those taking nelfinavir, yielding a hazard ratio of 2.0 (95% CI: 1.5–2.7).

Stay updated, free articles. Join our Telegram channel

Full access? Get Clinical Tree


