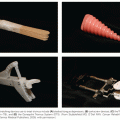
A 500 cell count differential is recommended, with exclusion of lymphocytes and plasma cells. Cytologic dysplasia must exceed 10% of cells in any lineage and the percentage of myeloblasts calculated. If the absolute percentage of erythroid precursors is 50% or greater, the percentage of myeloblasts is estimated among nonerythroid precursors. Iron stains are essential to address the percentage of ring sideroblasts. The bone marrow core biopsy could complement the bone marrow aspirate in several aspects,30 namely, cellularity, dysmegakaryopoiesis, and identifying clusters of abnormal localization of immature precursors (ALIP), which are immature cells/myeloblasts or promyelocytes that are displaced from the paratrabecular area to the intertrabecular areas often corresponding to the vascular niche. In addition, the reticulin stain provides information regarding medullary fibrosis, which can add prognostic information.33,34
The French-British-American Classification
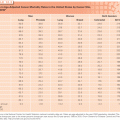
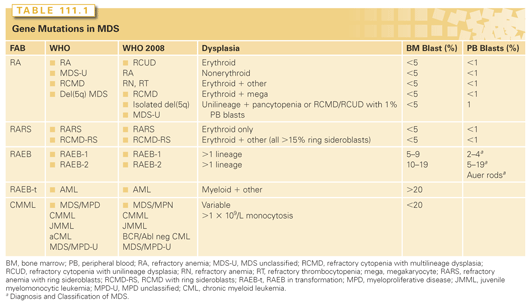
The original FAB classification (Table 111.1) included only two of the subtypes.5 In 1982, a revision to the FAB classification expanded that to five subgroups: refractory anemia (RA), refractory anemia with ring sideroblasts (RARS), RAEB, RAEB in transformation (RAEB-t), and CMML.6
The World Health Organization Classification
The WHO classification was proposed to address some of the FAB shortcomings.35,36 WHO distinguishes between single lineage and multilineage dysplasia: Categories of refractory cytopenia with multilineage dysplasia (RCMD) and RCMD with ring sideroblasts (RCMD-RS) were added, capturing those cases with dysplastic changes in either myeloid or megakaryocytic lineages in addition to erythroid dysplasia. The 5q- syndrome was recognized as a distinct subset, with an isolated cytogenetic abnormality involving del(5q) and less than 5% myeloblasts. RAEB was divided into RAEB I with 5% to 9% blasts and RAEB II with 10% to 19% blasts.35,37 RAEB-t was omitted and the blast threshold for AML diagnosis lowered to 20% rather than 30%.35,37,38 Finally, WHO recognizes MDS/myeloproliferative neoplasms (MPN). This includes diseases such as CMML, juvenile myelomonocytic leukemia (JMML), and atypical chronic myeloid leukemia (aCML).35,37,38 CMML is further classified based on the percentage of bone marrow blasts, where CMML type 1 includes 0% to 4% blasts and/or promonocytes on peripheral blood or <10% in the bone marrow, and type 2 includes 5% to 19% blasts and promonocytes in the peripheral blood or <20% in the bone marrow.8
The WHO classification was revised in 2008,39,40 adding the category of refractory cytopenia with unilineage dysplasia (RCUD) that include RA, refractory neutropenia (RN) and refractory thrombocytopenia (RT). The patients may have a corresponding cytopenia but not pancytopenia. Patients with pancytopenia and unilineage dysplasia, patients with no overt dysplasia but cytogenetic evidence of MDS, and cases of RCUD or RCMD with peripheral blood (PB) blasts of 1% are categorized as MDS unclassified (MDS-U). RAEB-1 includes 2% to 4 % peripheral blood blasts and RAEB-II includes 5% to 19% peripheral blood blasts. The presence of Auer rods regardless of blast percentage qualifies as RAEB-II or CMML-2.41 A provisional entity of refractory anemia with ring sideroblasts and thrombocytosis (RARS-T) was proposed in which there is a sustained thrombocytosis of 450,000/mm3 or greater.42 Up to 50% of RARS-T patients harbor a gain-of-function mutation involving the Janus kinase 2 (JAK2) gene. A subset of patients with CMML and eosinophilia with accompanying genetic abnormalities involving the platelet-derived growth factor receptor alpha (PDGFRα) or PDGFRβ were reclassified as myeloid neoplasms with eosinophilia.43
Hypocellular MDS (or hypoplastic MDS) is not recognized as a distinct entity with the WHO classification. It accounts for 10% to 20% of MDS cases. The challenge on diagnosis is to distinguish those cases from aplastic anemia.44 Although not part of the WHO classification, the term idiopathic cytopenia of unknown significance (ICUS) was proposed for those cases with persistent cytopenia(s) unrelated to nutritional deficiency that have dysplasia in less than 10% of cells in any lineage and that lack cytogenetic abnormalities. Many of those patients may develop MDS over time. Whether the latter cases can be distinguished a priori by the presence of gene mutations is under investigation. Some cases may also demonstrate dysplasia below the 10% WHO cutoff with no cytopenia, referred to as idiopathic dysplasia of unknown significance (IDUS).45
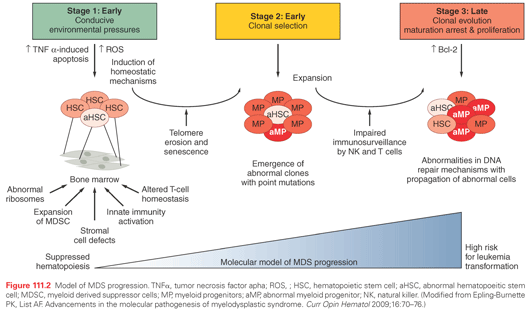
MDS is a clonal disease driven by acquisition and expansion of genetic alterations (Fig. 111.2). The clonal nature of many MDS cases was first apparent by the conventional metaphase karyotype analysis. Studies leveraging restriction fragment length polymorphisms (RFLP) of X-chromosome genes in females, single nucleotide polymorphism (SNP) arrays, and glucose-6-phosphate dehydrogenase (G6PD) analyses confirmed that hematopoiesis is clonal across all subtypes of MDS.46–49 The two most comprehensive studies demonstrating the frequency and nature of chromosome abnormalities in MDS confirmed that approximately 50% of patients with MDS harbor a chromosome abnormality.50,51 The most common recurrent abnormalities were del(5q) (30%), −7 or 7q− (21%), and +8 (16%). Deletion of genes encoded within the commonly deleted region (CDR) of human del(5q) MDS is sufficient to induce an MDS phenotype, indicating that these recurrent genetic lesions are critical to the development of the disease.52
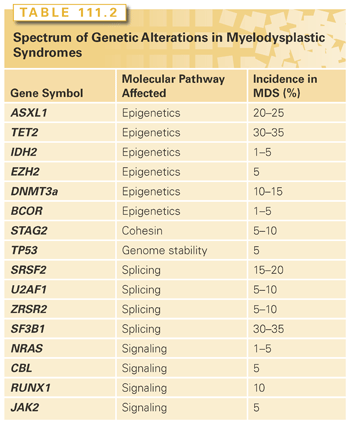
In addition to large chromosomal deletions or duplications, DNA sequencing technology has uncovered gene mutations that aggregate within pathways previously unrecognized to be important in MDS pathogenesis. These include mutations predicted to result in deregulation of genes involved in signaling pathways and epigenetic control, RNA splicing, and transcription factors.53 Mutations are common in MDS, because targeted sequencing of select genes can identify at least one event (average: three events per sample) in approximately 80% of cases.54 Although there are no MDS-defining mutations, a genomic fingerprint, which is characteristic of MDS is materializing as a result of several large-scale gene sequencing efforts. Among the most common gene mutations in MDS is that involving the gene, ten-eleven-translocation-2 (TET2).55 Inactivating TET2 mutations, which disrupt TET2 enzymatic activity, are frequently observed in MDS. TET2 catalyzes the conversion of methyl cytosine to hydroxymethylcytosine (5-hmC), thereby inducing subsequent DNA demethylation and the release of epigenetic repression.56 Patients with TET2 gene mutations have lower DNA levels of 5-hmC with consequent increased genomic methylation. Other commonly mutated epigenetic modifiers include the associated sex-linked combs like 1 (ASLX1) gene.57–60 ASXL1 belongs to the polycomb gene family and is an essential component of chromatin remodeling through its interaction with the polycomb repressive complex 2 (PRC2).61,62 Deletion and conditional knock-in murine models for both TET2 and ASXL1 demonstrate that these lesions are sufficient to induce a myeloid neoplasm akin to MDS.61,63,64
Next-generation sequencing of MDS genomes recently identified genes involved in the regulation of alternative gene splicing.65 Subsequent studies have shown that they are among the most common gene mutations in MDS.53,54 They appear to occur early in disease pathogenesis, alter RNA splicing, and are prognostically relevant.66–68 Interestingly, the two most common mutations involving the splicing factor 3b subunit 1 (SF3B1) and serine/arginine-rich splicing factor 2 (SRSF2) genes have strong phenotypic linkage with ringed sideroblasts and monocyte expansion (CMML), respectively.67,69
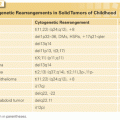
Lastly, the specific type and number of gene mutations directly impacts clinical behavior and risk of progression to AML. Elegant work using whole-genome sequencing to reconstruct the clonal architecture of MDS cases that transform to AML at sequential time points demonstrates that this transformation is associated with the acquisition and expansion of distinct genetic events.70 Emerging data, however, suggest that these events do not display complete fidelity. That is, the same genetic events can be responsible for disease initiation, and therefore, disease founding in one case while representing a secondary event in another case with the same diagnosis. Collectively, these and other gene mutations described in Table 111.2 demonstrate that distinct genetic events can result in MDS and are likely the major drivers of the disease and its behavior.
Dysregulation of Immunity as a Driver in MDS
The environmental cues that are conducive to emergence of the genetic events that lead to MDS are unknown. Bone marrow stromal alterations have been implicated, but an intriguing emerging hypothesis that immune dysregulation and associated chronic inflammatory changes may be a critical environmental pressure in MDS pathogenesis. Clinical and laboratory evidence suggests that both adaptive and innate immunity is altered and potentially contributory to MDS pathogenesis. It is this inflammation that could represent the nidus for mutational acquisition in some patients, or these inflammatory changes are induced by an expanded clone. A recent population-based study demonstrated a strong linkage between chronic immune stimulation and autoimmune disorders with MDS predisposition.26 Several studies confirmed the higher than expected association between MDS and autoimmune disease.26,71–73
Impaired T-cell homeostasis and early senescence is a feature of patients with MDS.74 Indeed, up to 50% of T cells are clonal and even more appear to have intrinsic defects in telomerase function, perhaps accounting for their premature senescence.75,76 In addition to expansion and senescence, the T-cell receptor (TCR) repertoire appears to be augmented and hematopoietic inhibitory capacity appears to be increased.77 Lastly, T-cell characteristics can mark clinical parameters in MDS. For instance, the expansion of effector memory T-regulator cells (Tregs) is associated anemia and increased blast percentage, and represents an unfavorable prognostic biomarker.78
Activation of innate immunity with consequent nuclear factor kappa B (NF-κB) induction contributes to the inflammatory microenvironment in MDS.79,80 Haplodeficiency of two micro-RNA genes, miR-145 and miR-146a, located within the distal commonly deleted region of chromosome 5q at 5q32, results in constitutive activation of Toll-like receptor (TLR) signaling in del(5q) MDS. Toll-interleukin 1 receptor domain–containing adapter protein (TIRAP) and tumor necrosis factor receptor–associated factor-6 (TRAF6), which encode key intermediates involved in the MyD88-dependent TLR-signaling pathway, are targets of miR-145 and miR-146a, thereby upregulating their expression with allelic insufficiency. Myeloid-derived suppressor cells (MDSC), potent effectors of innate immunity, are recently recognized as critical cellular effectors involved in the pathogenesis of MDS. MDSCs are markedly expanded in the bone marrow of MDS patients and promote ineffective hematopoiesis. These MDSCs are genetically distinct from the MDS clone, overproduce hematopoietic suppressive cytokines, and also act as potent effectors of apoptosis that target autologous hematopoietic progenitors. MDSC expansion is driven by excess generation of the proinflammatory molecule S100A9, which is a ligand for TLR4. Moreover, a transgenic S100A9 mouse model phenocopies human MDS, displaying bone marrow accumulation of MDSC accompanied by progressive age-dependent multilineage cytopenias and cytologic dysplasia.81
The 5q Minus Syndrome
The hematologic and pathologic phenotype of the 5q- syndrome is now recognized to be a product of haploinsufficiency of several genes located within the CDR at 5q32.82 Among 40 genes residing in the CDR, only inactivation of RPS14 impaired erythroblast proliferation and viability, whereas corresponding overexpression of RPS14 was sufficient to rescue erythropoiesis in primary del(5q) MDS specimens.83 Haploinsufficiency for RPS14 disrupts ribosome assembly, leading to nucleolar stress and sequestration of the human homolog of the mouse double minute 2 protein (MDM2) by free ribosomal proteins, thereby triggering its degradation and p53 stabilization.84 A murine model of the human 5q− syndrome generated by allelic deletion of the genes in the human CDR showed that p53 inactivation rescues the hematologic features.52 Gene dosage of two dual specificity phosphatases encoded within or adjacent to the proximal CDR at 5q31 (i.e., cell division cycle 25C [Cdc25C] and protein phosphatases 2A catalytic domain alpha [PP2Aca]), underlies the selective suppression of del(5q) clones.85
The most common clinical presentation of MDS is sustained and progressive cytopenia with corresponding symptoms and complications. Macrocytic anemia is the most common hematologic feature, mandating the exclusion of common causes of anemia and nutritional deficiencies. In one analysis, MDS was the fifth most common cause of anemia in elderly patients after iron deficiency, bleeding, renal insufficiency, and anemia of chronic disease.30,86 Thrombocytopenia and/or platelet dysfunction are common in MDS patients, with an overall prevalence ranging from 40% to 65%. Thrombocytopenia is more common in higher risk diseases, but occurs in lower risk patients and can be exacerbated by therapy. The frequency of hemorrhagic death ranges from 14% to 24%.87 Bleeding can occur even in the absence of thrombocytopenia attributable to platelet dysfunction as evidenced by a prolonged bleeding time corresponding to an increase in atypical megakaryocytes.88
Among all patients with MDS, over one-third will undergo transformation into AML. In the remaining patients, the majority will succumb to infection, in part from neutropenia, iron overload, and granulocyte dysfunction illustrated by impaired phagocytic adhesion, chemotaxis, and microcidal killing.89 Bacterial pneumonias and skin abscesses are most common, but unusual/opportunistic infections such as disseminated Mycobacterium avium–intracellulare,90 Aeromonas hydrophila endocarditis,91 bacterial thyroiditis,92 and Epstein-Barr virus hepatitis may arise.92
MDS patients can also manifest a wide range of autoimmune phenomena such as cutaneous vasculitis, polymyalgia rheumatica, necrotizing panniculitis, Coombs-positive autoimmune hemolytic anemia, sweet syndrome, and an seronegative arthritis.93–96
In patients with MDS/MPN such as CMML, hepatosplenomegaly, lymphadenopathy, and pleural effusion are manifestations attributed to the proliferative nature of this group.97 In patients with RARS-T, the risk of thrombotic events is similar to essential thrombocytosis.98
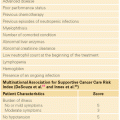
Risk stratification and prognostic assessment represent a critical first step in the management of MDS (Table 111.3). It provides useful information for the patients as to “the disease forecast” and, more importantly, allows physicians to tailor therapy accordingly. For patients with a higher risk, the goal of therapy is to alter the natural history of the disease and to extend survival. The goal of therapy in lower risk MDS is to alleviate symptomatic cytopenias using treatments that may restore effective hematopoiesis and lessen associated complications. The prognosis will depend on the inherent disease’s specific features and host-related features. Risk models in MDS are constructed by incorporating several validated prognostic variables in a weighted scoring system, permitting patients to be divided into defined risk groups.
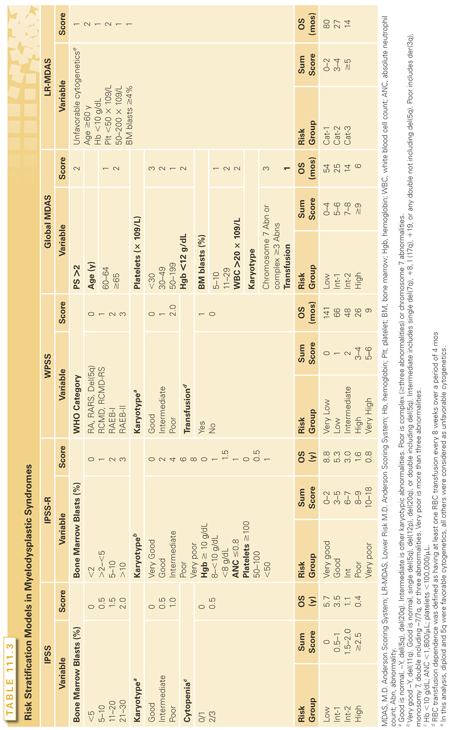
The International Prognostic Scoring System
The IPSS remains the most widely used staging system in MDS.7 It has been embraced by community oncologists, adopted in clinical trials, and forms the basis of determining the time table for allogeneic hematopoietic cell transplantation in decision models. However, IPSS has several shortcomings. It was not developed as a dynamic system. It does not account for severity of cytopenias, and it overlooks two-thirds of the cytogenetic abnormalities encountered. Moreover, the IPSS is not applicable to patients with MDS/MPN or t-MDS.
The Revised IPSS
The IPSS-R was proposed as a refinement to adjust for those deficiencies of the original IPSS.13 The major changes include the incorporation of less common karyotype abnormalities, the prognostic relevance of which was discerned from the larger patient cohort, and the weighing of the severity of each lineage of cytopenia. Several groups have validated the new prognostic system.99,100
The Global M.D. Anderson Scoring System
The Global M.D. Anderson Scoring System (MDAS) incorporates host factors such as age and performance status,11 as well as anemia, transfusion burden, karyotype, and most importantly, the severity of thrombocytopenia. It captures the prognostic impact of leukocytosis for MDS/MPN. This model further refines IPSS. The MDAS upstaged 25% of patients to a higher risk category.101 It can be applied for MDS/MPN cases, as well as t-MDS.
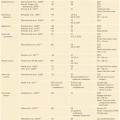
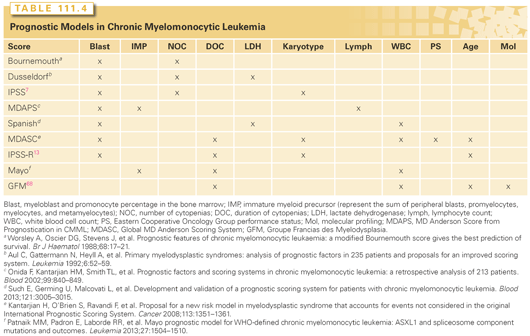
Other risk models that had been utilized and validated include the Lower Risk M.D. Anderson Scoring System (LR-MDAS),102 and the WPSS, which is more widely used in Europe.10 For MDS/MPN subtypes, only the MDAS, discussed previously, can be applied. Several other models have been developed specifically for CMML (Table 111.4).
Five gene mutations independently predicted overall survival in a large cohort of MDS patients after adjusting for age and IPSS score.103 These five genes include mutations involving TP53 (hazard ratio [HR], 2.48), EZH2 (HR, 2.13), ETV6 (HR, 2.04), RUNX1 (HR, 1.47), and ASXL1 (HR, 1.38). In lower risk MDS, EZH2, NRAS, and ASXL1 gene mutations upstaged 21% of low/intermediate 1 (int-1) IPSS risk MDS patients.104 Only the EZH2 mutation provided additional risk discrimination to upstage 8% of the patients classified by LR-MDAS.104
The causes of death in MDS include AML transformation in 30% to 40% of all patients (10% to 20% of lower risk MDS patients), whereas the vast majority, unfortunately, succumb due to complications secondary to the disease, namely infection and bleeding.105 Other important prognostic factors in MDS include red blood cell (RBC) transfusion dependence106 and elevated serum ferritin >1,000 ng/mL, which is associated with both inferior overall survival and time to AML transformation.107 Bone marrow fibrosis in MDS is typically associated with a higher risk disease, increased myeloblasts, or complex cytogenetics, and worse outcome. Patients with bone marrow fibrosis are often categorized morphologically as MDS-U or MDS with fibrosis (MDS-F).34
Patients with MDS often suffer from other medical comorbidities that may impact survival, affect performance status, and limit therapeutic options. Using the ACE-27 comorbidity index, the median survival was 31.8, 16.8, 15.2, and 9.7 months for those with none, mild, moderate, and severe comorbidities, respectively (p <0.001). A prognostic model including age, IPSS, and comorbidity score predicted median survival.108 The Italian group added further refinement by developing an MDS-specific comorbidity index (MDS-CI). Cardiac disease, moderate to severe liver disease, severe pulmonary disease, renal disease, and history of solid tumors were found to independently affect the risk of nonleukemic death, whereas diabetes and cerebrovascular disease did not.109
MANAGEMENT OF MYELODYSPLASTIC SYNDROMES
Erythropoiesis-Stimulating Agents
More than 90% of MDS patients have anemia, and 30% to 50% are transfusion dependent.110 Erythropoiesis-stimulating agents (ESA) are the most widely used treatment for anemia in lower risk MDS; more than 50% of newly diagnosed and established patients in the United States receive ESA. Response rates range from 15% to 20% in unselected patients receiving doses equivalent to 40,000 to 60,000 U of epoetin alpha weekly.111 Treatment lasting 8 to 12 weeks provides an adequate trial to assess ESA responsiveness, with median duration of responses ranging from 12 to 24 months.112 Case-matching studies suggest a survival advantage among erythroid responders.112 Darbepoetin is at least as effective as epoetin alfa.113 Patient selection improves response probability to ESAs and conserves resources. Using a simple model based on pretreatment endogenous serum erythropoietin (EPO) concentration (<100, 100 to 500, or >500 U per liter) and RBC transfusion burden (< or ≥2 U per month one would distinguish three response categories: high probability of erythroid response (74%), intermediate (23%), and low (7%).114
Lenalidomide
Lenalidomide is approved by the U.S. Food and Drug Administration (FDA) for the treatment of transfusion-dependent anemia in lower risk MDS patients with a chromosome 5q deletion (del[5q]) with or without additional cytogenetic abnormalities. In the lenalidomide registration (MDS-003) phase II clinical trial, the overall transfusion response rate was 76%, with 67% achieving transfusion independence.115 The median time to response was 4.6 weeks, accompanied by a median rise in hemoglobin (Hgb) of 5.4 g/dL. Median duration of response exceeded 2 years and is longer in patients with isolate del(5q). Lenalidomide was administered at a dose of 10 mg daily either continuously or for 21 days every 4 weeks. Cytogenetic response and hematologic improvement were the strongest independent covariates for overall survival (OS) (HR, 5.295; p <0.001).116,117 Recent studies indicate that TP53 gene mutations are demonstrable in approximately 20% of del(5q) MDS patients, expand over time, and are associated with a higher risk of disease progression and a lower frequency of cytogenetic response to lenalidomide.118–120
The most commonly observed adverse event was early myelosuppression, generally occurring in the first 8 weeks of treatment (62%). More than half of the patients (55%) experienced neutropenia, and 44% had thrombocytopenia. Dose reduction or treatment interruption for hematologic adverse events was necessary in the majority (84%) of patients. The median time to first dose reduction was 22 days. At week 24, only 32% of patients were receiving a 10-mg dose. Early cytopenias with lenalidomide treatment correlated with the probability of achieving RBC transfusion independence.121 Non–hematologic-adverse events include dry skin, rash and pruritus, itching of the scalp, and diarrhea. Hypothyroidism has been reported in approximately 7% of patients.122,123 Patients with renal insufficiency were excluded. In such patients, it is prudent to adjust the dosage based on creatinine clearance given the renal excretion of lenalidomide.124 The incidence of venous thromboembolic events (VTE) in MDS patients treated with lenalidomide monotherapy was low, with VTE reported in 3% of the del(5q) patients.
A subsequent phase III, placebo-controlled study (MDS-004) compared two different doses and schedules of lenalidomide in the same del(5q) MDS population.125 Two hundred and five patients were randomized to receive treatment with either lenalidomide 10 mg daily for 21 days every 4 weeks, continuous treatment with lenalidomide 5 mg daily, or placebo. The rates of sustained transfusion independence (>24 weeks) were 53.6%, 33.3%, and 6%, respectively (p <0.001). Cytogenetic response rates were also highest in the 10-mg arm. The median rise in hemoglobin was highest in patients treated with the 10-mg lenalidomide dose. No difference was observed in the frequency or magnitude of myelosuppression between the two lenalidomide doses, nor was there a difference in the rate of AML transformation.
The use of lenalidomide in lower risk non-del(5q) MDS was explored in a phase II study (MDS-002), which enrolled 214 non-del(5q) patients.126 Based on the International Working Group 2000 (IWG 2000) response criteria, 26% patients achieved transfusion independence. Median rise in hemoglobin was 3.2 g/dL, and median duration of response was 41 weeks. Attempts to improve the activity of lenalidomide in non-del(5q) patients include biomarker-guided patient selection and combination strategies with an ESA.127,128 Preliminary results of a randomized phase II clinical trial comparing lenalidomide to a lenalidomide/ESA combination yielded higher erythroid response rates with the combination treatment: 23% versus 40%, respectively (p = 0.043).
Lenalidomide’s mechanism of action in MDS is karyotype specific. In del(5q) MDS, lenalidomide relieves p53 arrest by stabilizing MDM2 to permit cell cycle reentry by inhibiting the haplodeficient PP2A. The resulting hyperphosphorylation of inhibitory serine/threonine residues on MDM2 suppresses its autologous ubiquitination, thereby stabilizing the protein and, in turn, promoting the proteasomal degradation of p53.84 In non-del(5q) MDS, lenalidomide enhances erythroid receptor signaling. The inhibition of PP2A promotes coalescence of lipid rafts with attendant incorporation of the erythropoietin receptor along with its signaling intermediates to yield a more efficient receptor signaling platform.129
The use of lenalidomide in higher risk MDS patients remains investigational. Several studies reported modest response rates and rates of transfusion independence.130–132 A high rate of complete response have been reported when combining azacitidine and lenalidomide in higher risk MDS in a phase I/II trial, which is the subject of an ongoing intergroup randomized phase II clinical study.133 Use of lenalidomide in the treatment of MDS/MPN subtypes is often extrapolated from its use in MDS. Nonproliferative lower risk CMML patients were included in the studies summarized previously. Anecdotal case reports suggest lenalidomide activity in patient with the RARS-T subtype.134
Azanucleosides
Stay updated, free articles. Join our Telegram channel

Full access? Get Clinical Tree


