Anticoagulant
Mode of action
Plasma half-life
Monitoring test(s)
Therapeutic range
Reversal
Notes
Warfarin (vitamin K antagonists)
Interference with post-translational γ-carboxylation of vitamin K-dependent clotting factors
20–60 h
INR
2.0–3.0, moderate intensity
Vitamin K, prothrombin complex concentrates (PCC), fresh frozen plasma, recombinant factor VIIa
2.5–3.5, high intensity
Heparin, unfractionated, standard-dose IV or high-dose SC
Potentiation of AT inactivation of factors IIa and Xa
0.5–2.5 h
PTT
Method-specific
Protamine sulfate
The PTT therapeutic range endpoints are the PTT responses corresponding to the anti-Xa heparin therapeutic range
Anti-Xa heparin assay
0.3–0.7 IU/mL
Heparin, unfractionated, low-dose SC
Potentiation of AT inactivation of factors IIa and Xa
None
N/A
None
Heparin, unfractionated, high-dose IV
Potentiation of AT inactivation of factors IIa and Xa
0.5–2.5 h
ACT
Procedure-specific
Protamine sulfate
Target ACT is determined by the nature of the procedure, e.g., cardiac catheterization, cardiopulmonary bypass, ECMO, etc.
Heparin, LMW
Potentiation of AT inactivation of factors IIa and Xa
3–4 h
Anti-Xa LMW heparin assay
0.6–1.1 IU/mL, twice daily dosing
Partial reversal by protamine
Monitoring of LMW heparin concentration is not routinely required, but is indicated in renal impairment, morbid obesity or low body weight, prolonged therapy, or young age
1.0–2.0 IU/mL, once daily dosing (for enoxaparin)
Fondaparinux
Potentiation of AT inactivation of factor Xa
17–21 h
None routinely.
0.3–0.6 mg/L
None
Monitoring of fondaparinux concentration is not routinely required, but is indicated in renal impairment
Anti-Xa fondaparinux assay for renal impairment.
Argatroban
Inhibition of thrombin by reversibly binding to its active catalytic site
24 min
PTT
1.5–3.0 times baseline, not to exceed 100 s
None
Therapeutic targets may not be reliable for all PTT assays due to the highly variable dose-response
ACT (PCI and CPB procedures)
>300 s
Bivalirudin
Inhibition of thrombin by reversibly binding to its active catalytic site and substrate-binding site
25 min
None routinely
Procedure-specific
None
Dosage is weight-based. Monitoring is not routinely required, but patients with renal impairment should be monitored with the ACT with a therapeutic range determined by clinical protocol
ACT for renal impairment
Dabigatran
Inhibition of thrombin by reversibly binding to its active catalytic site
12–17 h
None
N/A
None
When laboratory assessment is needed, the ECT, ECA, or PDTT are preferred tests, but not generally available. A normal TT rules out the presence of dabigatran. A normal PTT essentially rules out therapeutic concentrations
Rivaroxaban
Competitive inhibition of active site of factor Xa
5–9 h
None
N/A
None
When laboratory assessment is needed, the anti-Xa assay calibrated with rivaroxaban calibrants is preferred, but not generally available. A normal PT essentially rules out therapeutic concentrations
Apixaban
Competitive inhibition of active site of factor Xa
~12 h
None
N/A
None
When laboratory assessment is needed, the anti-Xa assay calibrated with apixaban calibrants is preferred, but not generally available. A normal PT essentially rules out therapeutic concentrations
10.2 Warfarin
Warfarin is an oral anticoagulant medication, widely used for the prevention of thromboembolic events, including deep venous thrombosis (DVT), pulmonary embolism (PE), myocardial infarction, and stroke [1, 2].
10.2.1 Mechanism of Action
Warfarin is one of the coumarins or vitamin K antagonists. It does not have direct anticoagulant properties, but exerts its effect by inhibiting the vitamin K pathway. Clotting factors II, VII, IX, and X, and the antithrombotic proteins C and S are synthesized in the liver as inactive proteins. Vitamin K-H2, reduced vitamin K, is an essential cofactor in the post-translational γ-carboxylation of 10–12 glutamate residues on these proteins, creating calcium-binding sites required for activity. In this process, vitamin K-H2 is oxidized to vitamin K epoxide. In a two-step process catalyzed by the enzymes vitamin K epoxide reductase and vitamin K reductase, vitamin K-H2 is regenerated and becomes ready to participate in another γ-carboxylation. The vitamin K cycle and its inhibition by warfarin are illustrated in Fig. 10.1. Vitamin K reductase is less sensitive to warfarin than is vitamin K epoxide reductase, enabling dietary or parental vitamin K to be reduced and overcome the effects of warfarin [1].
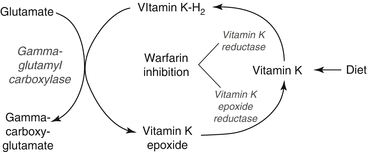

Fig. 10.1
Vitamin K cycle and warfarin inhibition of key enzymes
Warfarin decreases the availability of vitamin K-H2 and decreases the number of calcium-binding sites on newly synthesized clotting factors. Active clotting factors are not affected by warfarin, but as they are metabolized, hypofunctional proteins replace them. Thus the onset of warfarin’s effect is related to the half-life of the vitamin-K-dependent clotting factors, shown in Table 10.2. A partial effect is achieved quickly due to the short half-life of factor VII, but the full onset of anticoagulation takes several days because of factor II’s long half-life.
Table 10.2
Half-lives of vitamin-K-dependent proteins
Protein | Half-life, hours |
|---|---|
Factor II | 60 |
Factor VII | 4–6 |
Factor IX | 24 |
Factor X | 48–72 |
Protein C | 8 |
Protein S | 30 |
10.2.2 Rationale for Laboratory Monitoring
The therapeutic effectiveness of warfarin is well established, but therapeutic monitoring is required for several reasons [1]. First, warfarin has a relatively narrow therapeutic window. Under-anticoagulation greatly reduces warfarin’s therapeutic efficacy, while over-anticoagulation greatly increases the risk of bleeding. Severe bleeding episodes may be fatal or lead to severe morbidity. Second, the dose-response between individuals is highly variable and may be quite variable in the same individual over time. Third, warfarin’s effect may be either potentiated or inhibited by a large number of medications. For example, potentiators include acetaminophen, erythromycin, miconazole, propranolol, and cimetidine, and inhibitors include barbiturates, prednisone, carbamazepine, nafcillin, and cholestyramine, to name a few. Manufacturer’s information provides over 120 examples of agents that may interfere with or potential the effect of warfarin [2]. Fourth, warfarin’s effect is influenced by fluctuations in dietary vitamin K intake. Dietary vitamin K is obtained principally from green leafy vegetables, olive oil, soybean oil, cottonseed oil, and canola oil and, to a lesser extent, from butter, margarine, liver, milk, ground beef, coffee, and pears. Green tea and chewing tobacco are also rich in vitamin K. Multivitamins and herbal remedies are additional sources of vitamin K. The half-life of vitamin K is only about 1½ days, so continual intake is required, and changes in vitamin K intake affect the anticoagulant activity of warfarin within days. Fifth, coexisting diseases or illnesses may affect the absorption and metabolism of warfarin and vitamin K and the synthesis of clotting factors. Sixth, as with many medications, patient compliance is an issue with warfarin and affects the stability of the anticoagulant effect. All these factors combine to make laboratory monitoring vital for the safe management of warfarin therapy.
10.2.3 PT and INR Basics
The prothrombin time (PT) test is the assay most commonly used to monitor warfarin therapy. The PT measures the time required for the following reaction:
 Thromboplastins are reagent preparations rich in tissue factor and phospholipids. Thromboplastins stimulate clot formation via the extrinsic and common pathways, involving factors VII, X, V, and II, and fibrinogen. Many different thromboplastins are commercially available.

A serious limitation of the PT is that results vary considerably with different analyzers and thromboplastins and may vary with different lots of the same thromboplastin. Consequently, PT results are inconsistent between laboratories and even within laboratories over time, making the PT inadequate for establishing therapeutic ranges and monitoring warfarin therapy, particularly when more than one laboratory is involved. An early attempt to standardize PT results was through the use of the PT ratio (PTR), namely, the PT divided by the mean normal PT. However, lab-to-lab variation was too great for the PTR to be used across laboratories for warfarin therapeutic management.
The International Normalized Ratio (INR) was developed to standardize PT values via the mathematical transformation
 where PT is the prothrombin time, MNPT is the mean normal PT, ISI is the International Sensitivity Index of the thromboplastin, and PTR is the prothrombin time ratio. The objective of the INR is to translate any given PT value into the PTR that would be obtained if the PT were performed by the reference method, which consists of PT testing using the tilt-tube method with an international reference thromboplastin preparation of the World Health Organization (WHO) [3].

Let’s further examine the elements of the INR transformation. The MNPT is the geometric mean of PT determinations from a set of reference subjects (i.e., “normal” subjects) using the laboratory’s analyzer and thromboplastin combination, hereafter referred to as the working method. Refer to Chap. 4, for additional information on the selection of reference subjects. Given n PT values, the geometric mean is calculated by the formula
 in contrast to the arithmetic mean, calculated by the formula
 Although substituting the arithmetic MNPT for the geometric MNPT has no practical significance under most circumstances [4], using the arithmetic mean deviates from the INR schema and may violate regulatory or accreditation standards [5].


The ISI represents the relative responsiveness or sensitivity of a working method compared to the reference method. For a given reduction in active clotting factor concentrations, the PT may be more prolonged or less prolonged, depending on the working method. Those methods that generate prolonged clotting times with relatively small reductions in clotting factor activities are considered responsive or sensitive. The sensitivity of a working method depends largely on the characteristics of the thromboplastin, but different models of analyzers with the same thromboplastin will usually exhibit some difference in sensitivity.
Warfarin therapy decreases the concentrations of active vitamin-K-dependent factors and increases the concentrations of inactive clotting factors. Inactive clotting factors are simply proteins prevented from undergoing post-translational γ-carboxylation of glutamate residues because of the decreased availability of vitamin K-H2. They go by the unwieldy moniker of PIVKAs (Proteins Induced by Vitamin K Antagonists). Thromboplastins have differential sensitivity to concentrations of active clotting factors and PIVKAs, so comparison of methods is best made when all are at a steady state, generally 6 weeks or longer after initiation of warfarin therapy.
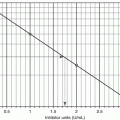
The ISI of a working method is determined by split-sample PT testing against a reference method. According to the WHO protocol, fresh plasma samples from 20 non-warfarinized normal subjects and 60 stably warfarinized subjects are tested by both the working method and reference method. The ISI is the slope of the orthogonal regression line of the reference method log-PT on the working method log-PT, as illustrated in Fig. 10.2. Thus, a working method whose sensitivity is similar to that of the reference method will have an ISI close to 1.0, but a less sensitive working method will have a higher ISI. The College of American Pathologists recommends that laboratories use thromboplastins with an ISI ≤1.70 and the Clinical and Laboratory Standards Institute recommends an ISI ≤1.50 [6, 7], and most laboratories have adopted these recommendations [8].
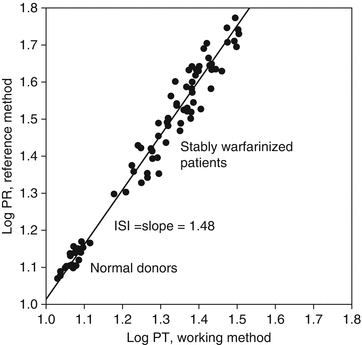

Fig. 10.2
Representation of ISI assignment. The ISI is the slope of the line from the orthogonal regression of the log-PT values from the reference method on the log-PT values from the working method. Refer to the Method Comparison section of Chap. 4, for a discussion of orthogonal regression
In practice, most laboratories do not have the expertise or resources to determine their methods’ ISI values according to the WHO protocol and rely instead on thromboplastin manufacturers to provide ISI values. Manufacturers typically assign ISI values to classes or models of analyzers, but not to specific analyzers.
10.2.4 INR and Calibration
Calibration procedures are routinely used in many areas of the clinical laboratory, particularly in chemistry, immunochemistry, and hematology assays. Calibration is fundamentally the process of determining the mathematical relationship between some measurement such as absorbance or impedance and some value of interest such as an analyte concentration or cell count. Calibration equations are then used to translate measurements on patients’ specimens into the values of interest.
The INR system is, in essence, a calibration of the PT where the measurement is the PT by the working method and the value of interest is the PTR that would have been obtained with the reference method. Table 10.3 compares the INR schema with a typical calibration. While there is much in common, some important differences are worth noting. In a typical calibration, calibrators with assigned target values traceable to a reference or definitive method are used on each analyzer to establish the relationship between the measured responses and the target values, yielding analyzer-specific calibration equations. Additional standards with assigned target values are then used to verify the calibration and determine or verify the range of accuracy. In the INR schema, calibrators and other standards as such do not exist. The thromboplastin reagents themselves are “calibrated” against reference thromboplastins, resulting in the assignment of a set of ISI values for classes or models of analyzers. Thus, the calibration occurs in part on each analyzer with the determination of the MNPT and in part at the manufacturer’s location with the assignment of the ISI. The absence of calibrators and standards in this schema means that the INR calibration is not analyzer-specific and that laboratories cannot readily verify the accuracy of their INRs.
Table 10.3
Comparison of a typical calibration and the INR
Component | Typical calibration | INR |
|---|---|---|
Measured response | Absorbance, impedance, luminescence, etc. | Clotting time (i.e., PT) |
Calculated value | Concentration | INR |
Standards | Calibrators | Thromboplastins |
Target values | Standards traceable to definitive or reference method | Thromboplastins indexed to WHO reference thromboplastins |
Calibration parameters | Slope and intercept, or coefficients of non-linear calibration equations | ISI and MNPT |
Calibration “location” | Analyzer | Analyzer (MNPT) and manufacturer (ISI) |
Range of accuracy | Determined in laboratory or determined by manufacturer and verified in laboratory | Difficult or impossible to determine in most labs |
Calibration verification | Verified in laboratory | Difficult or impossible to do in most labs |
Limitations | Matrix effects | Analyzer effects |
It should come as little surprise that a host of publications have reported inadequacies with the INR system. Interested readers may find references of these reports in other publications [1, 9]. Problems include the incorrect assignment of class- or model-specific ISI values by manufacturers and individual analyzer effects that invalidate the class- or model-based ISI values. Nevertheless, the INR system appears to have decreased the overall lab-to-lab variation in PT values for monitoring warfarin therapy and has allowed the adoption of standardized therapeutic ranges throughout the world.
10.2.5 Plasma Calibrants
Due to the limitations of the calibration provided by the INR schema, described above, alternate approaches have emerged that use certified plasma calibrants to provide analyzer-specific calibration (“local calibration”) and calibration verification [10]. Procedures for using INR calibrants are described in CLSI document H-54 [9]. Local INR calibration using plasma calibrants is appealing from both a theoretical perspective and the documented deficiencies of the INR schema, and the use of INR calibrants improves INR accuracy and decreases interlaboratory variation [11–17]. However, calibrants are not available in the United States for most coagulation test systems. In addition, several fundamental issues still need to be addressed, the most significant of which is the assignment of target INR values to calibrants. Currently, different reference thromboplastins, analytical methods, and methods of producing factor-deficient plasma may produce significantly different target INR values [13]. The ability to reliably determine the “true” INR of calibrants remains elusive. Other unresolved questions are the required precision of the calibration procedure, optimal number of calibrants, stability of calibration curves, determination of a full calibration curve versus an ISI-only calibration, and potential matrix effects of calibrants [13, 18].
10.2.6 Evaluation of Discrepant INRs
Warfarin patients generally receive INR testing over an extended period of time and often from more than one laboratory. It is not uncommon, in the author’s experience, for the laboratory director to receive inquiries about INR values that appear discrepant, either between two laboratories or from one laboratory at different times. Causes of discrepant INRs are listed in Table 10.4. Some discrepancies are caused by the laboratory, some are caused by patients, and some reflect inherent limitations of the INR schema. Not all discrepancies can be resolved, but all reports of possible discrepancies should be taken seriously and evaluated to assure that correctable issues are identified and addressed.
Table 10.4
Causes of discrepant INR values
Testing | Patient |
|---|---|
Different citrate concentrations | Changes in diet (including herbal remedies and vitamin supplements) |
Improper specimen handling | Changes in warfarin dosage |
Misidentified specimen | Changes in patient compliance |
Incorrect ISI assignment | Changes in medications |
Incorrect MNPT determination | Variation in specimen collection time relative to warfarin ingestion |
Incorrect INR equation | Biological variation in clotting factor levels |
Incorrect calculations | Genetic determinants of warfarin metabolism |
Incorrect entry of ISI or MNPT in computer system | |
Reporting errors | |
Analytical imprecision | |
Analyzer problems | |
Reagent problems | |
Lupus anticoagulant | |
Analyzer-specific effects not corrected by INR schema |
When evaluating an INR discrepancy, the laboratory director should encourage the patient’s physician to increase the thoroughness of the dietary and medication history. One vignette will serve as an illustration. A patient whose INRs had been stable for many months had a markedly elevated INR. On questioning, the patient denied any changes in diet, medications, or compliance, and repeat testing confirmed the INR elevation. Finally, the physician asked the patient to bring her medications to the office. The physician had prescribed 2 mg warfarin tablets, yet the patient’s medications included warfarin tablets marked with the number 5. The patient said she had run out of her latest prescription, fished in the medicine cupboard and found some old tablets that appeared to her aged eyes to be marked with a “2” and started taking them until it was time for another appointment with her physician. Unfortunately, the number on the tablets was actually a 5, so the patient had been taking a much larger dose than necessary.
10.2.7 Therapeutic Monitoring
The recommended test for monitoring warfarin therapy is the INR. Use of any other test should be discouraged. Although several target ranges were widely used in the past, recent studies have led to the recommendation of a single target range of 2.0–3.0 for virtually all indications [19]. Guidelines for warfarin dosing, frequency of testing, and treatment of overdosage are beyond the scope of this chapter, but the interested reader is referred to an excellent review by Ageno and colleagues [1].
A few additional points about warfarin therapeutic monitoring may be useful. First, the PT assay is sensitive to changes in factor VII levels. Because factor VII has a short half-life, the PT/INR may begin to be prolonged within hours of a warfarin dose. Some non-compliant patients have admitted to taking warfarin only the day prior to testing to make it appear to the physician that the patient is compliant with the prescribed therapy. In cases where patient compliance is doubtful but the INR indicates a warfarin effect, specific factor assays showing decreased factor VII levels with normal or nearly normal factor II levels suggest that warfarin has been taken only recently. During long-term therapy at steady state, factor II and factor VII levels should be roughly equally decreased.
Second, heparin in therapeutic doses does not significantly affect the PT/INR with most working methods, since most thromboplastin reagents contain heparin neutralizers. For patients on both heparin and warfarin, the INR reflects only the warfarin effect. The situation is different for direct thrombin inhibitors (DTIs) and activated factor X (factor Xa) inhibitors, discussed later in this chapter. DTIs and factor Xa inhibitors affect clot-based assays that involve thrombin or factor X, including the PT. In patients being treated with warfarin and a DTI or factor Xa inhibitor, the INR reflects the effects of both warfarin and the other antithrombotic medication. During the conversion from a DTI or factor Xa inhibitor to warfarin, the INR therapeutic target should be increased or the dose of DTI should be decreased [20–23].
Third, patients with significantly supratherapeutic INRs are frequently treated with oral vitamin K to partially reverse the warfarin effect. Many physicians believe the reversal will occur within a few hours, but significant lowering of the INR may take 24 h or longer due to the relatively long half-life of warfarin [2].
10.3 Unfractionated Heparin
Unfractionated heparin (UFH) is an IV or subcutaneously administered anticoagulant, widely used for the treatment and prevention of thromboembolic events, including deep venous thrombosis, pulmonary embolism, stroke, myocardial infarction, unstable angina, and some cases of disseminated intravascular coagulation (DIC), and for anticoagulation during cardiopulmonary bypass, percutaneous coronary intervention, hemodialysis, and extracorporeal membrane oxygenation (ECMO) procedures.
10.3.1 Mechanism of Action
UFH is a heterogeneous group of anionic mucopolysaccharides, called glycosaminoglycans, with anticoagulant properties. The molecular weight range is 3,000–30,000 Da, averaging 15,000–18,000 Da, around 45–50 saccharides. Despite carrying the name heparin because it was originally extracted from liver [24], pharmaceutical preparations are usually derived from porcine intestinal mucosa or bovine lung. The term “heparin” generally refers to unfractionated heparin, so named because of its heterogeneity in size and function. In this chapter, the abbreviation UFH will be used for unfractionated heparin and LMWH for low-molecular weight heparin (discussed later).
Heparin, either UFH or LWMH, exerts its anticoagulant effect via several mechanisms, but the most important by far is the potentiation of the serine protease inhibitor antithrombin (AT), formerly called antithrombin III. By itself, AT is a slow inhibitor of thrombin. Heparin binds to AT through a specific pentasaccharide sequence, inducing a conformational change that increases the rate of binding to thrombin by 1,000-fold. This relationship is illustrated in Fig. 10.3. Heparin-AT also inhibits factor Xa, factor IXa, factor VIIa-tissue factor complex, factor XIa, factor XIIa, and plasma kallikrein. It indirectly inhibits thrombin-induced activation of platelets and factors V and VIII. Thrombin is tenfold more sensitive to heparin-AT inhibition than is factor Xa, and factor Xa is more sensitive than the other coagulation factors. AT binds covalently to the active serine centers of coagulation factors, then heparin dissociates and can be reutilized [25].
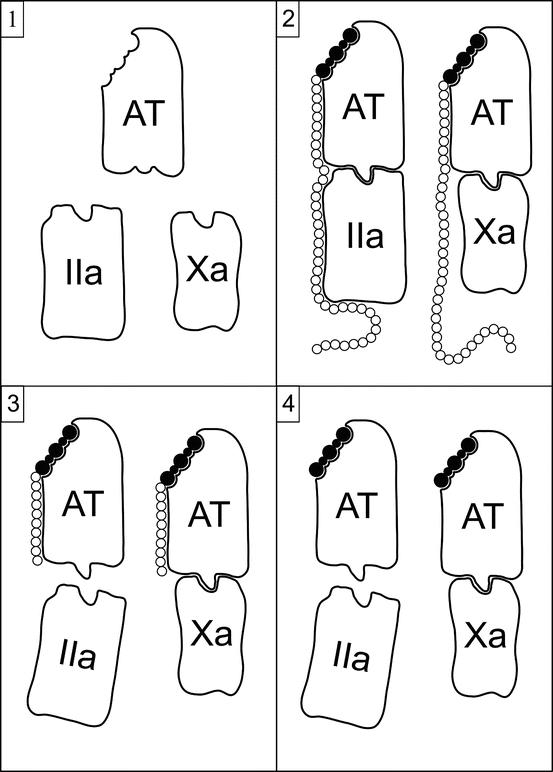

Fig. 10.3
Schematic representation of the potentiation of AT by heparin and its derivatives. Panel 1 illustrates the lack of activity of AT in its native state against factor IIa (thrombin) or factor Xa. Panel 2 shows the interaction and activity of UFH and AT. The binding of UFH to AT occurs through a specific high-affinity pentasaccharide sequence (shaded), inducing a conformational change in AT that markedly enhances its activity. The long saccharide chain of UFH is needed for anti-IIa but not anti-Xa activity. Panel 3 shows the interaction and activity of LWMH and AT. The binding of LMWH to AT occurs via the high-affinity pentasaccharide. AT-LMWH complexes in which the LWMH molecules have fewer than 18 saccharides lose anti-IIa activity but retain anti-Xa activity. LMWH molecules of 18 or more saccharides retain anti-IIa activity. Panel 4 shows the interaction and activity of fondaparinux and AT. Fondaparinux is a synthetic version of the high-affinity pentasaccharide. Fondaparinux-AT complexes do not have anti-IIa activity
In pharmaceutical preparations, only one-third of UFH molecules possess the high-affinity pentasaccharide required for AT potentiation. The remaining two-thirds have minimal anticoagulant activity at therapeutic levels. Inhibition of thrombin by heparin-AT requires heparin molecules of 18 or more saccharides. Complexes with small heparin molecules inhibit factor Xa and other factors, but not thrombin.
Several other minor mechanisms contribute to the anticoagulant effect of UFH. At high concentrations, UFH molecules of 24 or more saccharides, with or without the high-affinity pentasaccharide, bind to heparin cofactor II and catalyze the inactivation of thrombin. The non-specific binding of heparin to platelets inhibits platelet function (usually) and contributes to the hemorrhagic effects of heparin therapy. Platelet binding is more pronounced with large heparin molecules than with small heparin molecules. Heparin induces the secretion of tissue factor pathway inhibitor (TFPI) by endothelial cells, which reduces the procoagulant activity of the factor VIIa-tissue factor complex. Finally, heparin binds to von Willebrand factor (vWF), inhibiting platelet adhesion mediated by vWF [24].
10.3.2 Rationale for Laboratory Monitoring
Heparin is a highly effective anticoagulant when present in an adequate concentration. Laboratory monitoring is required for a number of reasons. First, UFH has a relatively narrow therapeutic window. When used for treatment, inadequate concentrations fail to produce the intended therapeutic response with increased risk of recurrence or extension of thromboembolism, while excessive concentrations yield an increased risk of hemorrhagic complications. When used for anticoagulation for invasive procedures, failure to achieve an adequate level of anticoagulation may lead to procedure failure, clotting in extracorporeal circuits, or embolic events. Second, the dose-response is highly unpredictable between patients and even in the same patient over time. Non-specific binding of heparin to endothelial cells, macrophages, platelets, and a variety of plasma proteins makes the dose-response highly variable. Even with weight-based loading doses and infusion rates, therapeutic levels of anticoagulation are difficult to achieve and maintain. Third, the rate of heparin resistance is high. Heparin resistance, defined as a requirement for >35,000 U UFH per 24 h to achieve a therapeutic level, occurs in up to 25 % of patients treated with UFH. Heparin resistance is classically caused by AT deficiency, particularly with AT levels <25 %, but is also associated with increases of factor VIII, fibrinogen, platelet factor 4, and heparin-binding proteins. Many of these proteins are acute-phase reactants whose concentrations rise during the acute episodes that create the need for heparin therapy.
10.3.3 Heparin-Induced Thrombocytopenia
One complication of UFH deserves special mention in the context of laboratory monitoring. Heparin-induced thrombocytopenia (HIT) is a serious, potentially life-threatening complication that requires routine monitoring of platelet counts during UFH therapy if clinicians consider the risk of HIT to be 1 % or higher [26]. HIT is caused by antibodies that recognize heparin-platelet factor 4 complexes on the surface of platelets. Antibody binding to Fc receptors activates platelets, with release of prothrombotic microparticles and activation of coagulation, leading to thrombin generation and, often, venous or arterial thrombosis [24, 26]. Thrombocytopenia results from the removal of activated platelets from circulation and is the most common clinical manifestation of HIT. In 85–90 % of cases, the platelet count falls below 150 × 109/L. In another 5–10 % of cases, the platelet count falls more than 30 % below baseline, but not below the 150 × 109/L threshold. HIT is associated with a 20–75 % risk of venous or arterial thromboembolic events including deep venous thrombosis (DVT), pulmonary embolism (PE), myocardial infarction (MI), stroke, occlusion of extremities or digits, and so forth. It should be noted that HIT is not the non-immune-mediated, transient, modest drop in platelet counts commonly observed with heparin therapy, although this phenomenon has also been called HIT or Type I HIT.
HIT is typically recognized by platelet count monitoring, but thrombosis precedes thrombocytopenia in up to 25 % of cases. For individuals who have not previously received heparin, HIT usually occurs 5–10 days after initiation of heparin therapy. For those who have previously received heparin, particularly within the prior 100 days, HIT may occur within 24 h (“rapid-onset HIT”). In a small number of HIT patients, the onset of thrombocytopenia begins several days after heparin has been stopped (“delayed-onset HIT”). The risk of HIT varies by patient group, gender, and type and duration of heparin exposure. This risk of HIT is 1–5 % in postoperative patients, 0.1–1 % in medical patients, and <0.1 % in obstetric patients. Women have twice the risk as men [26].
Two types of assays are used to detect the presence of HIT antibodies (i.e., anti-heparin-PF4 antibodies), namely, activation assays and antigenic assays. Activation assays are based on the ability of serum or plasma HIT antibodies to activate platelets in the presence of heparin. One or more measures of platelet activation are used, particularly serotonin release and platelet aggregation. These tests are non-standardized and vary widely in their accuracy. Variability between donor platelets and variability between heparin preparations are confounding factors, and alterations in the concentrations of platelets, heparin, and patient serum may produce different results. Nevertheless, in experienced hands the activation assays are more predictive than antigenic assays, with sensitivity as high as 98 % with specificity approaching 100 %. Antigenic assays are based on the detection of antibodies that bind to heparin-PF4 complexes or to polyvinyl sulfonate-heparin complexes. Antigenic assays are more standardized, technically easier, and have more rapid turnaround time than activation assays. Antigenic assays detect clinically insignificant antibodies more frequently than do activation assays, and antigenic assays may miss antibodies formed against proteins other than PF4, but overall the sensitivity of antigenic assays is 94–100 %, with specificity of 82–92 %. Antigenic assay methodologies are enzyme immunoassays (EIA) and a gel centrifugation assay, although only enzyme immunoassays are currently approved in the United States.
The high sensitivity of antigenic assays yields a very high negative predictive value, such that a negative antigenic assay essentially rules out HIT in a patient with a low pretest probability. On the other hand, the moderate specificity produces a low positive predictive value (PPV) of 50 % or less, particularly in patients with a low pretest probability. The PPV may be increased by selecting patients with an intermediate to high pretest probability of HIT. The best-studied clinical prediction rule is the 4T’s score, based on thrombocytopenia, timing, thrombosis, and plausible other causes.
Specificity and PPV of antigenic assays may also be increased by testing for only IgG antibodies. Polyvalent assays detect IgG, IgA, and IgM antibodies, but specimens with positive EIA results due to IgA or IgM antibodies do not generate serotonin release in activation assays. IgG-only antigenic assays have equivalent sensitivity with greater specificity than polyvalent assays [27]. In addition, the optical density (OD) values of antigenic EIA tests correlate with the results of serotonin release assays. Low-positive OD values are associated with a low probability (<5 %) of a strongly positive serotonin release assay, whereas high-positive OD values are associated with a high probability (~90 %) of a strongly positive serotonin release assay [28, 29]. Clinicians may find it helpful for the laboratory to report the OD value in addition to the interpretation of the antigenic test result.
For more information about HIT, the interested reader is referred to an excellent review by Linkins et al. [26].
10.3.4 PTT Basics
The activated partial thromboplastin time (PTT) test is the assay most commonly used to monitor UFH therapy. The PTT measures the time required for the following reaction:
 Clot formation occurs via the intrinsic and common pathways, involving high molecular weight kininogen, prekallikrein, factors XII, XI, IX, VIII, X, V, and II, and fibrinogen. Many different phospholipid and activator reagents are available commercially [30].

The PTT is prolonged by IV UFH and has been used successfully in the management of UFH therapy for many decades. However, as with PT results for monitoring warfarin therapy, PTT results vary widely with different analyzers and reagents and are inconsistent between laboratories. PTT values may vary considerably even with different reagents or different lots of reagent from the same manufacturer. Unlike with the PT assay, the PTT has no INR-equivalent for standardizing results and establishing universal therapeutic ranges. Each laboratory must establish therapeutic range limits for its working method and must verify or adjust the limits whenever a reagent change is made. See the discussion below for determination of therapeutic ranges.
The popularity of the PTT for monitoring UFH therapy is based on several factors. First, there is a logical appeal in a test that provides a physiologic measurement of the anticoagulant effect rather than simply providing a heparin concentration. Second, the PTT is widely available with relatively short turnaround time, has good reproducibility, and is inexpensive. Third, clinicians have decades of experience with the PTT and have achieved a comfort level with its use for UFH monitoring. Fourth, until recently there have not been good alternatives. These characteristics have combined to provide a general level of clinical satisfaction with the PTT assay.
The PTT also possesses some limitations and drawbacks for monitoring UFH therapy [24, 31]. First, the PTT is a non-standard assay, as described above, so therapeutic ranges must be established in each laboratory. Different types of UFH may produce different PTT response curves. Second, the PTT is useful only for monitoring therapeutic IV doses or high-dose subcutaneous UFH therapy. The PTT is not useful for standard-dose subcutaneous therapy, due to limited PTT response, or for the high-dose IV UFH required for cardiac catheterization or other procedures, due to an excessive PTT response. Third, the PTT is affected by variables other than UFH, including increased concentrations of factor VIII and fibrinogen, decreased concentrations of AT or intrinsic and common pathway proteins, lupus anticoagulants, and thrombolytic agents. When lupus anticoagulants are present, the PTT becomes unpredictable for assessing UFH response and should not be used. The anti-Xa assay, discussed below, is the test of choice for patients with lupus anticoagulants. Fourth, specimens have relatively short stability, particularly when heparin is present. See Chap. 2, for additional discussion of specimens. Overall, the advantages of the PTT are perceived as outweighing the disadvantages for most patients, so the PTT continues to enjoy widespread use for monitoring IV UFH therapy.
Stay updated, free articles. Join our Telegram channel

Full access? Get Clinical Tree


