Methods of Molecular Analysis
2.1 INTRODUCTION
Advances made over the last 10 years in understanding the biology of cancer have transformed the field of oncology. While genetic analysis was limited previously to gross chromosomal abnormalities in karyotypes, DNA in cells can now be analyzed to the individual base pair level. This intricate knowledge of the genetics of cancer increases the possibility that personalized treatment for individual cancers lies in the near future. To appreciate the relevance and nature of these technological advances, as well as their implications for function, an understanding of the modern tools of molecular biology is essential. This chapter reviews the cytogenetic, nucleic, proteomic, and bioinformatics methods used to study the molecular basis of cancer, and highlights methods that are likely to affect in the future management of cancer.
2.2 PRINCIPAL TECHNIQUES FOR NUCLEIC ACID ANALYSIS
2.2.1 Cytogenetics and Karyotyping
Cancer arises as a result of the stepwise accumulation of genetic changes that confer a selective growth advantage to the involved cells (see Chap. 5, Sec. 5.2). These changes may consist of abnormalities in specific genes (such as amplification of oncogenes or deletion of tumor-suppressor genes). Although molecular techniques can identify specific DNA mutations, cytogenetics provides an overall description of chromosome number, structure, and the extent and nature of chromosomal abnormalities.
Several techniques can be used to obtain tumor cells for cytogenetic analysis. Leukemias and lymphomas from peripheral blood, bone marrow, or lymph node biopsies are easily dispersed into single cells suitable for chromosomal analysis. In contrast, cytogenetic analysis of solid tumors has several difficulties; the cells are tightly bound together and must be dispersed by mechanical means and/or by digestion with proteolytic enzymes (eg, collagenase) which can damage cells. Secondly, the mitotic index in solid tumors is often low (see Chap. 9, Sec. 9.2), making it difficult to find enough metaphase cells to obtain good-quality cytogenetic preparations. Finally, lymphoid and myeloid and other (normal) cells often infiltrate solid tumors and may be confused with the malignant cell population.
Chromosomes are usually examined in metaphase, when they become condensed and appear as 2 identical sister chromatids held together at the centromere as DNA replication has already occurred at that stage of mitosis. Exposure of the tumor cells to agents such as colcemid arrests them in metaphase by disrupting the mitotic spindle fibers that normally separate the chromatids. The cells are then swollen in a hypotonic solution, fixed in methanol-acetic acid, and metaphase “spreads” are prepared by physically dropping the fixed cells onto glass microscope slides.
Chromosomes can be recognized by their size and shape and by the pattern of light and dark “bands” observed after specific staining. The most popular way of generating banded chromosomes is proteolytic digestion with trypsin, followed by a Giemsa stain. A typical metaphase spread prepared using conventional methods has approximately 550 bands, whereas cells spread at prophase can have more than 800 bands; these bands can be analyzed using bright-field microscopy and digital photography. The result of cytogenetic analysis is a karyotype, which, in written form, describes the chromosomal abnormalities using the international consensus cyto-genetic nomenclature (Brothman et al, 2009; see Fig. 2–1 and Table 2–1). Table 2–2 lists common chromosomal abnormalities in lymphoid and myeloid malignancies.
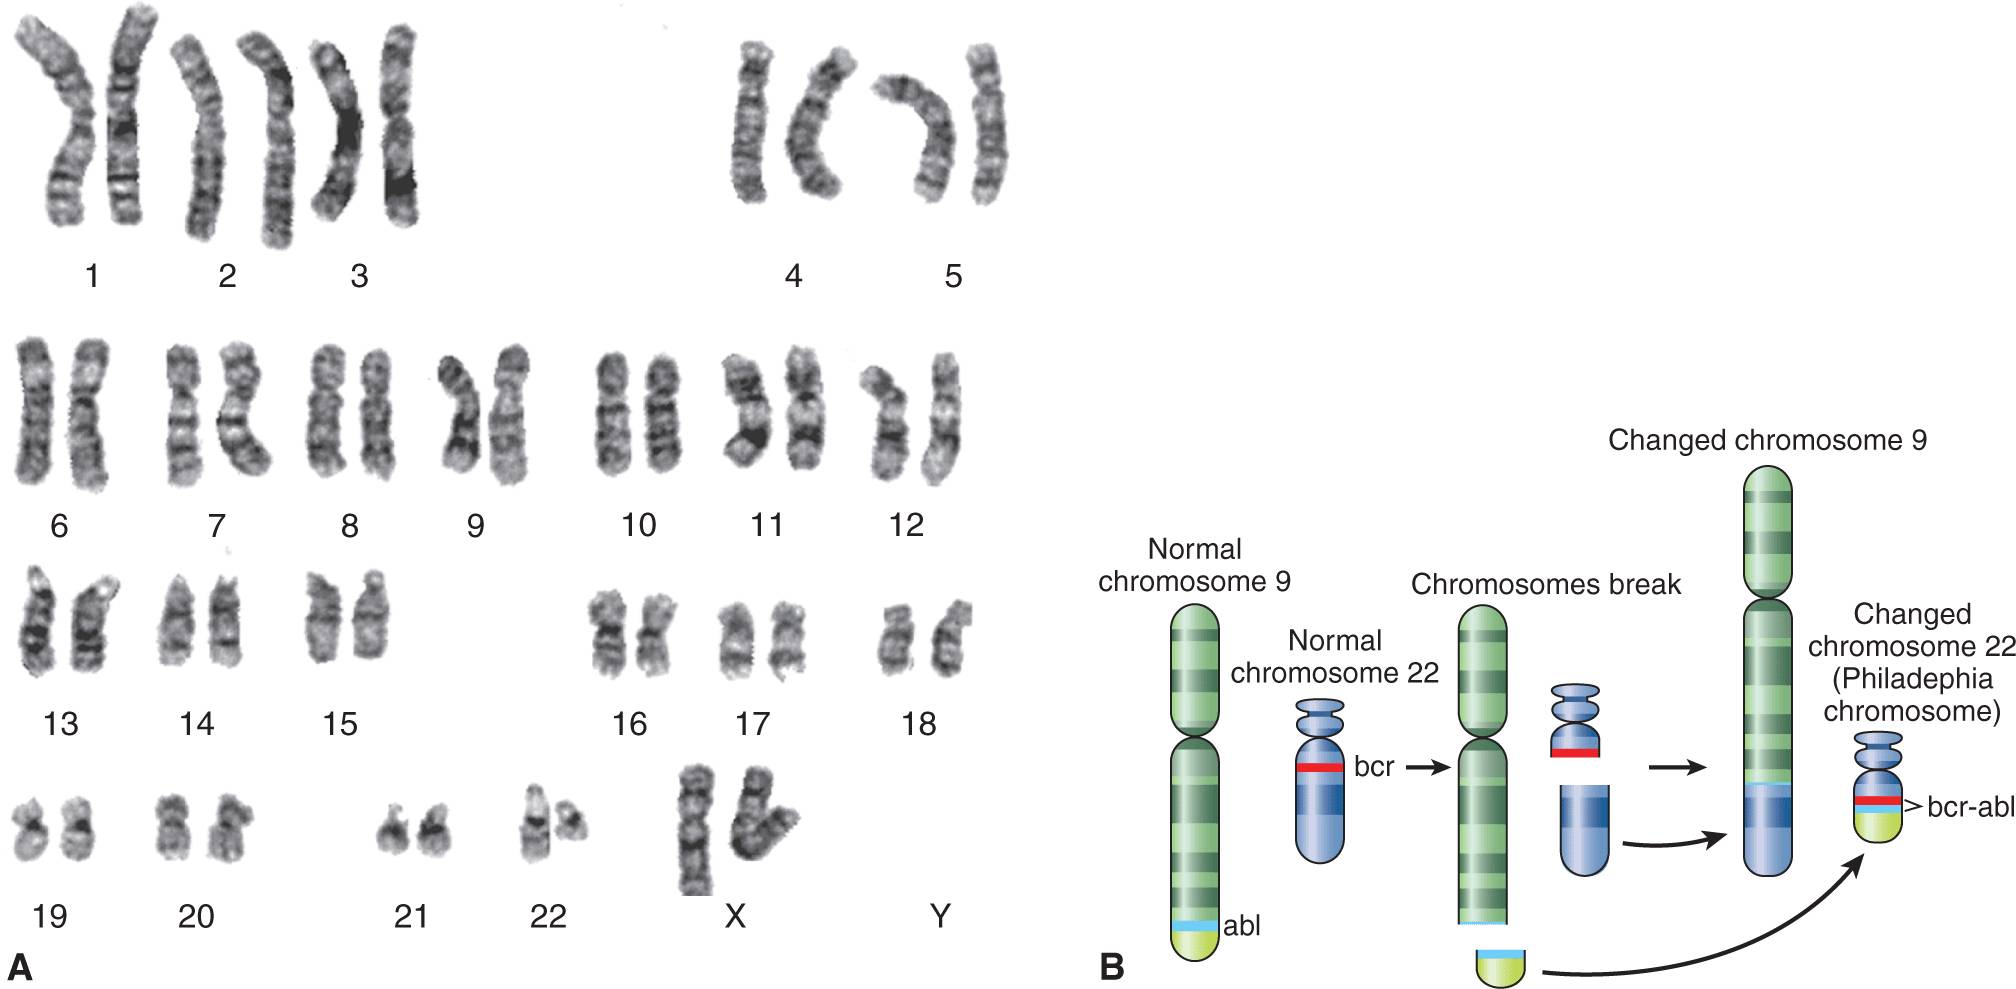
FIGURE 2–1 The photograph on the left (A) shows a typical karyotype from a patient with chronic myelogenous leukemia. By international agreement, the chromosomes are numbered according to their appearance following G-banding. Note the loss of material from the long arm of one copy of the chromosome 22 pair (the chromosome on the right) and its addition to the long arm of 1 copy of chromosome 9 (also the chromosome on the right of the pair). B) A schematic illustration of the accepted band pattern for this rearrangement. The green and red lines indicate the precise position of the break points that are involved. The karyotypic nomenclature for this particular chromosomal abnormality is t(9;22)(q34;q11). This description means that there is a reciprocal translocation between chromosomes 9 and 22 with break points at q34 on chromosome 9 and q11 on chromosome 22. The rearranged chromosome 22 is sometimes called the Philadelphia chromosome (or Ph chromosome), after the city of its discovery.
TABLE 2–1 Nomenclature for chromosomes and their abnormalities.
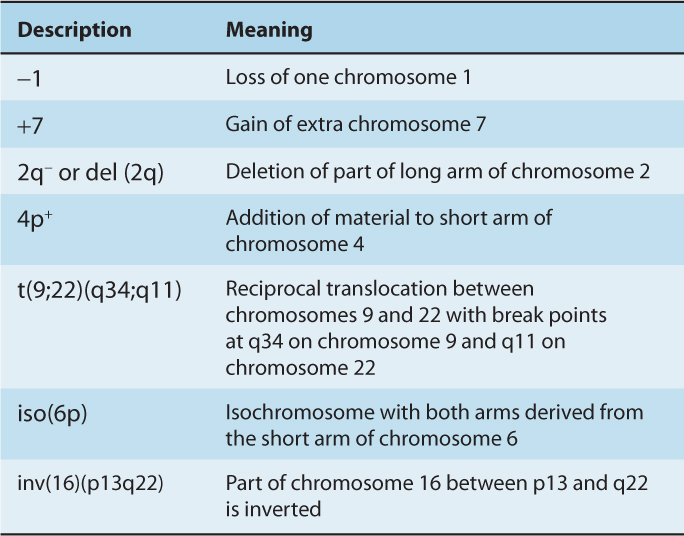
TABLE 2–2 Common chromosomal abnormalities in lymphoid and myeloid malignancies.
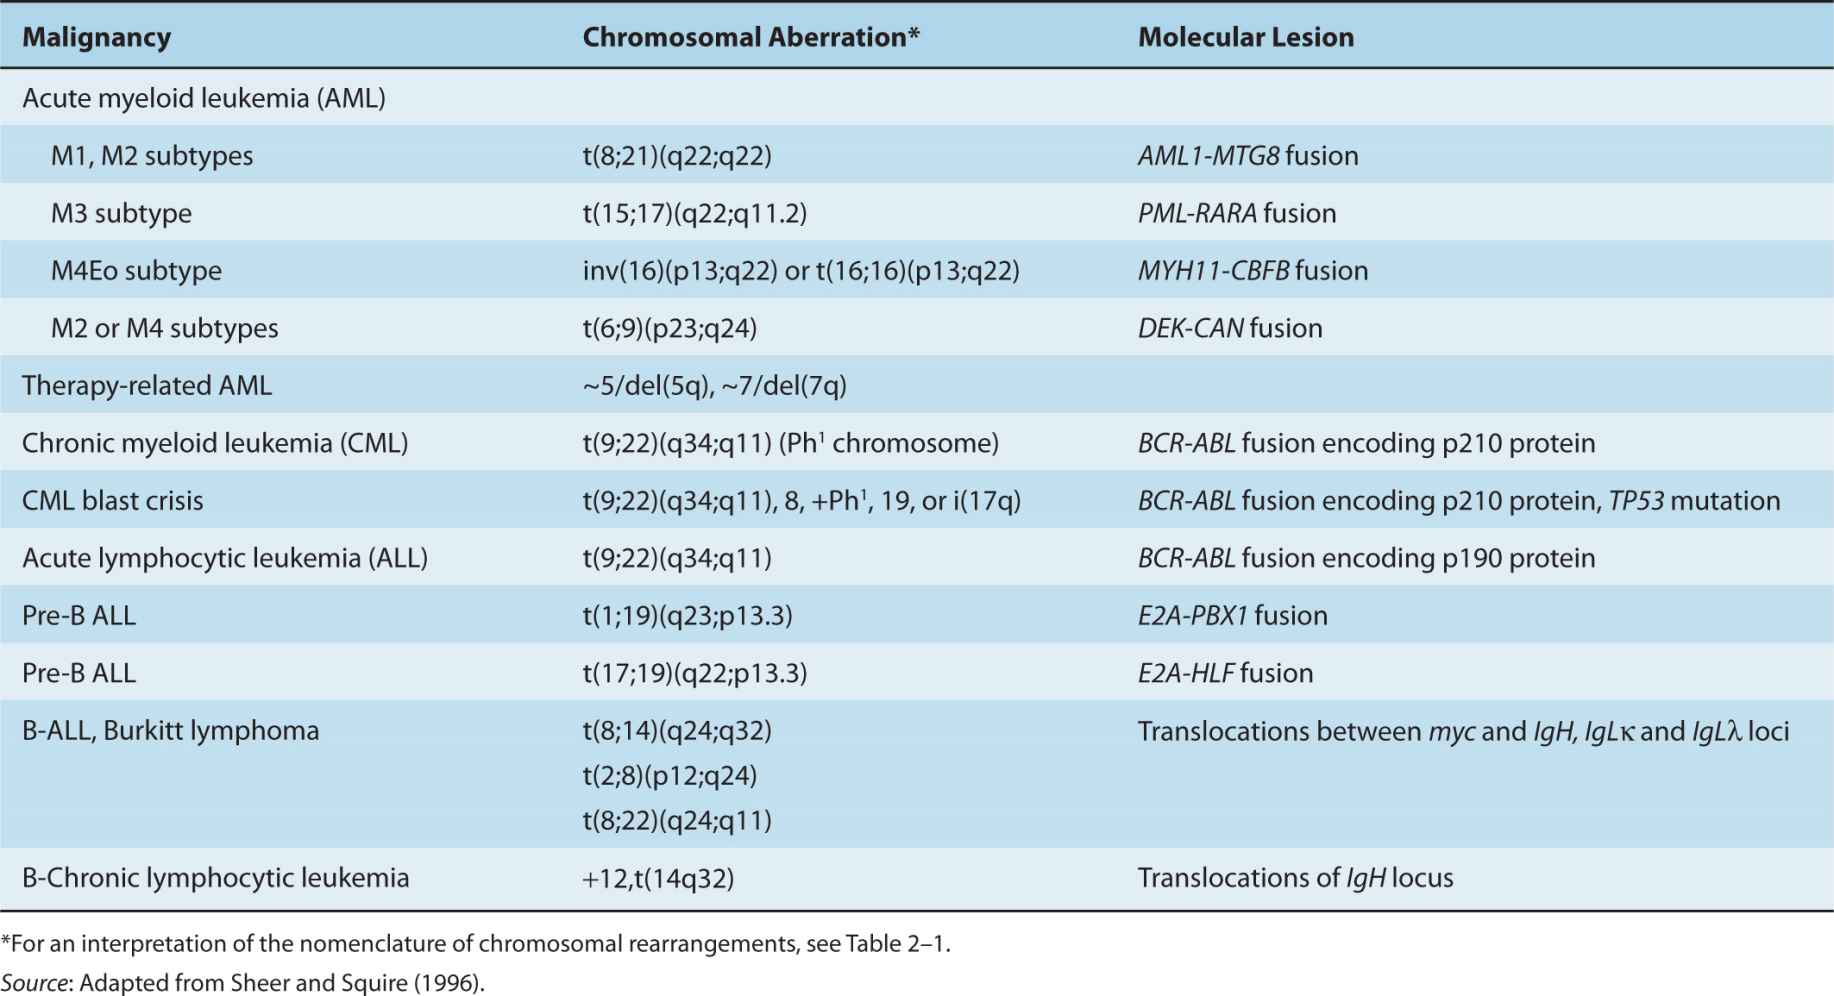
The study of solid tumors has been facilitated by new analytic approaches that combine elements of conventional cytogenetics with molecular methodologies. This new hybrid discipline is called molecular cytogenetics, and its application to tumor analysis usually involves the use of techniques based on fluorescence in situ hybridization or FISH (see Sec. 2.2.6).
2.2.2 Hybridization and Nucleic Acid Probes
DNA is composed of 2 complementary strands (the sense strand and the non-sense strand) of specific sequences of 4 nucleotide bases that make up the genetic alphabet. The association (via hydrogen bonds) between 2 bases on opposite complementary DNA or certain types of RNA strands that are connected via hydrogen bonds is called a base pair (often abbreviated bp). In the canonical Watson-Crick DNA base pair, adenine (A) forms a base pair with thymine (T) and guanine (G) forms a base pair with cytosine (C). In RNA, thymine is replaced by uracil (U). There are 2 processes that rely on this base pairing (Fig. 2–2). As DNA replicates during the S phase of the cell cycle, a part of the helical DNA molecule unwinds and the strands separate under the action of topoisomerase II (see Chap. 18, Fig. 18–13). DNA polymerase enzymes add nucleotides to the 3′-hydroxyl (3′-OH) end of an oligonucleotide that is hybridized to a template, thus leading to synthesis of a complementary new strand of DNA. Transcription of messenger RNA (mRNA) takes place through an analogous process under the action of RNA polymerase with one of the DNA strands (the non-sense strand) acting as a template; complementary bases (U, G, C, and A) are added to the mRNA through pairing with bases in the DNA strand so that the sequence of bases in the RNA is the same as in the “sense” strand of the DNA (except that U replaces T). During this process the DNA strand is separated temporarily from its partner through the action of topoisomerase I (see Chap. 18, Sec. 18.4). Only parts of the DNA in each gene are translated into polypeptides, and these coding regions are known as exons; non-coding regions (introns) are interspersed throughout the genes and are spliced out of the mRNA transcript during the RNA maturation process and before protein synthesis. Synthesis of polypeptides, the building blocks of proteins, are then directed by the mRNA in association with ribosomes, with each triplet of bases in the exons of the DNA encoding a specific amino acid that is added to the polypeptide chain.
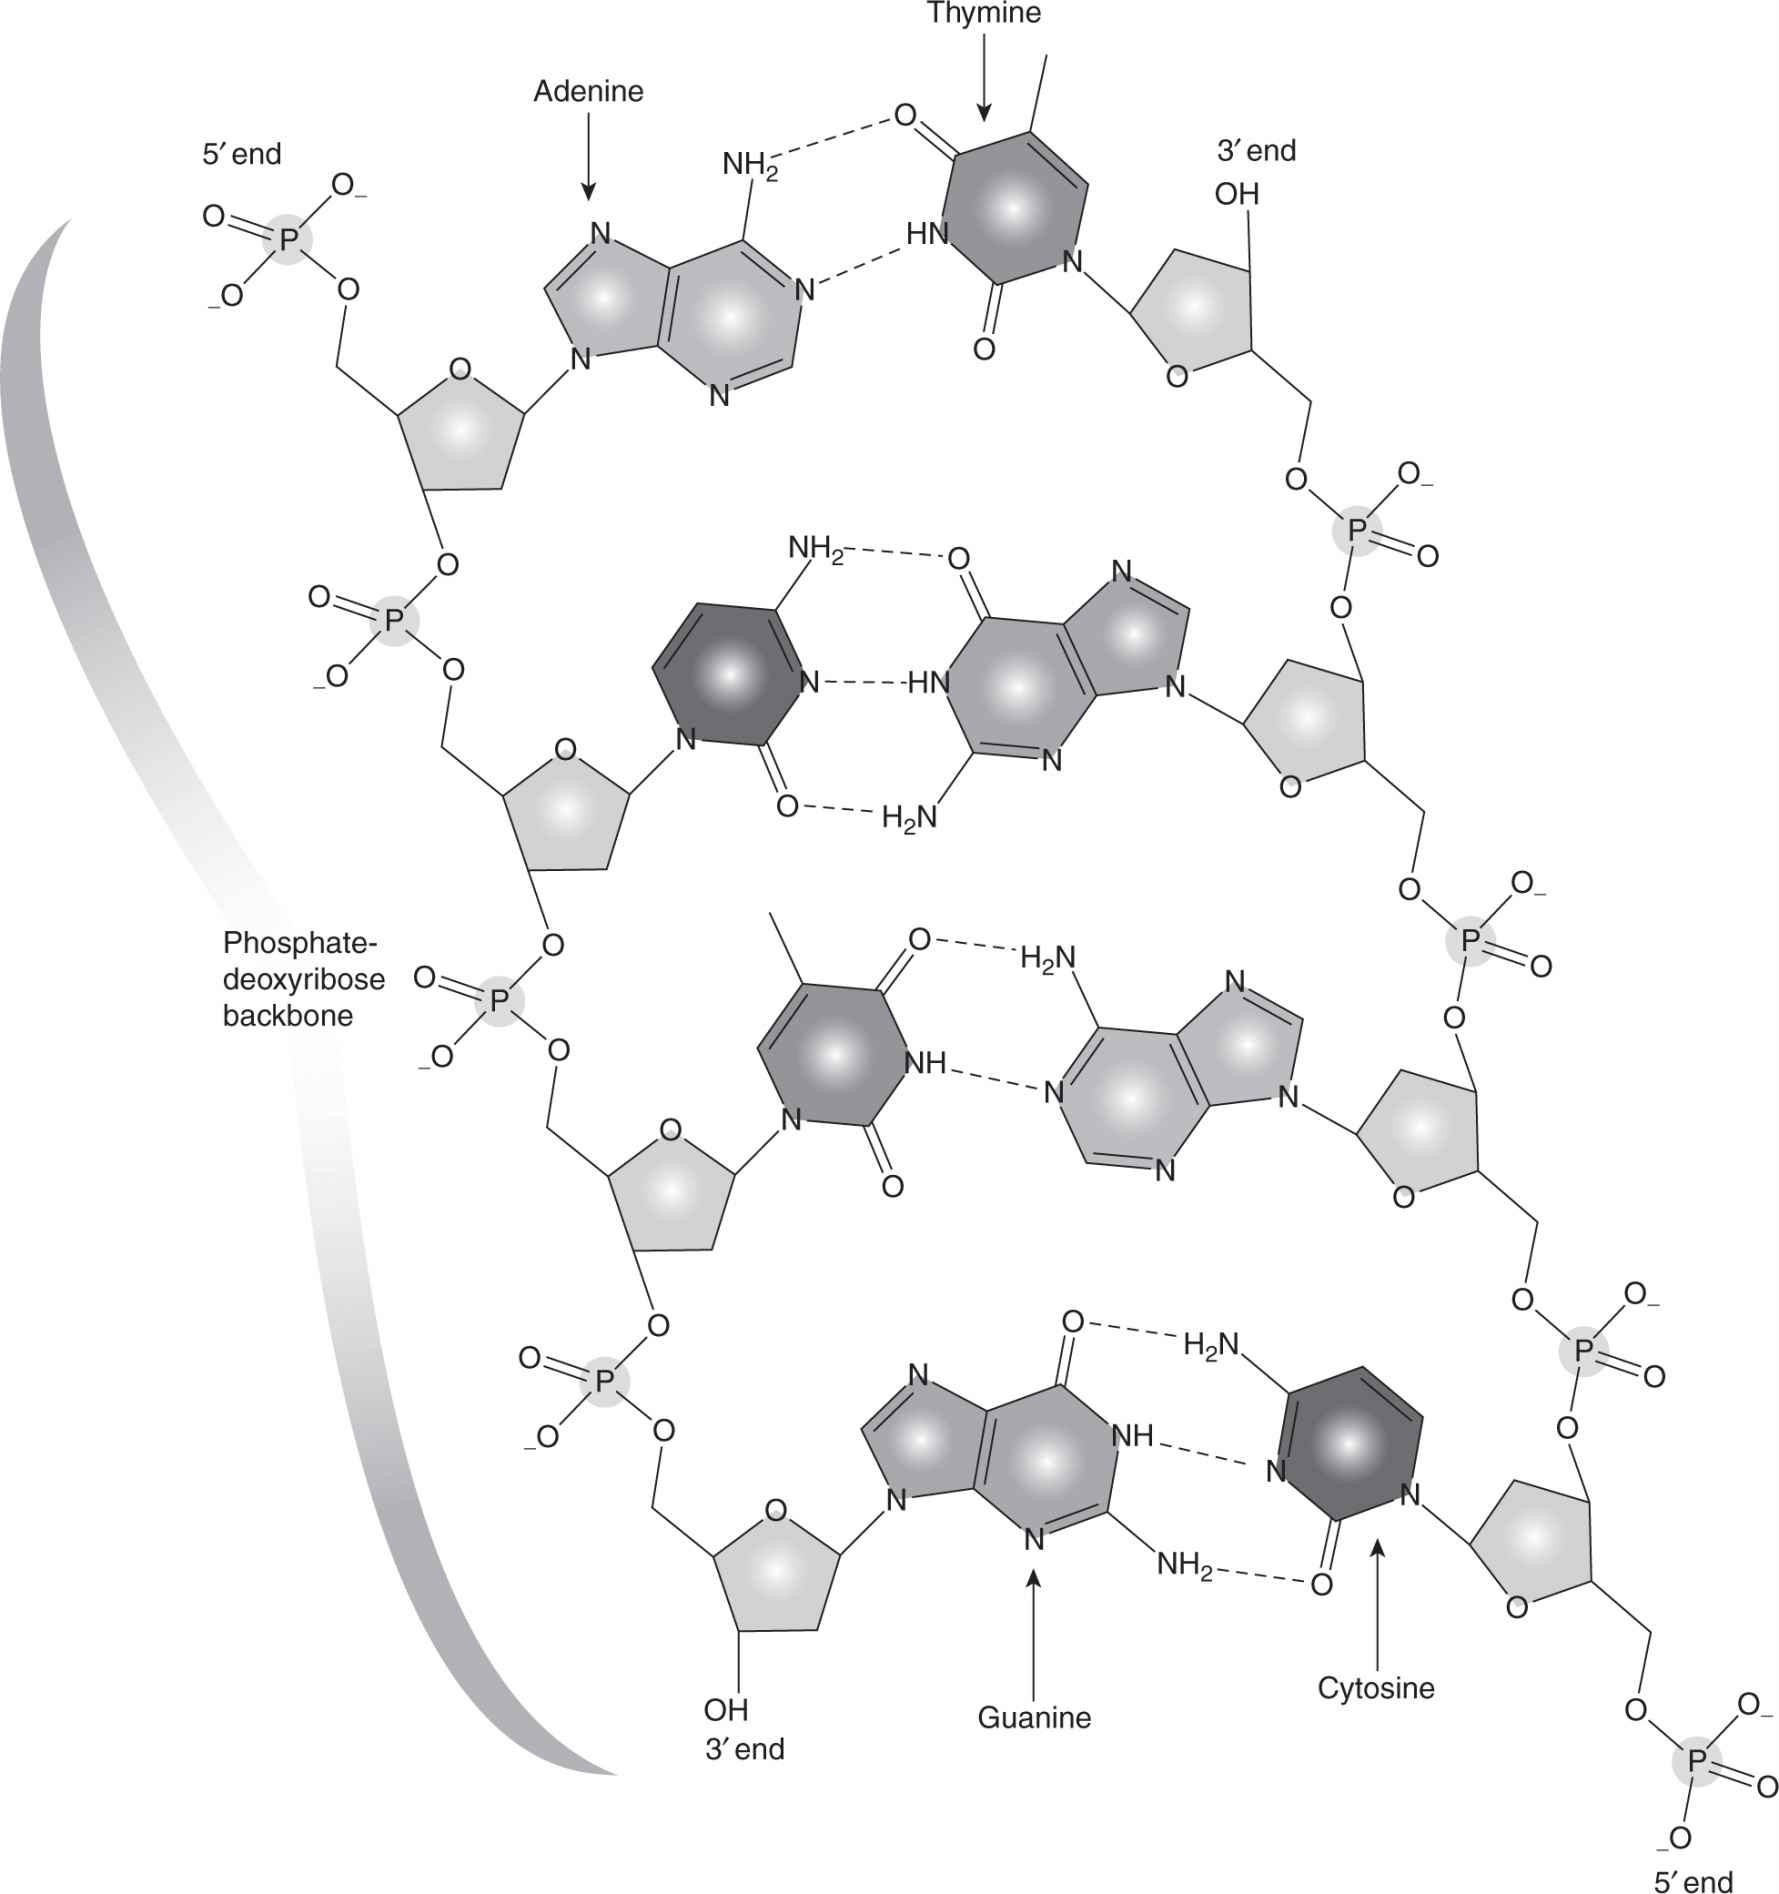
FIGURE 2–2 The DNA duplex molecule, also called the double helix, consists of 2 strands that wind around each other. The strands are held together by chemical attraction of the bases that comprise the DNA. A bonds to T and G bonds to C. The bases are linked together to form long strands by a “backbone” chemical structure. The DNA bases and backbone twist around to form a duplex spiral.
To develop an understanding of the techniques now used in both clinical cancer care and research, it is necessary to understand the specificity of hybridization and the action and fidelity of DNA polymerases. When double-stranded DNA is heated, the complementary strands separate (denature) to form single-stranded DNA. Given suitable conditions, separated complementary regions of specific DNA sequences can join together to reform a double-stranded molecule. This renaturation process is called hybridization. This ability of single-stranded nucleic acids to hybridize with their complementary sequence is fundamental to the majority of techniques used in molecular genetic analysis. Using an appropriate reaction mixture containing the relevant nucleotides and DNA or RNA polymerase, a specific piece of DNA can be copied or transcribed. If radiolabeled or fluorescently labeled nucleotides are included in a reaction mixture, the complementary copy of the template can be used as a highly sensitive hybridization-dependent probe.
2.2.3 Restriction Enzymes and Manipulation of Genes
Restriction enzymes are endonucleases that have the ability to cut DNA only at sites of specific nucleotide sequences and always cut the DNA at exactly the same place within the designated sequence. Figure 2–3 illustrates some commonly used restriction enzymes together with the sequence of nucleotides that they recognize and the position at which they cut the sequence. Restriction enzymes are important because they allow DNA to be cut into reproducible segments that can be analyzed precisely. An important feature of many restriction enzymes is that they create sticky ends. These ends occur because the DNA is cut in a different place on the 2 strands. When the DNA molecule separates, the cut end has a small single-stranded portion that can hybridize to other fragments having compatible sequences (ie, fragments digested using the same restriction enzyme) thus allowing investigators to cut and paste pieces of DNA together.
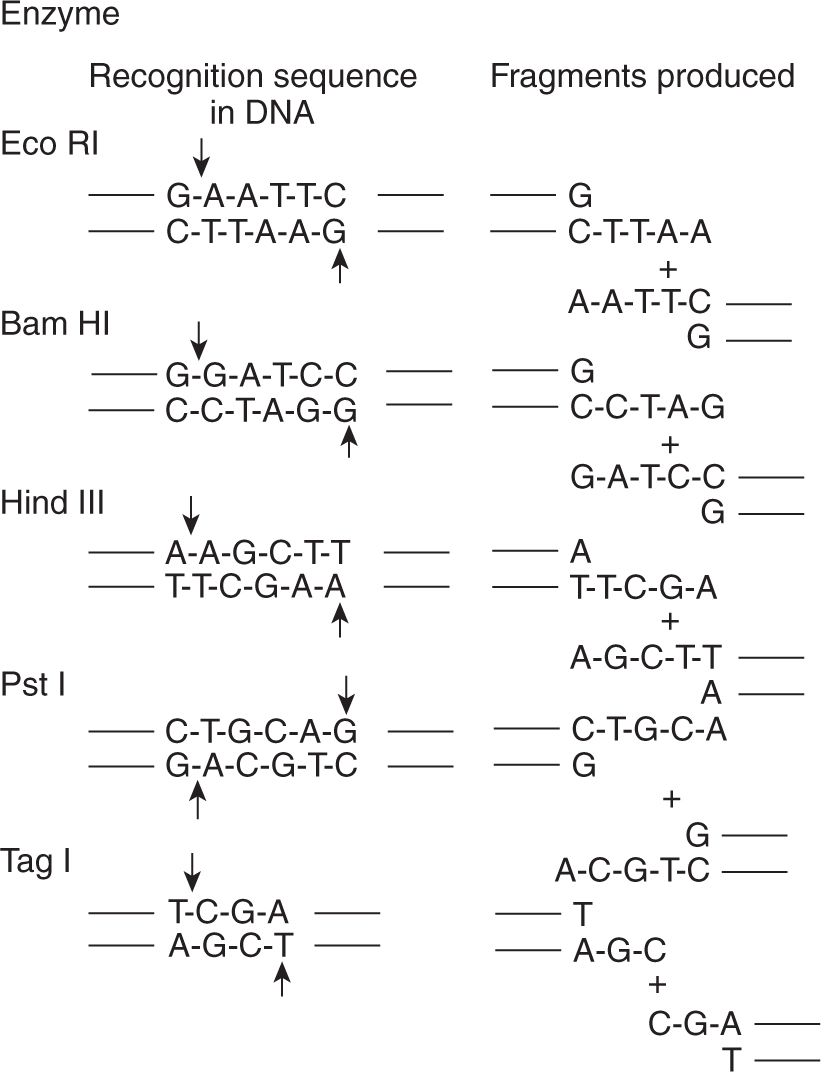
FIGURE 2–3 The nucleotide sequences recognized by 5 different restriction endonucleases are shown. On the left side, the sequence recognized by the enzyme is shown; the sites where the enzymes cut the DNA are shown by the arrows. On the right side, the 2 fragments produced following digestion with that restriction enzyme are shown. Note that each recognition sequence is a palindrome; ie, the first 2 or 3 bases are complementary to the last 2 or 3 bases. For example, for Eco R1, GAA is complementary to TTC. Also note that following digestion, each fragment has a singlestranded tail of DNA. This tail is useful in allowing fragments that contain complementary overhangs to anneal with each other.
Once a gene has been identified, the DNA segment of interest can be inserted into a bacterial virus or plasmid to facilitate its manipulation and propagation using restriction enzymes. A complementary DNA strand (cDNA) is first synthesized using mRNA as the template by a reverse transcriptase enzyme. This cDNA contains only the exons of the gene from which the mRNA was transcribed. Figure 2–4 presents a schematic of how a restriction fragment of DNA containing the coding sequence of a gene can be inserted into a bacterial plasmid conferring resistance against the drug ampicillin to the host bacterium. The plasmid or virus is referred to as a vector carrying the passenger DNA sequence of the gene of interest. The vector DNA is cut with the same restriction enzyme used to prepare the cloned gene, so that all the fragments will have compatible sticky ends and can be spliced back together. The spliced fragments can be sealed with the enzyme DNA ligase, and the reconstituted molecule can be introduced into bacterial cells. Because bacteria that take up the plasmid are resistant to the drug (eg, ampicillin), they can be isolated and propagated to large numbers. In this way, large quantities of a gene can be obtained (ie, cloned) and labeled with either radioactivity or biotin for use as a DNA probe for analysis in Southern or northern blots (see Sec. 2.2.4). Cloned DNA can be used directly for nucleotide sequencing (see Sec. 2.2.10), or for transfer into other cells. Alternatively, the starting DNA may be a complex mixture of different restriction fragments derived from human cells. Such a mixture could contain enough DNA so that the entire human genome is represented in the passenger DNA inserted into the vectors. When a large number of different DNA fragments have been inserted into a vector population and then introduced into bacteria, the result is a DNA library, which can be plated out and screened by hybridization with a specific probe. In this way an individual recombinant DNA clone can be isolated from the library and used for most of the other applications described in the following sections.
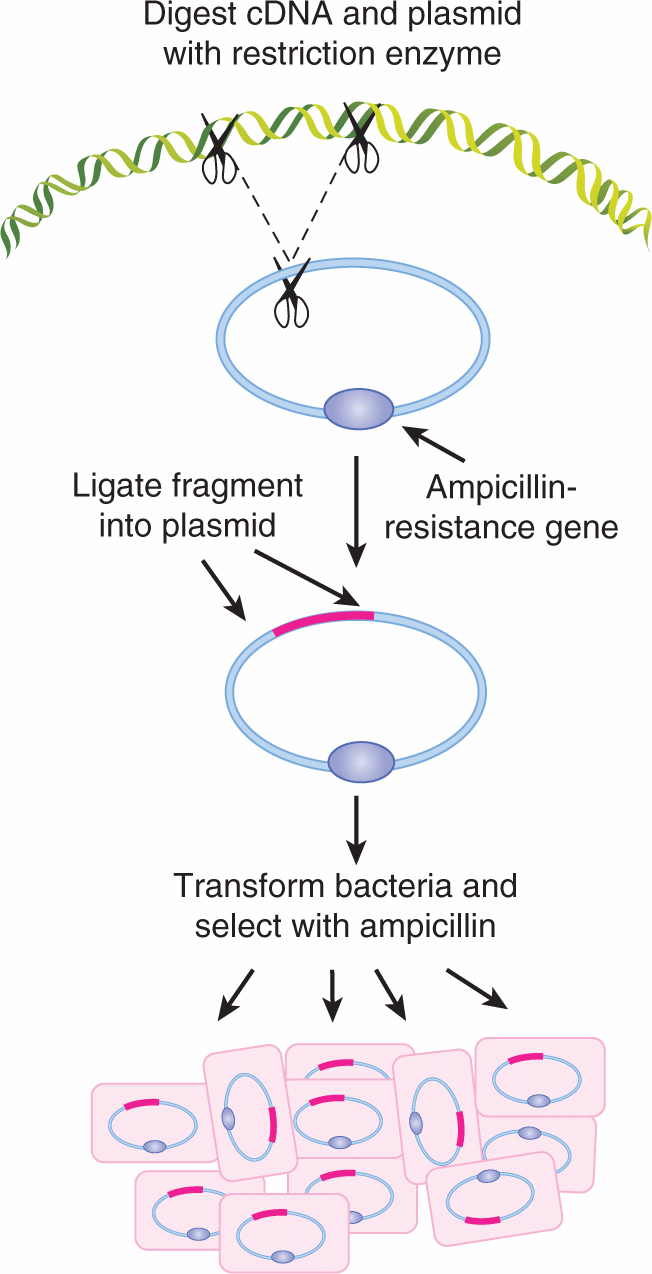
FIGURE 2–4 Insertion of a gene into a bacterial plasmid. The cDNA of interest (pink line) is digested with a restriction endonuclease (depicted by scissors) to generate a defined fragment of cDNA with “sticky ends.” The circular plasmid DNA is cut with the same restriction endonuclease to generate single-stranded ends that will hybridize and to the cDNA fragment. The recombinant DNA plasmid can be selected for growth using antibiotics because the ampicillinresistance gene (hatched) is included in the construct. In this way, large amounts of the human cDNA can be obtained for further purposes (eg, for use as a probe on a Southern blot).
2.2.4 Blotting Techniques
Southern blotting is a method for analyzing the structure of DNA (named after the scientist who developed it). Figure 2–5 outlines schematically the Southern blot technique. The DNA to be analyzed is cut into defined lengths using a restriction enzyme, and the fragments are separated by electrophoresis through an agarose gel. Under these conditions the DNA fragments are separated based on size, with the smallest fragments migrating farthest in the gel and the largest remaining near the origin. Pieces of DNA of known size are electrophoresed at the same time (in a separately loaded well) and act as a molecular mass marker. A piece of nylon membrane is then laid on top of the gel and a vacuum is applied to draw the DNA through the gel into the membrane, where it is immobilized. A common application of the Southern technique is to determine the size of the fragment of DNA that carries a particular gene. The nylon membrane containing all the fragments of DNA cut with a restriction enzyme is incubated in a solution containing a radioactive or fluorescently-labeled probe which is complementary to part of the gene (see Sec. 2.2.2). Under these conditions, the probe will anneal with homologous DNA sequences present on the DNA in the membrane. After gentle washing to remove the single-stranded, unbound probe, the only labeled probe remaining on the membrane will be bound to homologous sequences of the gene of interest. The location of the gene on the nylon membrane can then be detected either by the fluorescence or radioactivity associated with the probe. An almost identical procedure can be used to characterize mRNA separated by electrophoresis and transferred to a nylon membrane. The technique is called northern blotting and is used to evaluate the expression patterns of genes. An analogous procedure, called western blotting, is used to characterize proteins. Following separation by denaturing gel electrophoresis, the proteins are immobilized by transfer to a charged synthetic membrane. To identify specific proteins, the membrane is incubated in a solution containing a specific primary antibody either directly labeled with a fluorophore, or incubated with a secondary antibody that will bind to the primary antibody and is conjugated to horseradish peroxidase (HRP) or biotin. The primary antibody will bind only to the region of the membrane containing the protein of interest and can be detected either directly by its fluorescence or by exposure to chemoluminescence detection reagents.
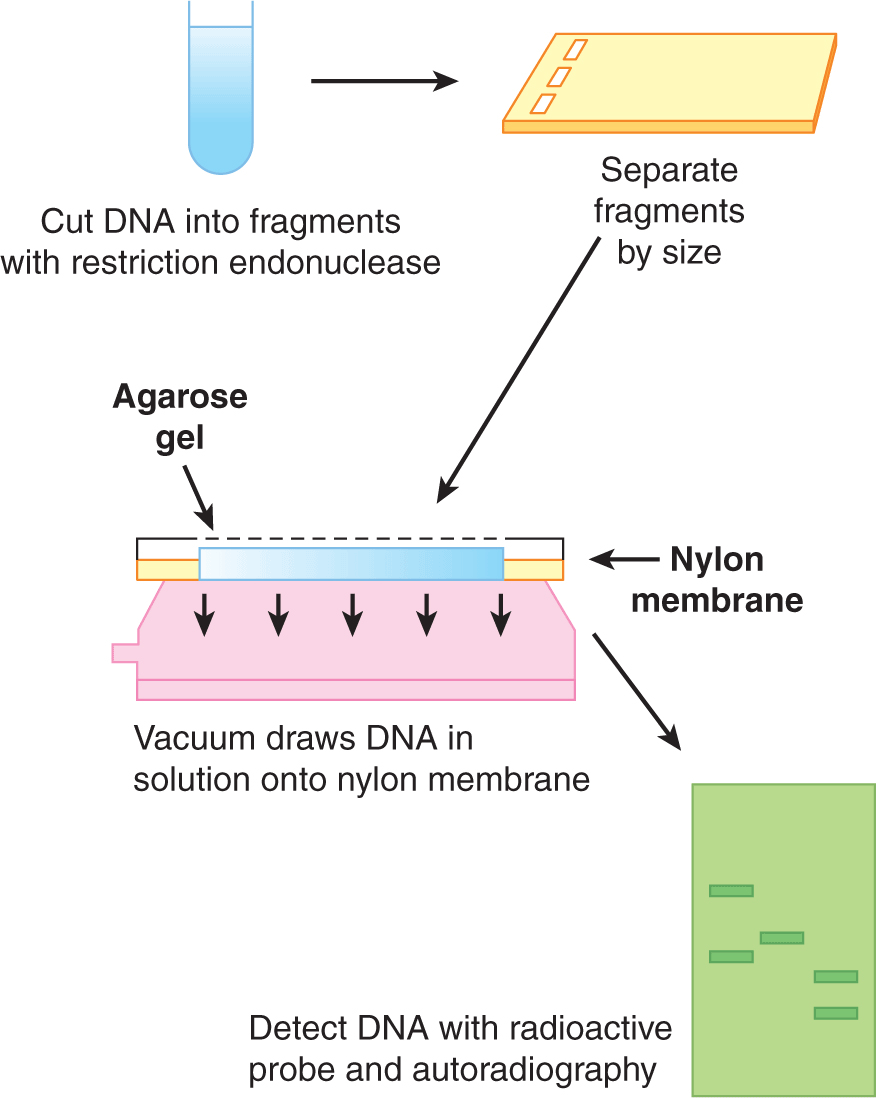
FIGURE 2–5 Analysis of DNA by Southern blotting. Schematic outline of the procedures involved in analyzing DNA fragments by the Southern blotting technique. The method is described in more detail in the text.
2.2.5 The Polymerase Chain Reaction
The polymerase chain reaction (PCR) allows rapid production of large quantities of specific pieces of DNA (usually about 200 to 1000 base pairs) using a DNA polymerase enzyme called Taq polymerase (which is isolated from a thermophilic bacterial species and is thus resistant to denaturation at high temperatures). Specific oligonucleotide primers complementary to the DNA at each end of (flanking) the region of interest are synthesized or obtained commercially, and are used as primers for Taq polymerase. All components of the reaction (the target DNA, primers, deoxynucleotides, and Taq polymerase) are placed in a small tube and the reaction sequence is accomplished by simply changing the temperature of the reaction mixture in a cyclical manner (Fig. 2–6A). A typical PCR reaction would involve: (a) Incubation at 94°C to denature (separate) the DNA duplex and create single-stranded DNA. (b) Incubation at 53°C to allow hybridization of the primers, which are in vast excess (this temperature may vary depending on the sequence of the primers). (c) Incubation at 72°C to allow Taq polymerase to synthesize new DNA from the primers. Repeating this cycle permits another round of amplification (Fig. 2–6B). Each cycle takes only a few minutes. Twenty cycles can theoretically produce a million-fold amplification of the DNA of interest. PCR products can then be sequenced or subjected to other methods of genetic analysis. Polymerase proteins with greater heat stability and copying fidelity can allow for longrange amplification using primers separated by as much as 15 to 30 kilobases of intervening target DNA (Ausubel and Waggoner, 2003). The PCR is exquisitely sensitive and its applications include the detection of minimal residual disease in hematopoietic malignancies and of circulating cancer cells from solid tumors.
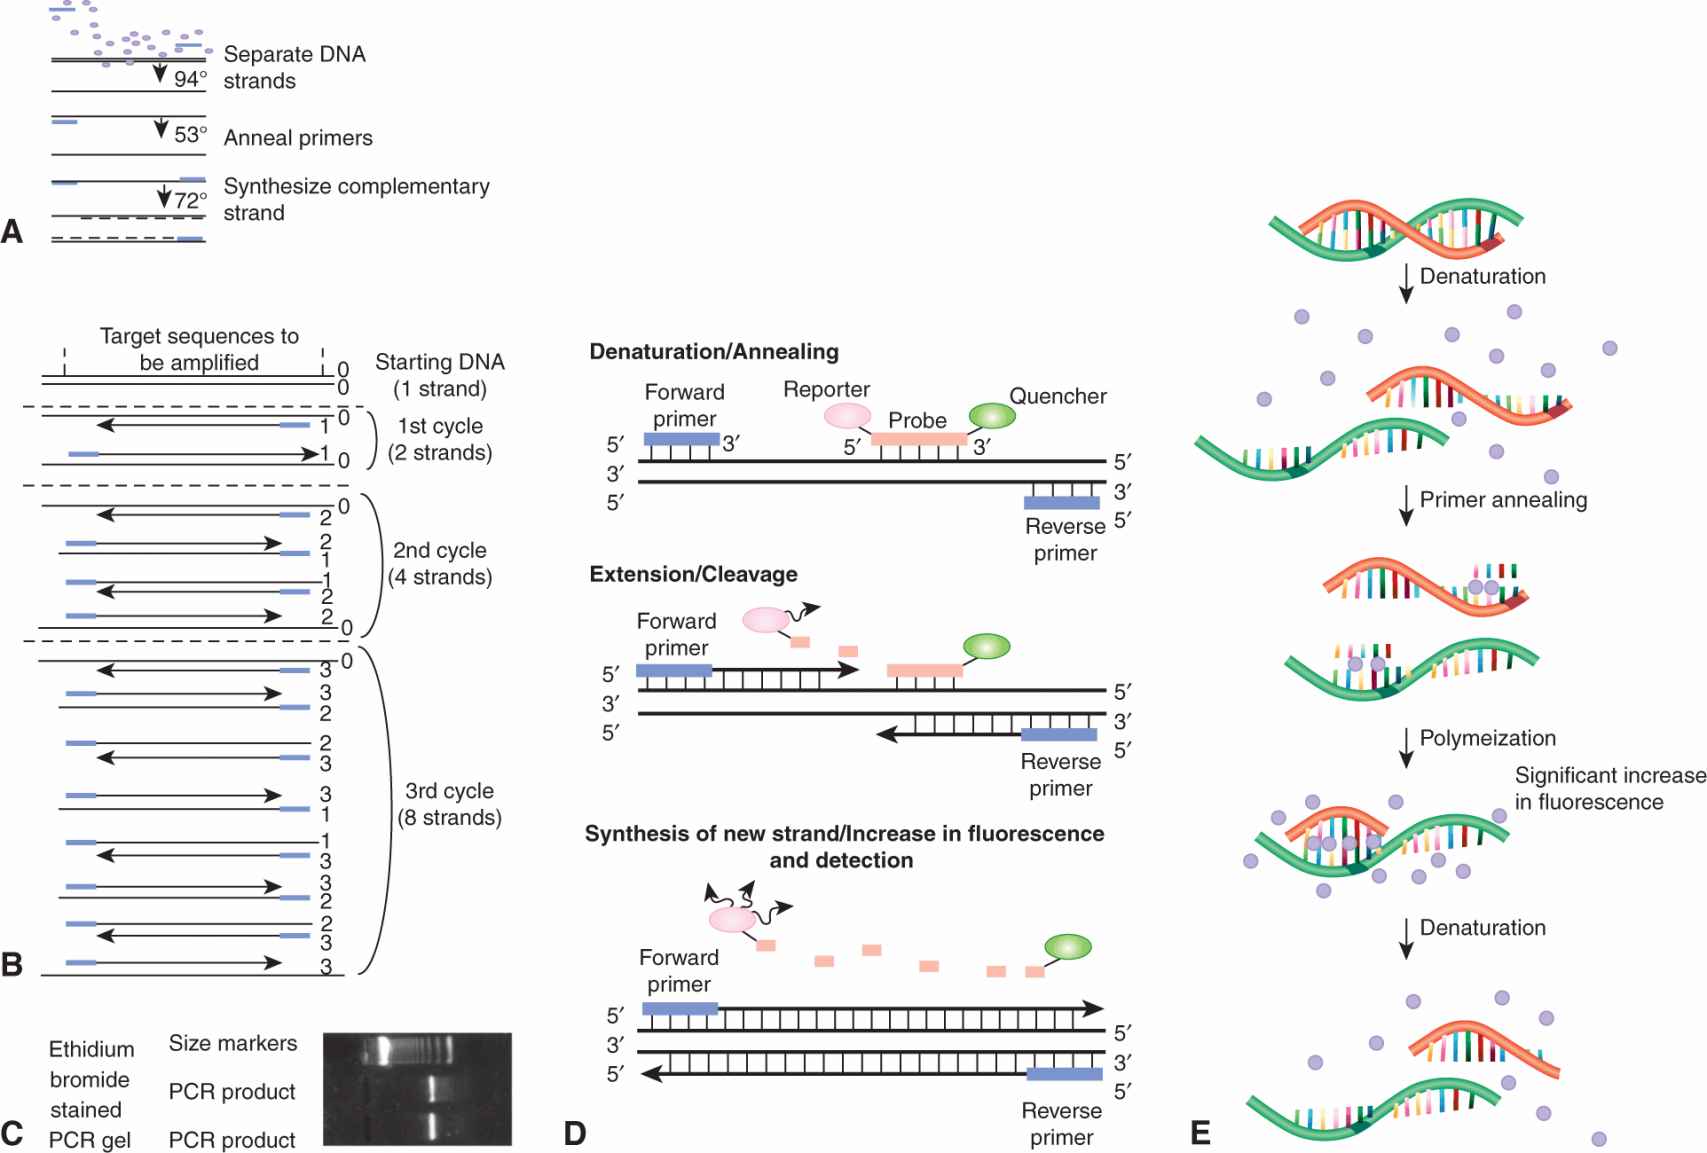
FIGURE 2–6 Reaction sequence for 1 cycle of PCR. Each line represents 1 strand of DNA; the small rectangles are primers and the circles are nucleotides. B) The first 3 cycles of PCR are shown schematically. C) Ethidium bromide-stained gel after 20 cycles of PCR. See text for further explanation. D) Real-time PCR using SYBR Green dye. SYBR Green dye binds preferentially to double-stranded DNA; therefore, an increase in the concentration of a double-stranded DNA product leads to an increase in fluorescence. During the polymerization step, several molecules of the dye bind to the newly synthesized DNA and a significant increase in fluorescence is detected and can be monitored in real time. E) Realtime PCR using fluorescent dyes and molecular beacons. During denaturation, both probe and primers are in solution and remain unbound from the DNA strand. During annealing, the probe specifically hybridizes to the target DNA between the primers (top panel) and the 5′-to-3′ exonuclease activity of the DNA polymerase cleaves the probe, thus dissociating the quencher molecule from the reporter molecule, which results in fluorescence of the reporters.
PCR is widely used to study gene expression or screen for mutations in RNA. Reverse transcriptase is used to make a single-strand cDNA copy of an mRNA and the cDNA is used as a template for a PCR reaction as described above. This technique allows amplification of cDNA corresponding to both abundant and rare RNA transcripts. The development of realtime quantitative PCR has allowed improved quantitation of the DNA (or cDNA) template and has proven to be a sensitive method to detect low levels of mRNA (often obtained from small samples or microdissected tissues) and to quantify gene expression. Different chemistries are available for real time detection (Fig. 2–6C, D). There is a very specific 5′ nuclease assay, which uses a fluorogenic probe for the detection of reaction products after amplification, and there is a less specific but much less expensive assay, which uses a fluorescent dye (SYBR Green I) for the detection of double-stranded DNA products. In both methods, the fluorescence emission from each sample is collected by a charge-coupled device camera and the data are automatically processed and analyzed by computer software. Quantitative real-time PCR using fluorogenic probes can analyze multiple genes simultaneously within the same reaction. The SYBR Green methodology involves individual analysis of each gene of interest but, using multiwell plates, both approaches provide high-throughput sample analysis with no need for post-PCR processing or gels.
2.2.6 Fluorescence in Situ Hybridization
To perform fluorescence in situ hybridization (FISH), DNA probes specific for a gene or particular chromosome region are labeled (usually by incorporation of biotin, digoxigenin, or directly with a fluorochrome) and then hybridized to (denatured) metaphase chromosomes. The DNA probe will reanneal to the denatured DNA at its precise location on the chromosome. After washing away the unbound probe, the hybridized sequences are detected using avidin directly (which binds strongly to biotin), or antibodies to digoxigenin that are coupled to fluorescent secondary antibodies, such as fluorescein isothiocyanate. The sites of hybridization are then detected using fluorescent microscopy. The main advantage of FISH for gene analyses is that information is obtained directly about the positions of the probes in relation to chromosome bands or to other previously or simultaneously mapped reference probes.
FISH can be performed on interphase nuclei from paraffin-embedded tumor biopsies or cultured tumor cells, which allows cytogenetic aberrations such as amplifications, deletions or other abnormalities of whole chromosomes to be visualized without the need for obtaining good-quality metaphase preparations. For example, FISH is a standard technique to determine the HER2 status of breast cancers and can be used to detect N-myc amplification in neuroblastoma (Fig. 2–7). Whole chromosome abnormalities can also be detected using specific centromere probes that lead to 2 signals from normal nuclei, 1 signal when there is only 1 copy of the chromosome (monosomy), or 3 signals when there is an extra copy (trisomy). Chromosome or gene deletions can also be detected with probes from the relevant regions. For example, if the probes used for FISH are close to specific translocation break points on different chromosomes, they will appear joined as a result of the translocation generating a “color fusion” signal or conversely, alternative probes can be designed to “break apart” in the event of a specific gene deletion or translocation. This technique is particularly useful for the detection of the bcr-abl rearrangement in chronic myeloid leukemia (Fig. 2–8) and the tmprss2-erg abnormalities in prostate cancer (Fig. 2–9).
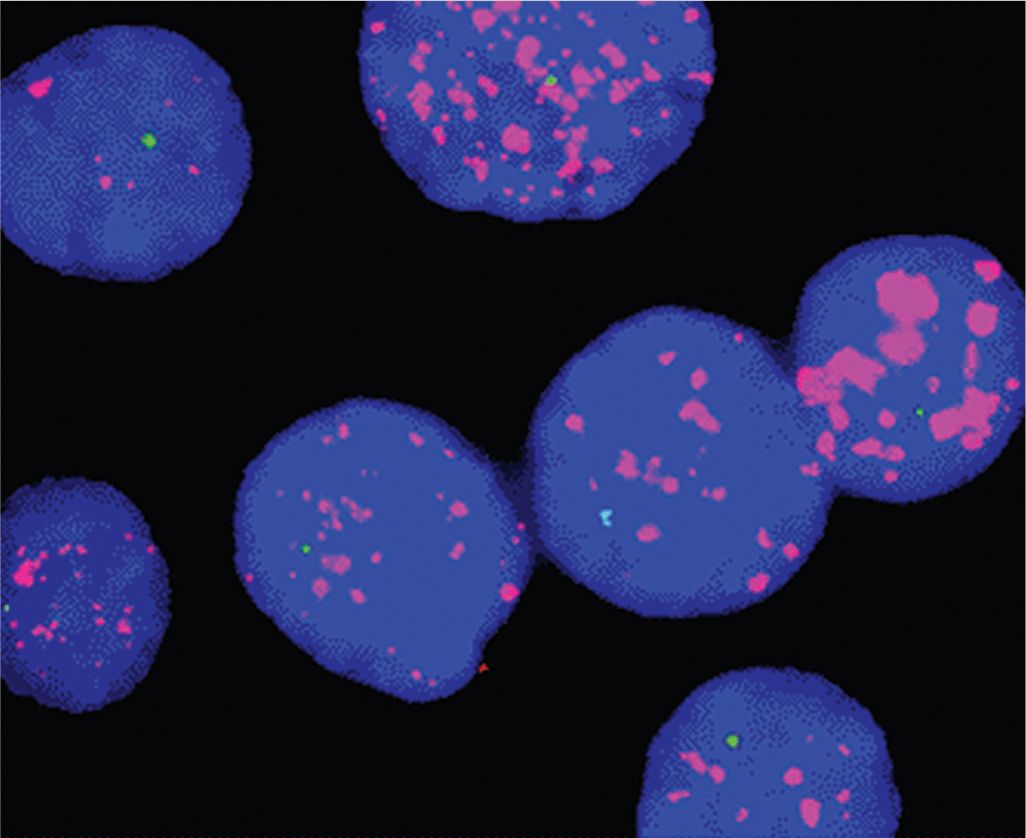
FIGURE 2–7 MYCN amplification in nuclei from neuroblastoma detected by FISH with a MYCN probe (magenta speckling) and a deletion of the short arm of chromosome 1. The signal (pale bluegreen) from the remaining chromosome 1 is seen as a single spot in each nucleus.
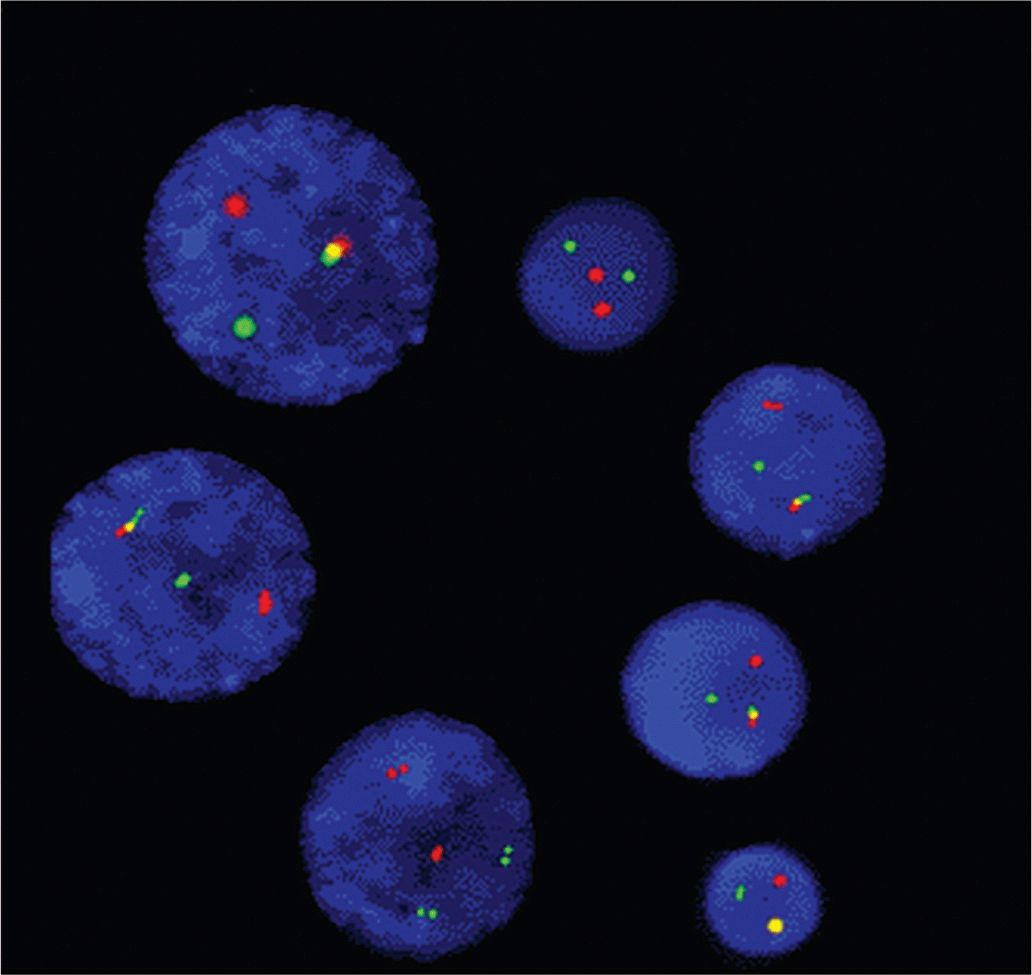
FIGURE 2–8 Detection of the Philadelphia chromosome in interphase nuclei of leukemia cells. All nuclei contain 1 green signal (BCR gene), 1 pink signal (ABL gene), and an intermediate fusion yellow signal because of the 9:22 chromosome translocation.
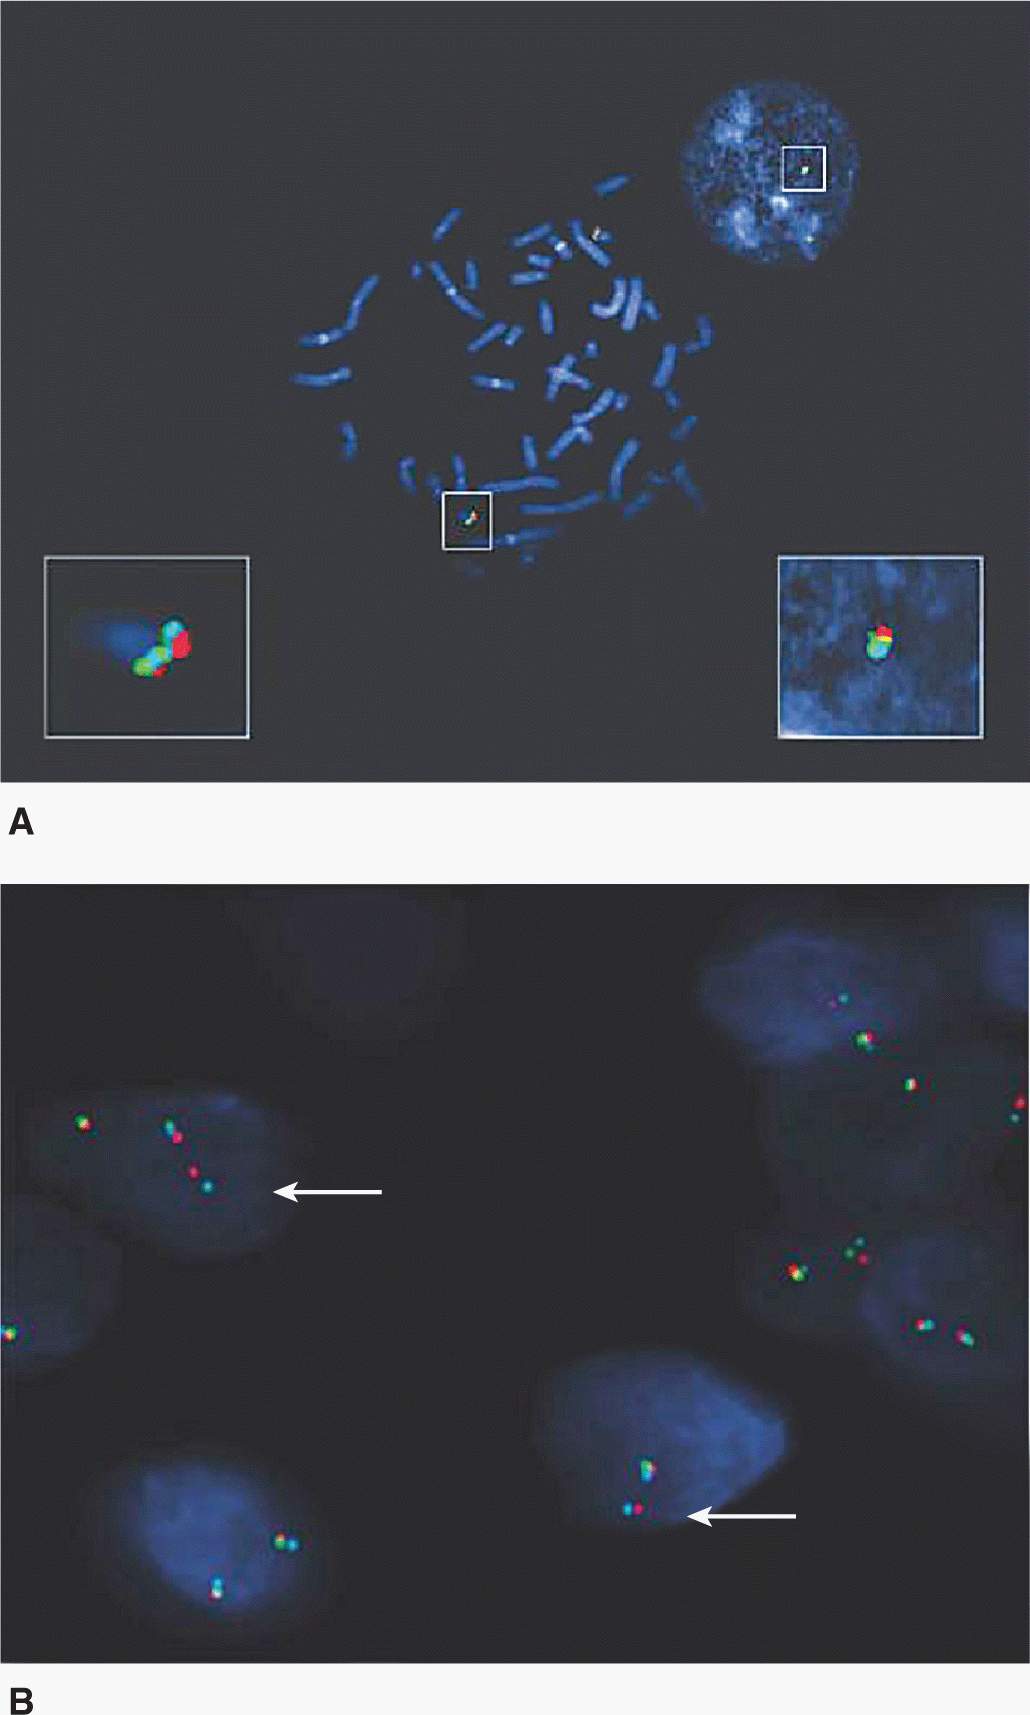
FIGURE 2–9 FISH analysis showing rearrangement of TMPRSS2 and ERG genes in PCa. A) FISH confirms the colocalization of Oregon Green-labeled 5 V ERG (green signals), AlexaFluor 594-labeled 3 V ERG (red signals), and Pacific Blue-labeled TMPRSS2 (light blue signals) in normal peripheral lymphocyte metaphase cells and in normal interphase cells. B) In PCa cells, break-apart FISH results in a split of the colocalized 5 V green/3 V red signals, in addition to a fused signal (comprising green, red, and blue signals) of the unaffected chromosome 21. Using the TMPRSS2/ERG set of probes on PCa frozen sections, TMPRSS2 (blue signal) remains juxtaposed to ERG 3 V (red signal; see white arrows), whereas colocalized 5 V ERG signal (green) is lost, indicating the presence of TMPRSS2/ERG fusion and concomitant deletion of 5 V ERG region. (Reproduced with permission from Yoshimoto et al, 2006.)
2.2.7 Comparative Genomic Hybridization
If the cytogenetic abnormalities are unknown, it is not possible to select a suitable probe to clarify the abnormalities by FISH. Comparative genomic hybridization (CGH) has been developed to produce a detailed map of the differences between chromosomes in different cells by detecting increases (amplifications) or decreases (deletions) of segments of DNA.
For analysis of tumors by CGH, the DNA from malignant and normal cells is labeled with 2 different fluorochromes and then hybridized simultaneously to normal chromosome metaphase spreads. For example, tumor DNA is labeled with biotin and detected with fluorescein (green fluorescence) while the control DNA is labeled with digoxigenin and detected with rhodamine (red fluorescence). Regions of gain or loss of DNA, such as deletions, duplications, or amplifications, are seen as changes in the ratio of the intensities of the 2 fluorochromes along the target chromosomes. One disadvantage of CGH is that it can detect only large blocks (>5 Mb) of over- or underrepresented chromosomal DNA and balanced rearrangements (such as inversions or translocations) can escape detection. Improvements to the original CGH technique have used microarrays where CGH is applied to arrayed sequences of DNA bound to glass slides. The arrays are constructed using genomic clones of various types such as bacterial artificial chromosomes (a DNA construct that can be used to carry 150 to 350 kbp [kilobase pairs] of normal DNA) or synthetic oligonucleotides that are spaced across the entire genome. This technique has allowed the detection of genetic aberrations of smaller magnitude than was possible using metaphase chromosomes, although they have now been superseded by high density single-nucleotide polymorphism (SNP) arrays (see below).
2.2.8 Spectral Karyotyping/Multifluor Fluorescence in Situ Hybridization
A deficiency of both array CGH and conventional cDNA microarrays is the lack of information about structural changes within the karyotype. For example, with an expression array, a particular gene may be overexpressed but it would be unclear whether this is secondary to a translocation placing the gene next to a strong promoter or an amplification. Universal chromosome painting techniques have been developed to assist in this determination with which it is possible to analyze all chromosomes simultaneously. Two commonly used techniques, spectral karyotyping (SKY) (Veldman et al, 1997) and multifluor fluorescence in situ hybridization (M-FISH) (Speicher et al, 1996), are based on the differential display of colored fluorescent chromosome-specific paints, which provide a complete analysis of the chromosomal complement in a given cell. Using this combination of 23 different colored paints as a “cocktail probe,” subtle differences in fluorochrome labeling of chromosomes after hybridization allows a computer to assign a unique color to each chromosome pair. Abnormal chromosomes can be identified by the pattern of color distribution along them with chromosomal rearrangements leading to a distinct transition from one color to another at the position of the breakpoint (Fig. 2–10). In contrast to CGH, detection of such karyotype rearrangements using SKY and M-FISH is not dependent upon change in copy number. This technology is particularly suited to solid tumors where the complexity of the karyotypes may mask the presence of chromosomal aberrations.
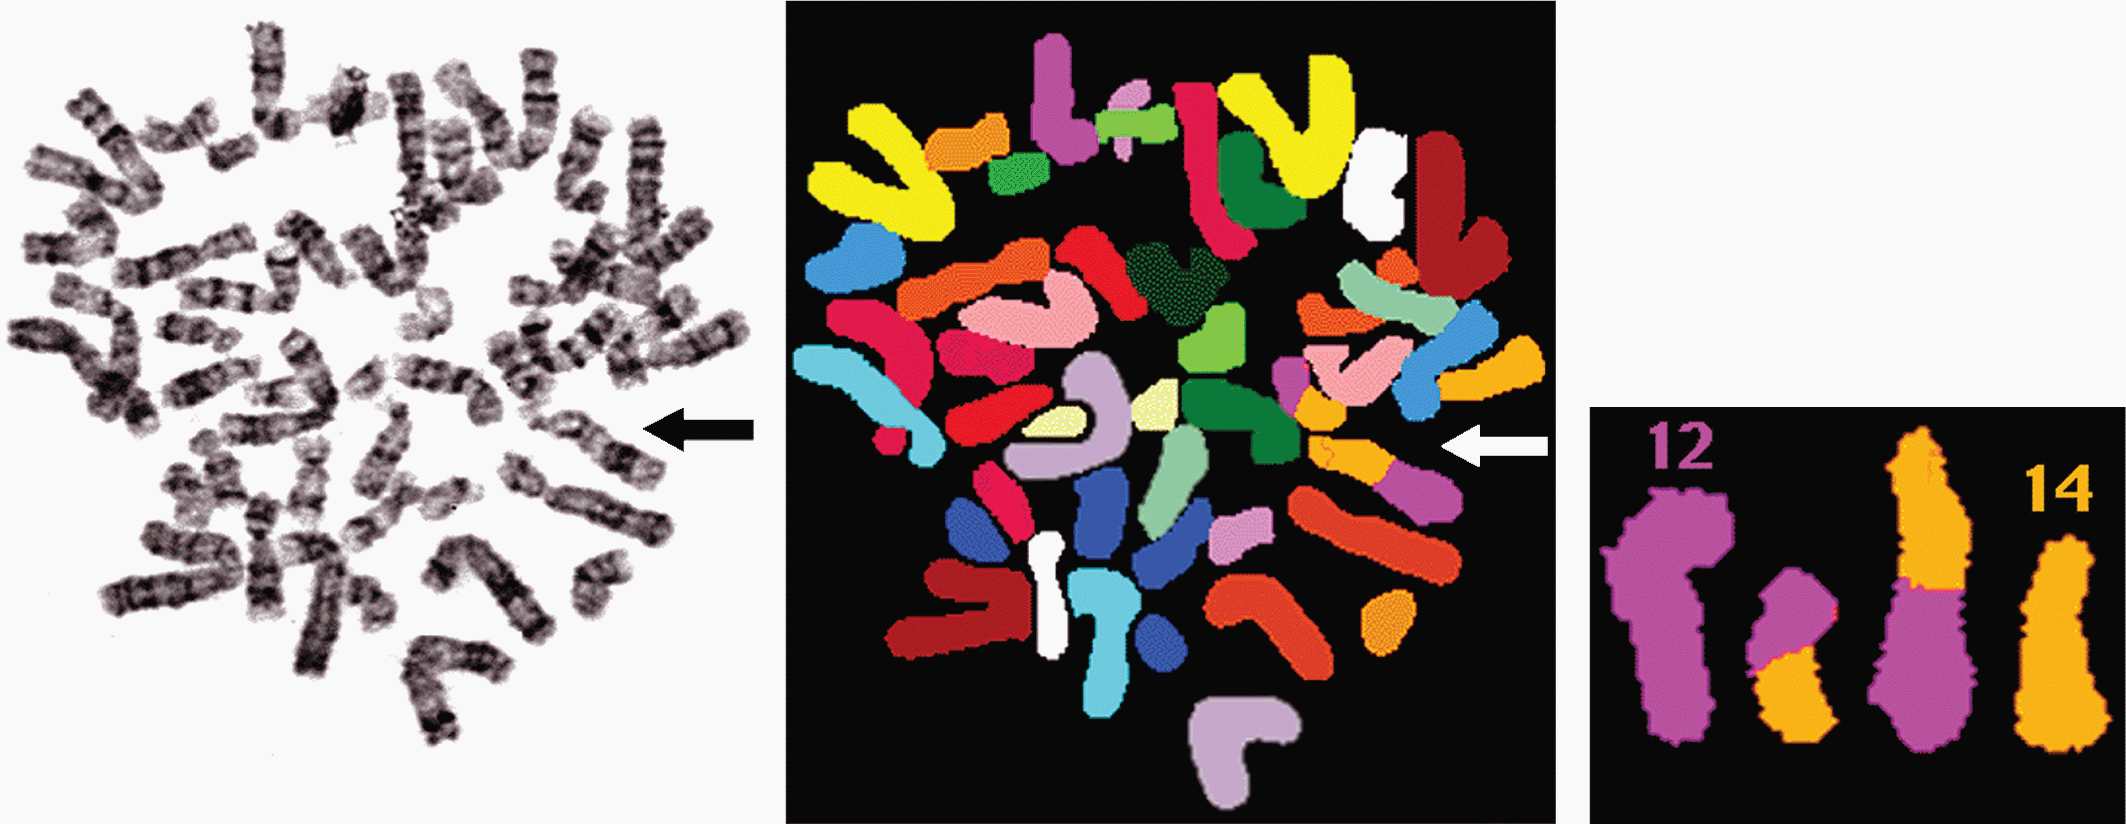
FIGURE 2–10 SKY and downstream analyses of a patient with a translocation. One of the aberrant chromosomes can initially be seen with G banding, the same metaphase spread has been subjected to SKY and then a 12;14 reciprocal translocation is identified.
2.2.9 Single-Nucleotide Polymorphisms
DNA sequences can differ at single nucleotide positions within the genome. These SNPs can occur as frequently as 1 in every 1000 base pairs and can occur in both introns and exons. In introns they generally have little effect, but in exons they can affect protein structure and function. For example, SNPs may be involved in altered drug metabolism because of their modifying effect on the cytochrome P450 metabolizing enzymes. They also contribute to disease (eg, SNPs that result in missense mutations) and disease predisposition. Most early methods to characterize SNPs required PCR amplification of the sample to be genotyped prior to sequence analysis; modern methods of gene sequencing and array analyses, however, have largely replaced this older technique. One application of SNPs in cancer medicine has been the use of SNP arrays in genomic analyses. These DNA microarrays, use tiled SNP probes to some of the 50 million SNPs in the human genome to interrogate genomic architecture. For example, SNP arrays can be used to study such phenomena as loss of heterozygosity (LOH) and amplifications. Indeed, the particular advantage of SNP arrays is that they can detect copy-neutral LOH (also known as uniparental disomy or gene conversion) whereby one allele or whole chromosome is missing and the other allele is duplicated with potential pathological consequences.
2.2.10 Sequencing of DNA
To characterize the primary structure of genes, and thus of the potential repertoire of proteins that they encode, it is necessary to determine the sequence of their DNA. Sanger sequencing (the classical method) relied on oligonucleotide primer extension and dideoxy-chain termination (dideoxy-nucleotides (ddNTPs) lack the 3′-OH group required for the phosphodiester bond between 2 nucleosides). DNA sequencing was carried out in 4 separate reactions each containing 1 of the 4 ddNTPs (ie, ddATP, ddCTP, ddGTP, or ddTTP) together with ddNTPs. In each reaction, the same primer was used to ensure DNA synthesis began at the same nucleotide. The extended primers therefore terminated at different sites whenever a specific ddNTP was incorporated. This method produced fragments of different sizes terminating at different 3′ nucleotides. The newly synthesized and labeled DNA fragments were heat-denatured, and then separated by size with gel electrophoresis and with each of the 4 reactions in individual adjacent lanes (lanes A, T, G, C); the DNA bands were then visualized by autoradiography or UV light, and the DNA sequence could be directly interpreted from the x-ray film or gel image (Fig. 2–11). Using this method it was possible to obtain a sequence of 200 to 500 bases in length from a single gel. The next development was automated Sanger sequencing which involved the development of fluorescently labeled-primers (dye primers) and –ddNTPs (dye terminators). With the automated procedures the reactions are performed in a single tube containing all 4 ddNTPs, each labeled with a different fluorescent dye. Since the four dyes fluoresce at different wavelengths, a laser then reads the gel to determine the identity of each band according to the wavelengths at which it fluoresces. The results are then depicted in the form of a chromatogram, which is a diagram of colored peaks that correspond to the nucleotide in that location in the sequence. Then sequencing analysis software interprets the results, identifying the bases from the fluorescent intensities (Fig. 2–12).
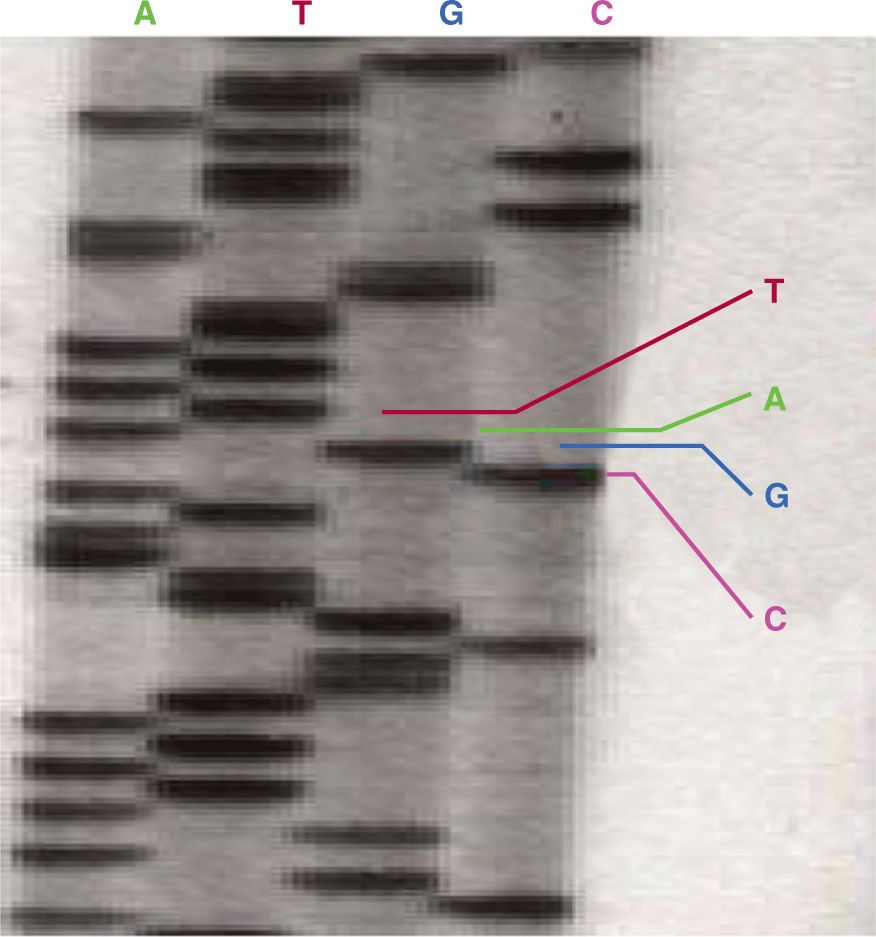
FIGURE 2–11 Dideoxy-chain termination sequencing showing an extension reaction to read the position of the nucleotide guanidine (see text for details). (Courtesy of Lilly Noble, University of Toronto, Toronto.)
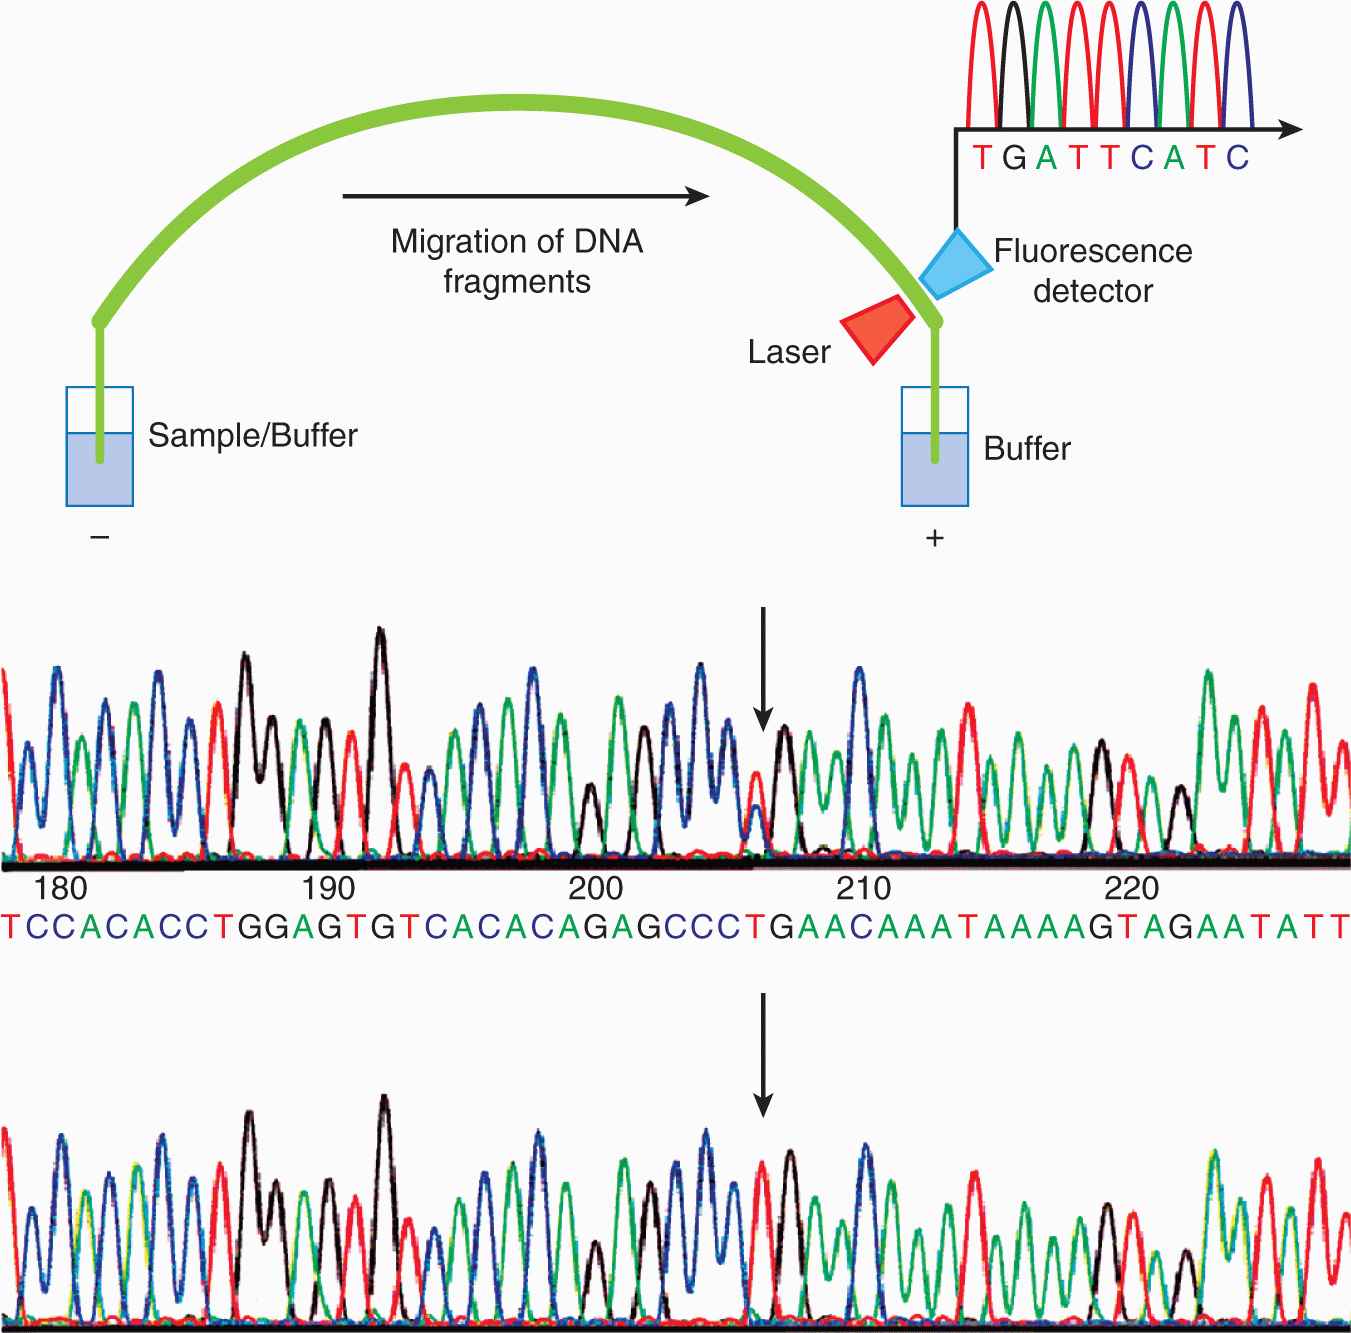
FIGURE 2–12 Outline of automated sequencing and thereafter automated sequencing of BRCA2, the hereditary breast cancer predisposition gene. Each colored peak represents a different nucleotide. The lower panel is the sequence of the wild-type DNA sample. The sequence of the mutation carrier in the upper panel contains a double peak (indicated by an arrow) in which nucleotide T in intron 17 located 2 bp downstream of the 5′ end of exon 18 is converted to a C. The mutation results in aberrant splicing of exon 18 of the BRCA2 gene. The presence of the T nucleotide, in addition to the mutant C, implies that only 1 copy of the 2 BRCA2 genes is mutated in this sample.
So-called next-generation sequencing (NGS) uses a variety of approaches to automate the sequencing process by creating micro-PCR reactors and/or attaching the DNA molecules to be sequenced to solid surfaces or beads, allowing for millions of sequencing events to occur simultaneously. Although the analyzed sequences are generally much shorter (~21 to ~400 base pairs) than in previous sequencing technologies, they can be counted and quantified, allowing for the identification of mutations in a small subpopulation of cells which is part of a larger population with wild-type sequences. The recent introduction of approaches that allow for sequencing of both ends of a DNA molecule (ie, paired end massively parallel sequencing or mate-pair sequencing), make it possible to detect balanced and unbalanced somatic rearrangements (eg, fusion genes) in a genome-wide fashion.
There are several types of NGS machines in routine use that fall into 4 methodological categories; (a) Roche/454, Life/APG, (b) Illumina/Solexa, (c) Ion Torrent, and (d) Pacific Biosciences. It is beyond the scope of this chapter to describe these in detail or to foreshadow developing technologies, but an overview of the key differences is provided below.
Each technology includes a number of steps grouped as (a) template preparation, (b) sequencing/imaging, and (c) data analysis. Initially, all methods involve randomly breaking genomic DNA into small sizes from which either fragment templates (randomly sheared DNA usually <1 kbp in size) or mate-pair templates (linear DNA fragments originating from circularized sheared DNA of a particular size) are created.
There are 2 types of template preparation: clonally amplified templates and single-molecule templates. Clonally amplified templates rely on PCR techniques to amplify the DNA so that fluorescence is detectable when fluorescently labeled nucleotides are added. Emulsion PCR (Fig. 2–13) is used to prepare a library of fragment or mate-pair targets and then adaptors (short DNA segments) containing universal priming sites are ligated to the target ends, allowing complex genomes to be amplified with common PCR primers. After ligation, the DNA is separated into single strands and captured onto beads under conditions that favor 1 DNA molecule per bead. After the successful amplification of DNA, millions of molecules can be chemically cross-linked to an amino-coated glass surface (Life/APG; Ion Torrent) or deposited into individual PicoTiterPlate (PTP) wells (Roche/454). Solid-phase amplification (Fig. 2–14) used in the Illumina/Solexa platform produces randomly distributed, clonally amplified clusters from fragment or mate-pair templates on a glass slide. High-density forward and reverse primers are covalently attached to the slide and the DNA segments of interest and the ratio of the primers to the template on the support define the surface density of the amplified clusters. These primers can also provide free ends to which a universal primer can be hybridized to initiate the NGS reaction.

FIGURE 2–13 In emulsion PCR (emPCR), a reaction mixture is generated compromising an oil–aqueous emulsion to encapsulate bead–DNA complexes into single aqueous droplets. PCR amplification is subsequently carried out in these droplets to create beads containing thousands of copies of the same template sequence. EmPCR beads can then be chemically attached to a glass slide or a reaction plate. (From Metzker, 2010.)
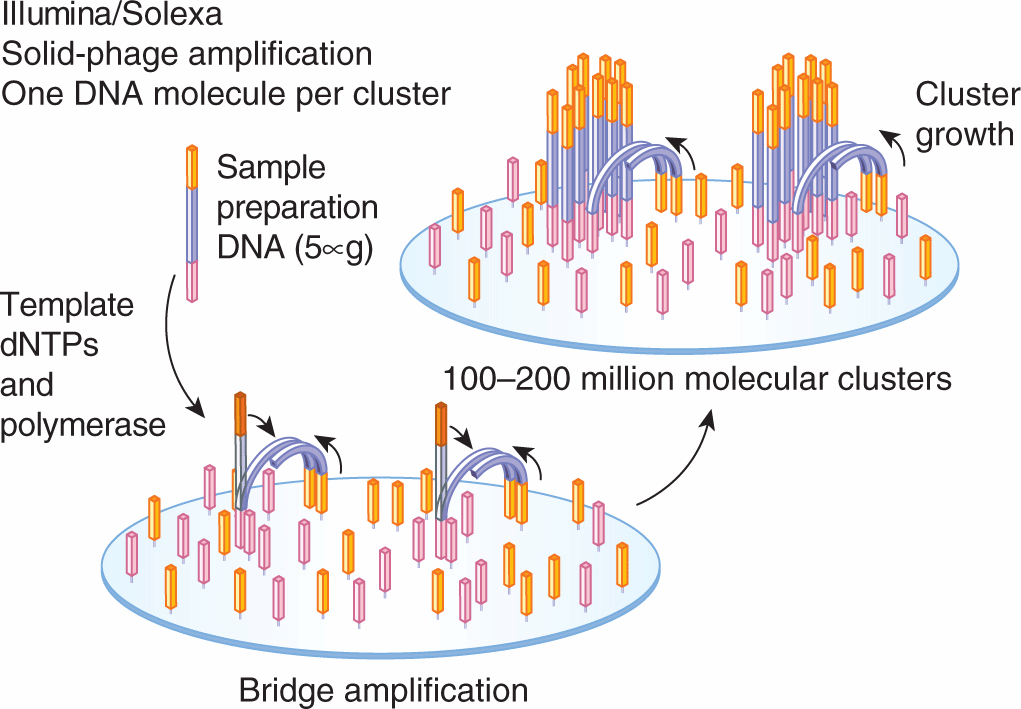
FIGURE 2–14 The 2 basic steps of solid-phase amplification are initial priming and extending of the single-stranded, single-molecule template, and then bridge amplification of the immobilized template with immediately adjacent primers to form clusters. (From Metzker, 2010.)
In general, the preparation of single-molecule templates is more straightforward and requires less starting material (<1 μg) than emulsion PCR or solid-phase amplification. More importantly, these methods do not require PCR, which may create mutations and bias in amplified templates and regions. A variant of this (Pacific Biosciences; see below) uses spatially distributed single-polymerase molecules that are attached to a solid support that analyze circularized sheared DNA selected for a given size, such as 2 kbp, to which primed template molecules are bound.
Cyclic reversible termination (CRT) is currently used in the Illumina/Solexa platform. CRT uses reversible terminators in a cyclic method that comprises nucleotide incorporation, fluorescence imaging and cleavage. In the first step, a DNA polymerase, bound to the primed template, adds or incorporates only 1 fluorescently modified nucleotide, complementary to the template base. DNA synthesis is then terminated. Following incorporation, the remaining unincorporated nucleotides are washed away. Imaging is then performed to identify the incorporated nucleotide. This is followed by a cleavage step, which removes the terminating/inhibiting group and the fluorescent dye. Additional washing is performed before starting another incorporation step.
Another cyclic method is single-base ligation (SBL) used in the Life/APG platform, which uses a DNA ligase and either 1-or 2-base-encoded probes. In its simplest form, a fluorescently labeled probe hybridizes to its complementary sequence adjacent to the primed template. DNA ligase is then added which joins the dye-labeled probe to the primer. Nonligated probes are washed away, followed by fluorescence imaging to determine the identity of the ligated probe. The cycle can be repeated either by (a) using cleavable probes to remove the fluorescent dye and regenerate a 5′-PO4 group for subsequent ligation cycles or (b) by removing and hybridizing a new primer to the template.
Pyrosequencing (used in the Roche/454 platform) (Fig. 2–15) is a bioluminescence method that measures the incorporation of nucleotides by the release of inorganic pyrophosphate by proportionally converting it into visible light using serial enzymatic reactions. Following loading of the DNA-amplified beads into individual PTP wells, additional smaller beads, which are coupled with sulphurylase and luciferase are added. Nucleotides are then flowed sequentially in a fixed order across the PTP device. If a nucleotide complementary to the template strand appears, the polymerase extends the existing DNA strand by adding nucleotide(s). Addition of 1 (or more) nucleotide(s) results in a reaction that generates a light signal that is recorded. The signal strength is proportional to the number of nucleotides incorporated in a single nucleotide flow. The order and intensity of the light peaks are recorded to reveal the underlying DNA sequence.
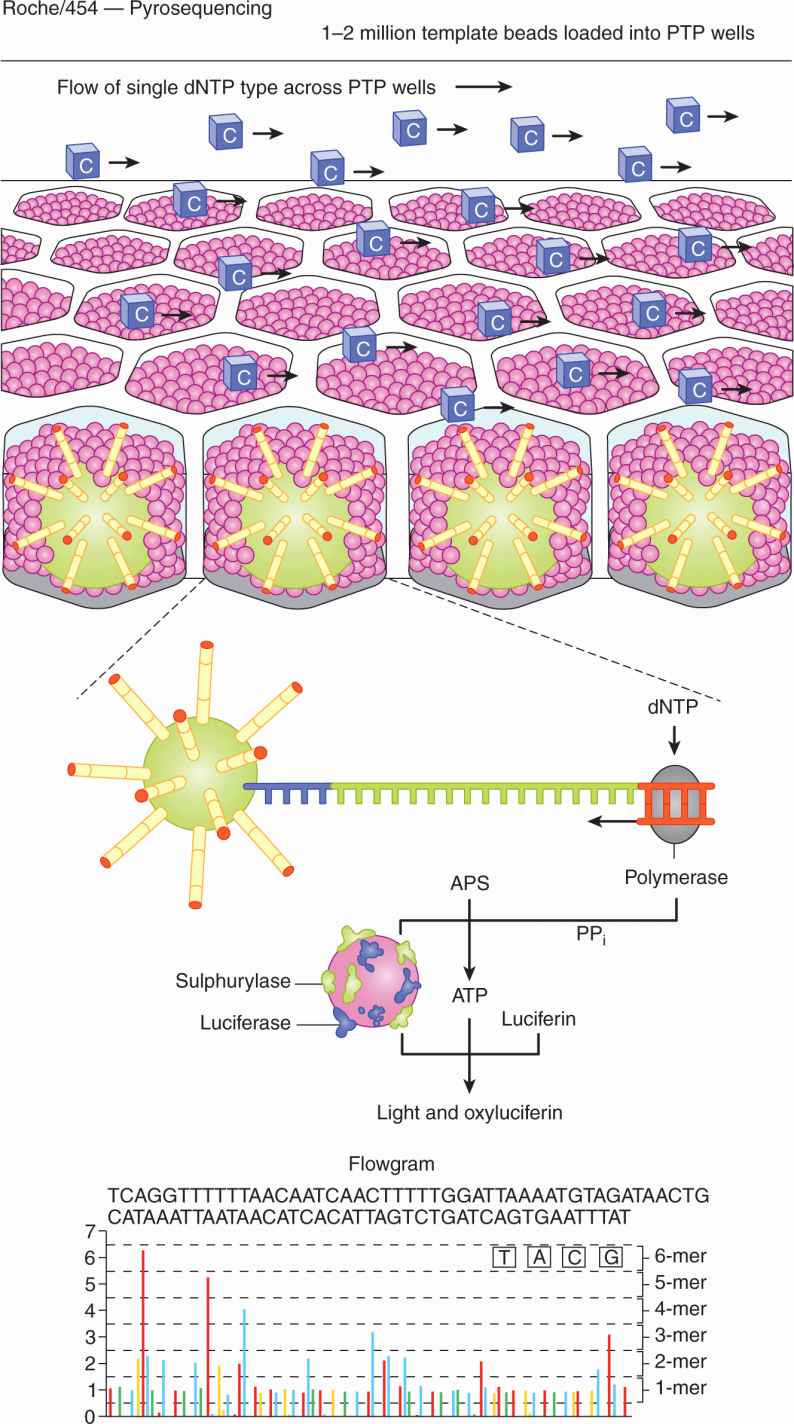
FIGURE 2–15 Pyrosequencing. After loading of the DNA-amplified beads into individual PicoTiterPlate (PTP) wells, additional beads, coupled with sulphurylase and luciferase, are added. The fiberoptic slide is mounted in a flow chamber, enabling the delivery of sequencing reagents to the beadpacked wells. The underneath of the fiberoptic slide is directly attached to a high-resolution camera, which allows detection of the light generated from each PTP well undergoing the pyrosequencing reaction. The light generated by the enzymatic cascade is recorded and is known as a flow gram. PP, Inorganic pyrophosphate. (From Metzker, 2010.)
The method of real-time sequencing (as used in the Pacific Biosciences platform, Fig. 2–16) involves imaging the continuous incorporation of dye-labeled nucleotides during DNA synthesis by attaching single DNA polymerase molecules to the bottom surface of individual wells known as “zero-mode waveguide detectors” that can detect the light from the fluorescent nucleotides as they are incorporated into the elongating primer strand.
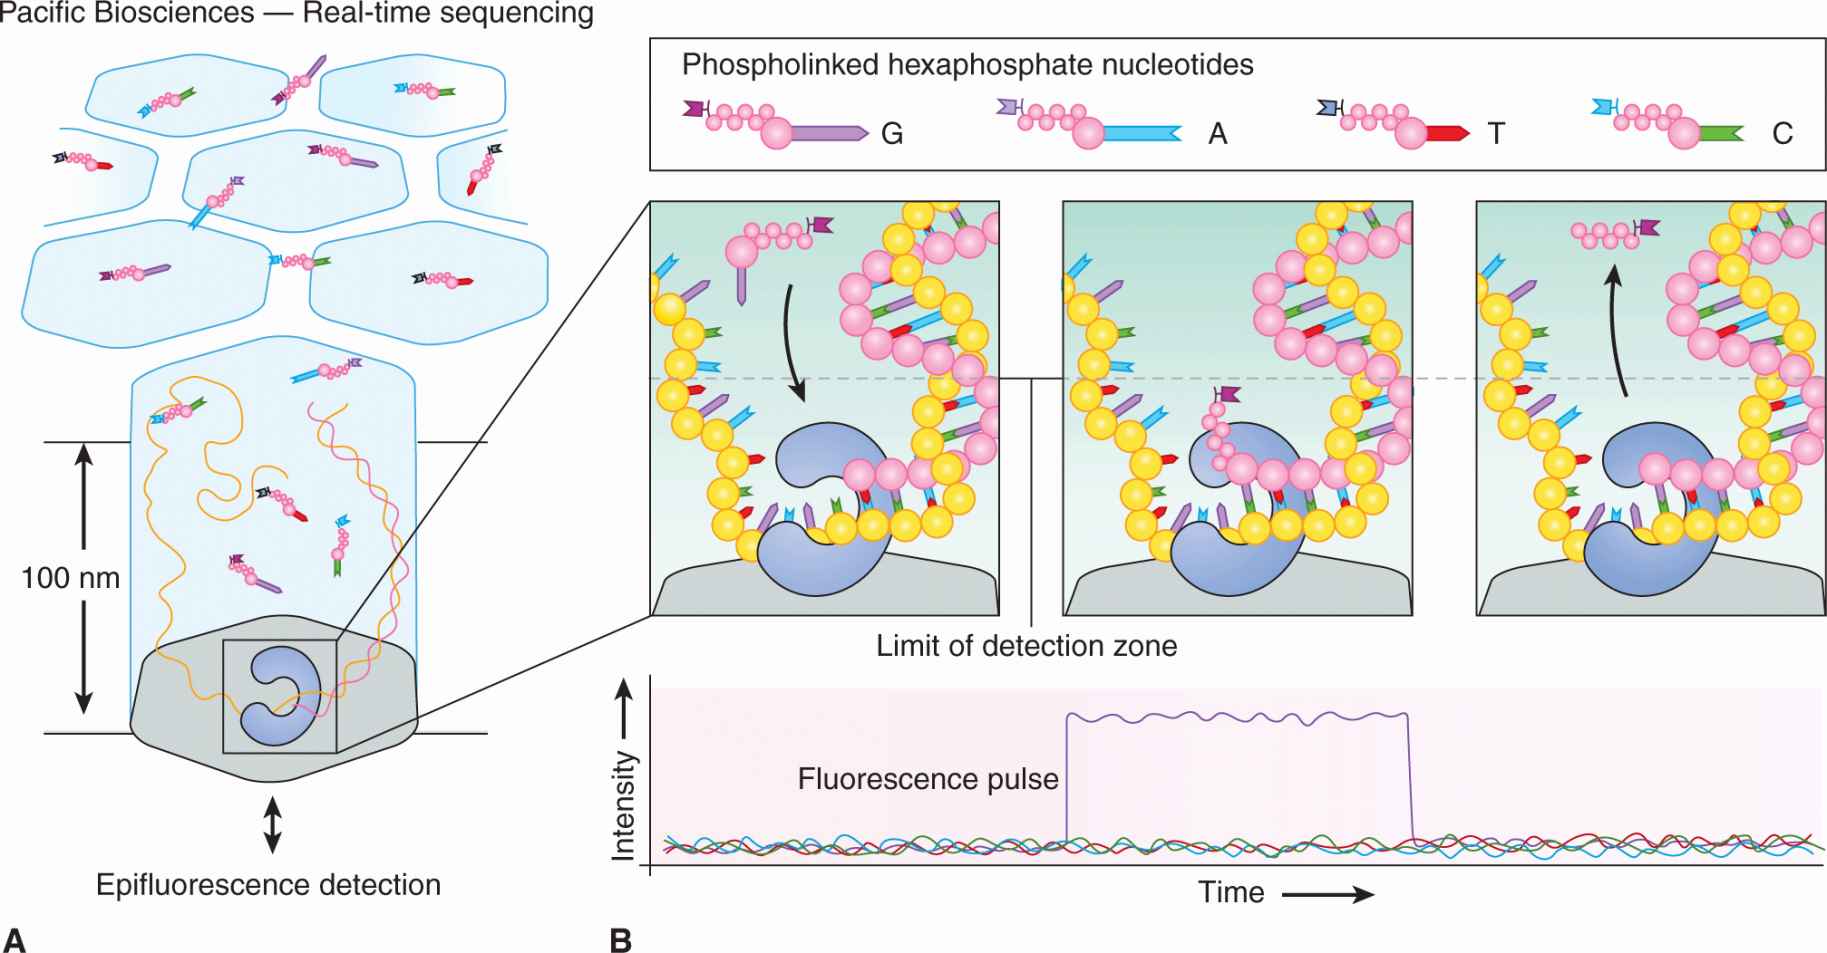
FIGURE 2–16 Pacific Biosciences’ four-color real-time sequencing method. The zero-mode waveguide (ZMW) design reduces the observation volume, therefore reducing the number of stray fluorescently labeled molecules that enter the detection layer for a given period. The residence time of phospho linked nucleotides in the active site is governed by the rate of catalysis and is usually milliseconds. This corresponds to a recorded fluorescence pulse, because only the bound, dye-labeled nucleotide occupies the ZMW detection zone on this timescale. The released, dye-labeled pentaphosphate by-product quickly diffuses away, as does the fluorescence signal. (From Metzker, 2010.)
The Ion Torrent sequencing relies on emulsion PCR amplified particles (ion sphere particles) to be deposited into an array of wells by a short centrifugation step. The sequencing is based on the detection of hydrogen ions that are released during the polymerization of DNA, as opposed to the optical methods used in other sequencing systems. A microwell containing a template DNA strand to be sequenced is flooded with a single type of nucleotide. If the introduced nucleotide is complementary to the leading template nucleotide it is incorporated into the growing complementary strand. This causes the release of a hydrogen ion that triggers a hypersensitive ion sensor, which indicates that a reaction has occurred. If homopolymer repeats are present in the template sequence multiple nucleotides will be incorporated in a single cycle. This leads to a corresponding number of released hydrogens and a proportionally higher electronic signal.
Despite the substantial cost reductions associated with next-generation technologies in comparison with the automated Sanger method, whole-genome sequencing is expensive but the costs are continuing to fall. In the interim, investigators are using the NGS platforms to target specific regions of interest. This strategy can be used to examine all of the exons in the genome, specific gene families that constitute known drug targets, or megabase-size regions that are implicated in disease or pharmacogenetic effects. Methods to perform the initial first step are known as genomic partitioning and broadly include methods involving PCR, or other hybridization methodologies. These are generally hybridized to target-specific probes either on a microarray surface or in solution.
The ability to sequence large amounts of DNA at low-cost makes the NGS platforms described above useful for many applications such as discovery of variant alleles through resequencing targeted regions of interest or whole genomes, de novo assembly of bacterial and lower eukaryotic genomes, cataloguing the mRNAs (“transcriptomes”) present in cells, tissues and organisms (RNA–sequencing), and gene discovery.
2.2.11 Variation in Copy Number and Gene Sequence
The recent application of genome-wide analysis to human genomes has led to the discovery of extensive genomic structural variation, ranging from kilobase pairs to megabase pairs (Mbp) in size, that are not identifiable by conventional chromosomal banding. These changes are termed copy-number variations (CNVs) and can result from deletions, duplications, triplications, insertions, and translocations; they may account for up to 13% of the human genome (Redon et al, 2006).
Despite extensive studies, the total number, position, size, gene content, and population distribution of CNVs remain elusive. There has not been an accurate molecular method to study smaller rearrangements of 1 to 50 kbp on a genome-wide scale in different populations. Recent analyses revealed 11,700 CNVs involving more than 1000 genes (Redon et al, 2006; Conrad et al, 2010). Wider application of array CGH techniques and NGS is likely to reveal greater structural variation among different individuals and populations, as the majority of CNVs are beyond the resolving capability of current arrays. There are several different classes of CNVs (Fig. 2–17). Entire genes or genomic regions can undergo duplication, deletion and insertion events, whereas multisite variants (MSVs) refer to more complex genomic rearrangements, including concurrent CNVs and mutation or gene conversions (a process by which DNA sequence information is transferred from one DNA helix, which remains unchanged, to another DNA helix, whose sequence is altered). CNVs can be inherited or sporadic; both types may be involved in causing disease including cancer. However, the phenotypic effects of CNVs are unclear and depend on whether dosage-sensitive genes or regulatory sequences are influenced by the genomic rearrangement.
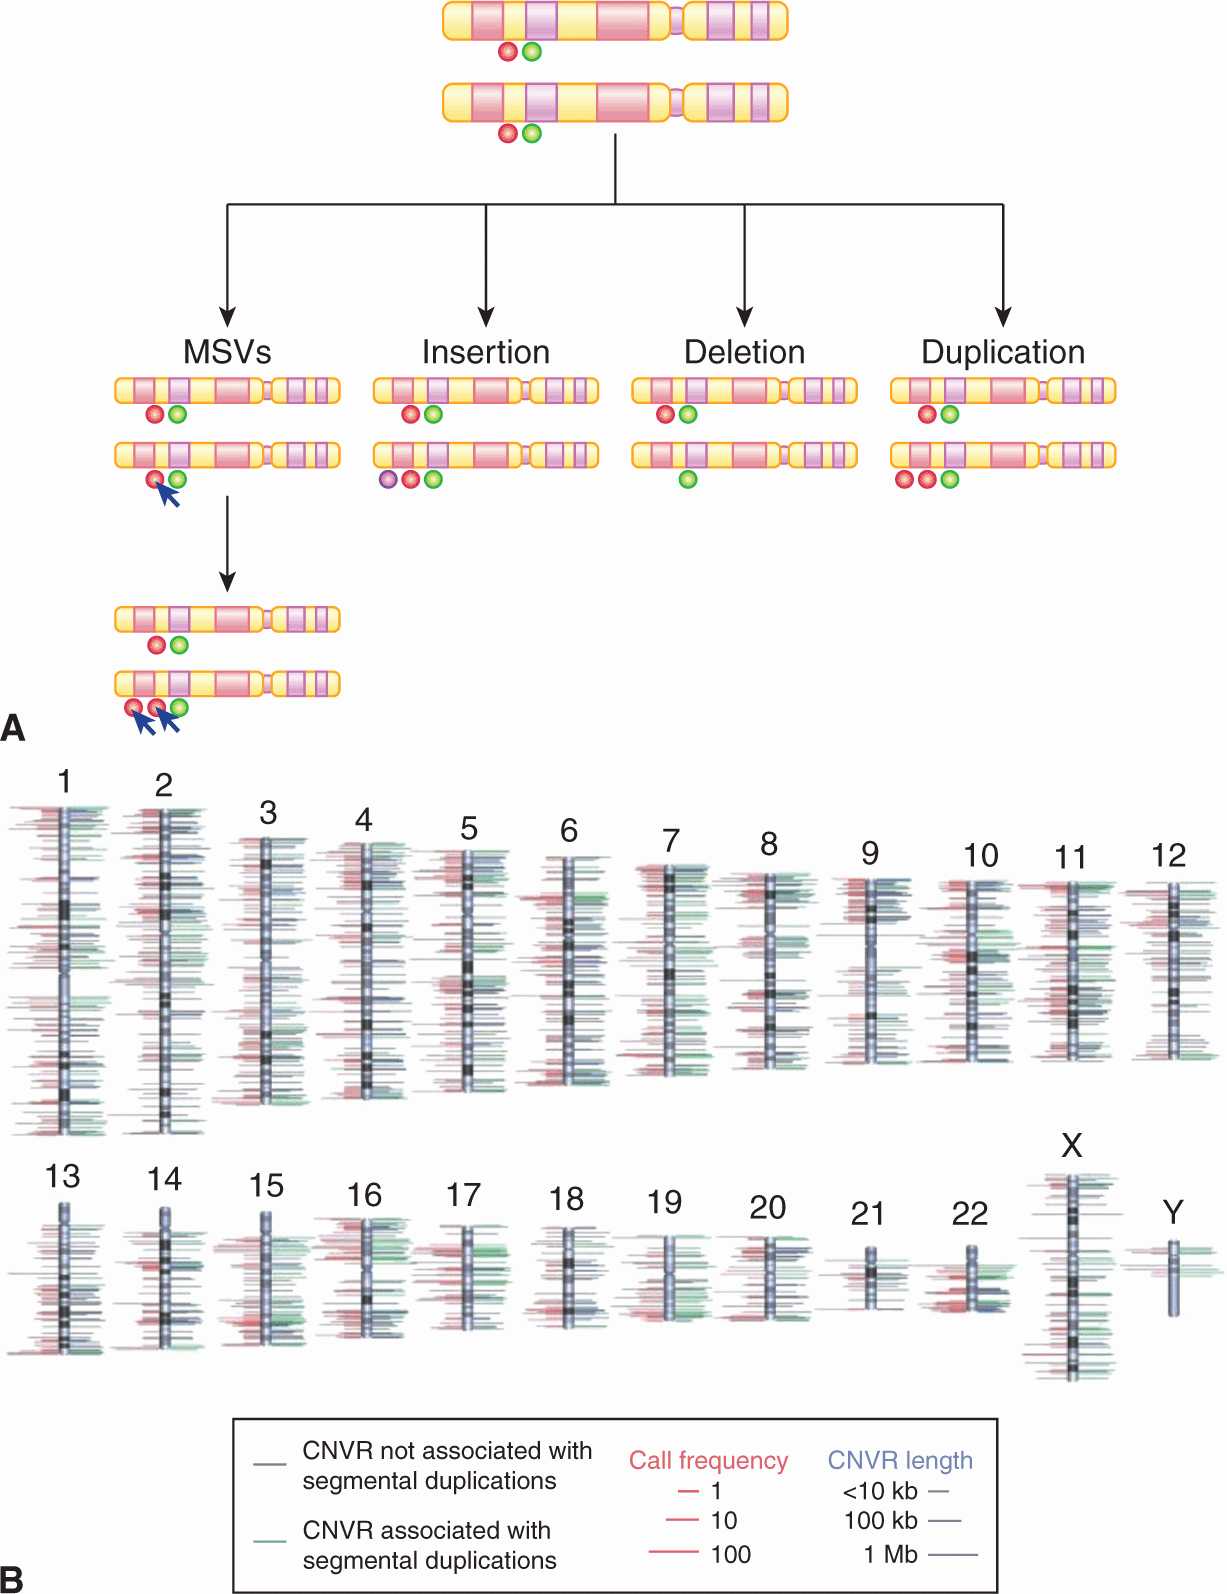
FIGURE 2–17 A) Outline of the classes of CNVs in the human genome. B) The chromosomal locations of 1447 copy number variation regions (a region covered by overlapping CNVs) are indicated by lines to either side of the ideograms. Green lines denote CNVRs associated with segmental duplications; blue lines denote CNVRs not associated with segmental duplications. The length of right-hand side lines represents the size of each CNVR. The length of left-hand side lines indicates the frequency with which a CNVR is detected (minor call frequency among 270 HapMap samples). When both platforms identify a CNVR, the maximum call frequency of the two is shown. For clarity, the dynamic range of length and frequency are log transformed (see scale bars). (From Redon et al, 2006.)
Use of high-resolution SNP arrays in cancer genomes has shown that CNVs are frequent contributors to the spectrum of mutations leading to cancer development. In adenocarcinoma of the lung, a total of 57 recurrent copy number changes were detected in a collection of 528 cases (Weir et al, 2007). In 206 cases of glioblastoma, somatic copy number alterations were also frequent, and concurrent gene expression analysis showed that 76% of genes affected by copy number alteration had expression patterns that correlated with gene copy number (Cerami et al, 2010). High-resolution analyses of copy number and nucleotide alterations have been carried out on breast and colorectal cancer (Leary et al, 2008). Individual colorectal and breast tumors had, on average, 7 and 18 copy number alterations, respectively, with 24 and 9 as the average number of protein-coding genes affected by amplification or homozygous deletions.
Heritable germline CNVs may also contribute to cancer. For example, a heritable CNV at chromosome 1q21.1 contains the NBPF23 gene for which copy number is implicated in the development of neuroblastoma (Diskin et al, 2009). Also, a germline deletion at chromosome 2p24.3 is more common in men with prostate cancer, with higher prevalence in patients with aggressive compared with nonaggressive prostate cancer (Liu et al, 2009). However, how CNVs, either somatic or germline, contribute to cancer development is still poorly understood. Possible explanations come from the Knudson’s two-hit hypothesis (Knudson, 1971): tumor-suppressor genes can be lost as a consequence of a homozygous deletion leading directly to cancer susceptibility (see Chap. 7, Sec. 7.2.3). Alternatively, heterozygous deletions may harbor genes predisposing to cancer that become unmasked when a functional mutation arises in the other chromosome resulting in tumor development. Duplications or gains of chromosomal regions may result in increased expression levels of one or more oncogenes. Germline CNVs can provide a genetic basis for subsequent somatic chromosomal changes that arise in tumor DNA.
2.2.12 Microarrays and RNA Analysis
Microarray analysis has been developed to assess expression of the increasing number of genes identified by the Human Genome Project. There are several commercial kits designed to assist with RNA extraction from cells or tissues. The extracted RNA is then usually converted to cDNA with reverse transcriptase, and this may be combined with an RNA amplification step.
The principle of an expression array involves the production of DNA arrays or “chips” on solid supports for large-scale hybridization experiments. It consists of an arrayed series of thousands of microscopic spots of DNA oligo-nucleotides, called features, each containing specific DNA sequences, known as probes (or reporters). This approach allows for the simultaneous analysis of the differential expression of thousands of genes and has enhanced understanding of the dynamics of gene expression in cancer cells (Fig. 2–18).
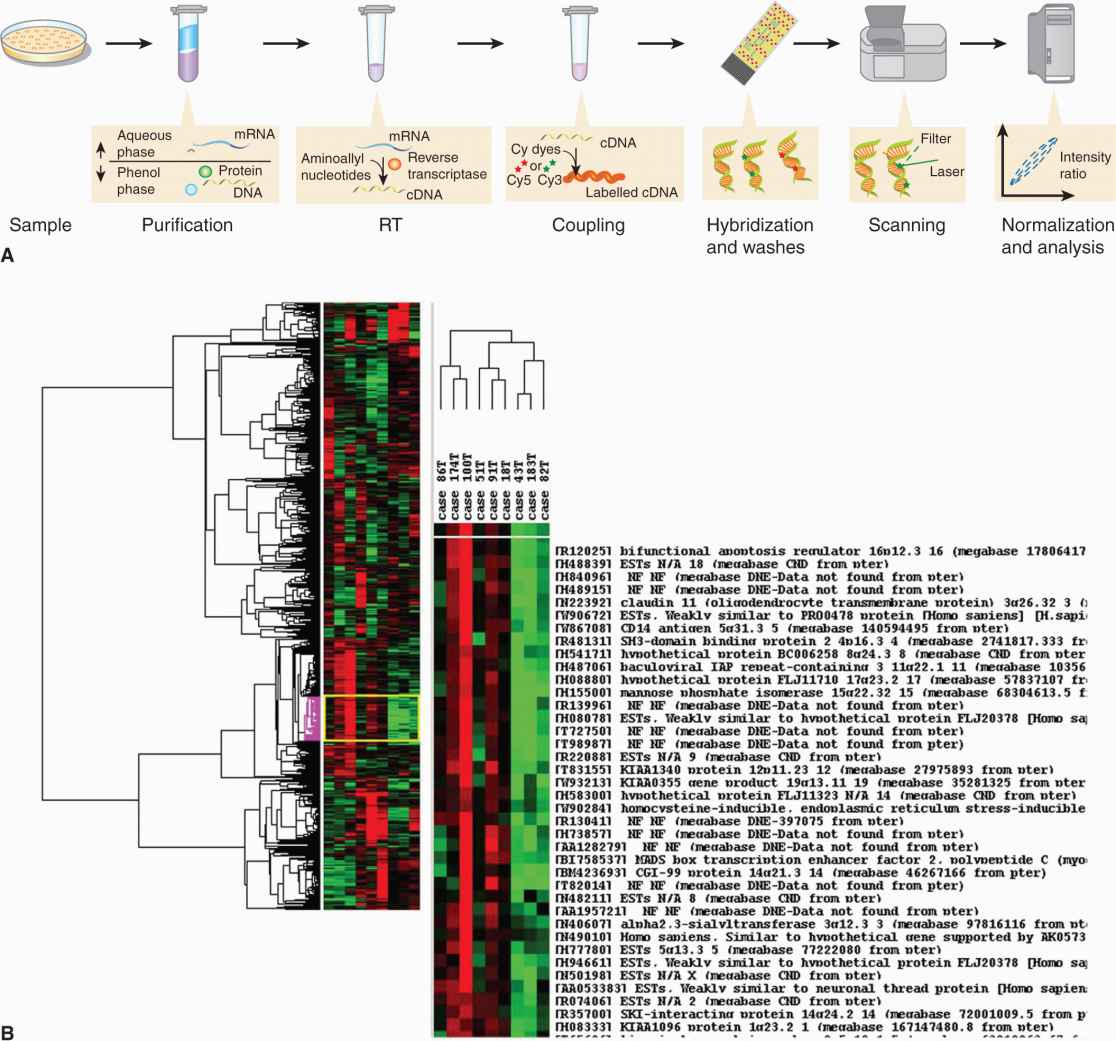
FIGURE 2–18 A) The steps required in a microarray experiment from sample preparation to analyses. RT, Reverse transcriptase. For details see text. Briefly, samples are prepared and cDNA is created through reverse transcriptase. The fluorescent label is added either in the RT step or in an additional step after amplification, if present. The labeled samples are then mixed with a hybridization solution that contains light detergents, blocking agents (such as COT1 DNA, salmon sperm DNA, calf thymus DNA, PolyA or PolyT), along with other stabilizers. The mix is denatured and added to a pinhole in a microarray, which can be a gene chip (holes in the back) or a glass microarray. The holes are sealed and the microarray hybridized, either in a hybridization oven, (mixed by rotation), or in a mixer, (mixed by alternating pressure at the pinholes). After an overnight hybridization, all nonspecific binding is washed off. The microarray is dried and scanned in a special machine where a laser excites the dye and a detector measures its emission. The intensities of the features (several pixels make a feature) are quantified and normalized (see text). (Reproduced with permission from Jacopo Werther/Wikimedia Commons.) B) The output from a typical microarray experiment, a hierarchical clustering of cDNA microarray data obtained from 9 primary laryngeal tumors. Results were visualized using Tree View software, and include the dendrogram (clustering of samples) and the clustering of gene expression, based on genomic similarity. Tree View represents the 946 genes that best distinguish these 2 groups of samples. Genes whose expression is higher in the tumor sample relative to the reference sample are shown in red; those whose expression is lower than the reference sample are shown in green; and no change in gene expression is shown in black. (Courtesy of Patricia Reis and Shilpi Arora, the Ontario Cancer Institute and Princess Margaret Hospital, Toronto.)
There are a number of microarray platforms in common use. These platforms include: (a) Spotted arrays where DNA fragments (usually created by PCR) or oligonucleotides are immobilized on glass slides. The size of the fragment can be any length (usually 500 bp to 1 kbp) and the size of the oligo-nucleotides range from 20 to 100 nucleotides. These arrays can be created in individual laboratories using “affordable” equipment. (b) Affymetrix arrays, where the probes are synthesized using a light mask technology and are typically small (20 to 25 bp) oligonucleotides. (c) NimbleGen, the maskless array synthesizer technology that uses 786,000 tiny aluminum mirrors to direct light in specific patterns. Photo deposition chemistry allows single-nucleotide extensions with 380,000 or 2.1 million oligonucleotides/array as the light directs base pairing in specific sequences. (d) Agilent, which uses ink-jet printer technology to extend up to 60-mer bases through phosphoramidite chemistry. The capacity is 244,000 oligonucleotides/array. The analysis of microarrays is discussed in Section 2.7.1.
All the sequencing approaches described in Section 2.2.10 can be applied to RNA, in some cases by simply by converting the RNA to cDNA before analysis. It may also be necessary to remove the ribosomal RNA from the sample to increase the sensitivity of detection. This approach, known as RNA-Seq is becoming increasingly available, although it remains expensive. The technique possesses certain advantages when compared to expression microarrays in that it obviates the requirement for preexisting sequence information in order to detect and evaluate transcripts, and can detect fusion transcripts.
2.3 EPIGENETICS
Epigenetics relates to heritable changes in gene expression that are not encoded in the genome. These processes are mediated by the covalent attachment of chemical groups (eg, methyl or acetyl groups) to DNA and associated proteins, histones and chromatin (Fig. 2–19). Examples of epigenetic effects include imprinting, gene silencing, X chromosome inactivation, position effect, reprogramming, and regulation of histone modifications and heterochromatin. Importantly, epigenetic change is thought to be inherent in the carcinogenesis process. In general, cancer cells exhibit generalized, genome-wide hypomethylation and local hypermethylation of CpG islands associated with promoters (Novak, 2004). Although the significance of each epigenetic change is unclear, hundreds to thousands of genes can be epigenetically silenced by DNA methylation during carcinogenesis. Given these widespread effects, there are epigenetic modifier drugs in current clinical use and there is great potential for further therapeutic utility (see Chap. 17, Sec. 17.3). Additionally, because tumor-derived DNA is present in various, easily accessible body fluids, tumor specific epigenetic modifications such as methylated DNA could prove to be a useful biomarkers for cancer prediction or prognosis (Woodson et al, 2008).
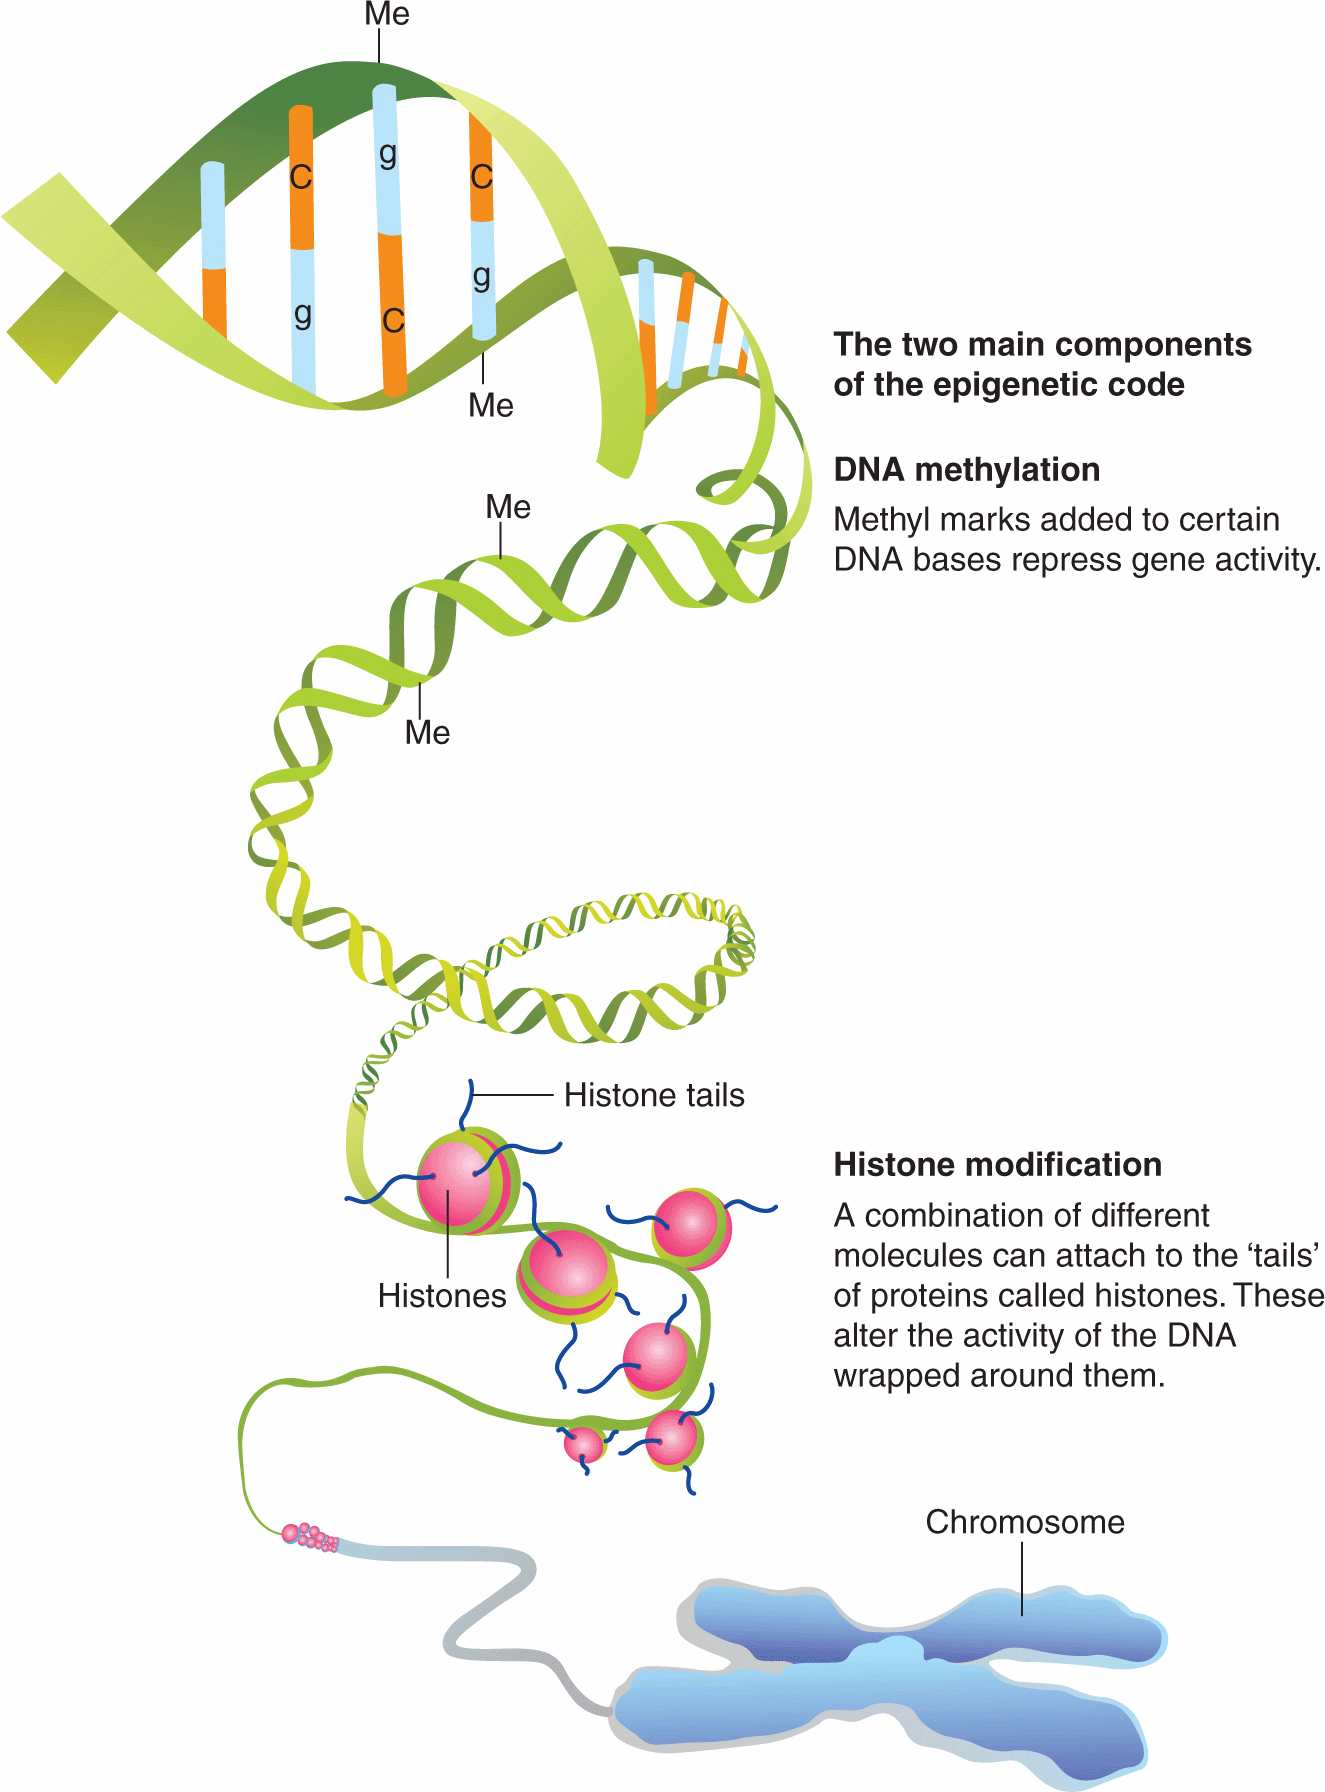
FIGURE 2–19 An overview of the major epigenetic mechanisms that affect gene expression. In addition, there are a number of varieties of histone modifications that are associated with alterations in gene expression or characteristic states, such as stem cells. (From http://embryology.med.unsw.edu.au/MolDev/Images/epigenetics.jpg.)
2.3.1 Histone Modification
Histones are alkaline proteins found in eukaryotic cell nuclei that package and order DNA into structural units called nucleosomes. Core histones consist of a globular C-terminal domain and an unstructured N-terminal tail. The epigenetic-related modifications to the histone protein occur primarily on the N-terminal tail (Novak, 2004). These modifications appear to influence transcription, DNA repair, DNA replication and chromatin condensation. For example, acetylation of lysine is associated with transcriptionally active DNA, while the effects (ie, activation or repression of transcription) of lysine and arginine methylation vary by location of the amino acid, number of methyl groups, and proximity to a gene promoter (Turner, 2007).
2.3.2 DNA Methylation
DNA methylation involves the addition of a methyl group to the 5′ position of the cytosine pyrimidine ring or the number 6 nitrogen of the adenine purine ring in DNA. In humans, approximately 1% of DNA bases undergo methylation and 10% to 80% of 5′-CpG-3′ dinucleotides are methylated; non-CpG methylation is more prevalent in embryonic stem cells. Unmethylated CpGs are often grouped in clusters called CpG islands, which are present in the 5′ regulatory regions of many genes (Gardiner-Garden and Frommer, 1987). In cancer, for reasons that remain unclear, gene promoter CpG islands acquire abnormal hypermethylation, which results in transcriptional silencing that can be inherited by daughter cells following cell division. There are at least 2 important consequences of DNA methylation. First, the methylation of DNA may physically impede the binding of transcriptional activators to the promoter, and second, methylated DNA may be bound by proteins known as methyl-CpG-binding domain proteins (MBDs). These proteins can recruit additional proteins to the locus, such as histone deacetylases, thereby forming heterochromatin (tightly coiled and generally inactive) linking DNA methylation to chromatin structure.
2.3.3 Technologies for Studying Epigenetic Changes
Epigenetic research uses a wide range of techniques designed to determine DNA–protein interactions, including chromatin immunoprecipitation (ChIP) (together with ChIP-on-chip and ChIP-seq), histone-specific antibodies, methylation-sensitive restriction enzymes and bisulfite sequencing. Here, we focus on the main approaches for studying DNA methylation along with their relative advantages and disadvantages (Table 2–3). A few points are worth emphasizing; sodium bisulfite converts unmethylated cytosines to uracil, while methylated cytosines (mC) remain unchanged (Fig. 2–20). This technique can reveal the methylation status of every cytosine residue, and it is amenable to massively parallel sequencing methods. Affinity-based methods using methyl-specific antibodies (MeDIP) are becoming more popular for whole genome analyses as methyl-specific antibodies improve in sensitivity and specificity (Fig. 2–21).
TABLE 2–3 Methods for analyzing DNA methylation.
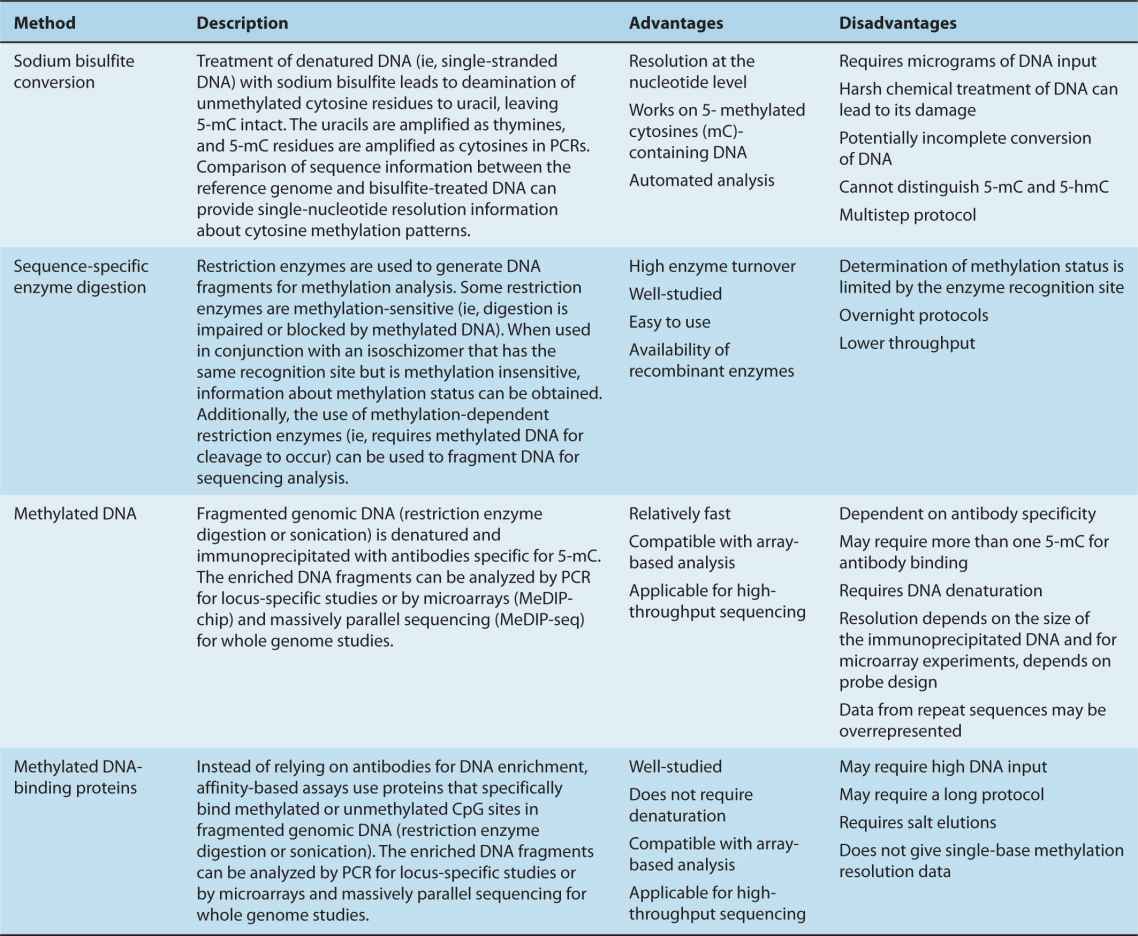
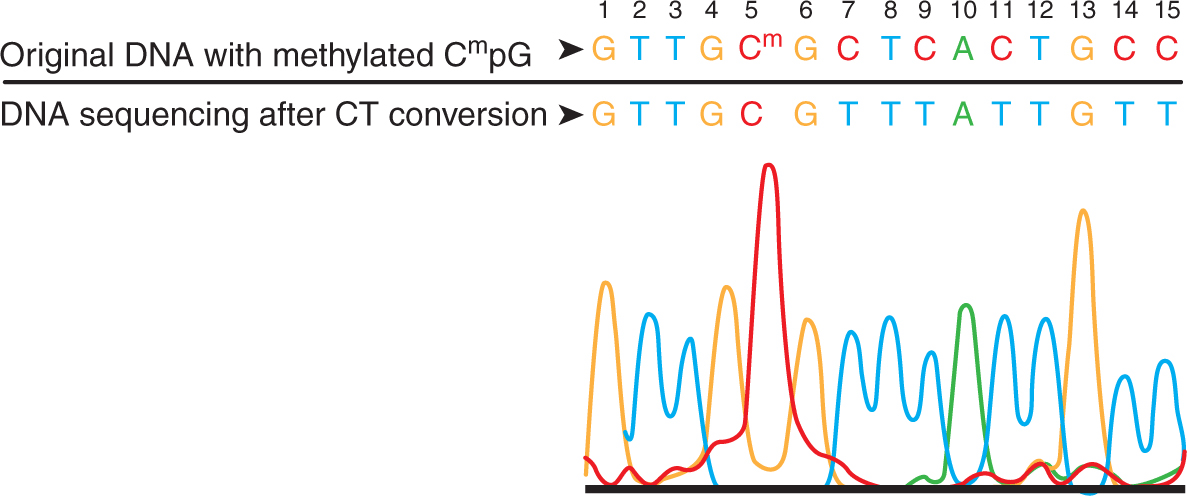
FIGURE 2–20 The most commonly used technique is sodium bisulfite conversion, the “gold standard” for methylation analysis. Incubation of the target DNA with sodium bisulfite results in conversion of all unmodified cytosines to uracils leaving the modified bases 5-methylcytosine or 5-hydroxymethylcytosine (5-mC or 5-hmC) intact. The most critical step in methylation analysis using bisulfite conversion is the complete conversion of unmodified cytosines. Generally, this is achieved by alternating cycles of thermal denaturation with incubation reactions. In this example, the DNA with methylated CpG at nucleotide position #5 was processed using a commercial kit. The recovered DNA was amplified by PCR and then sequenced directly. The methylated cytosine at position #5 remained intact, while the unmethylated cytosines at positions 7, 9, 11, 14, and 15 were completely converted into uracil following bisulfite treatment and detected as thymine following PCR.
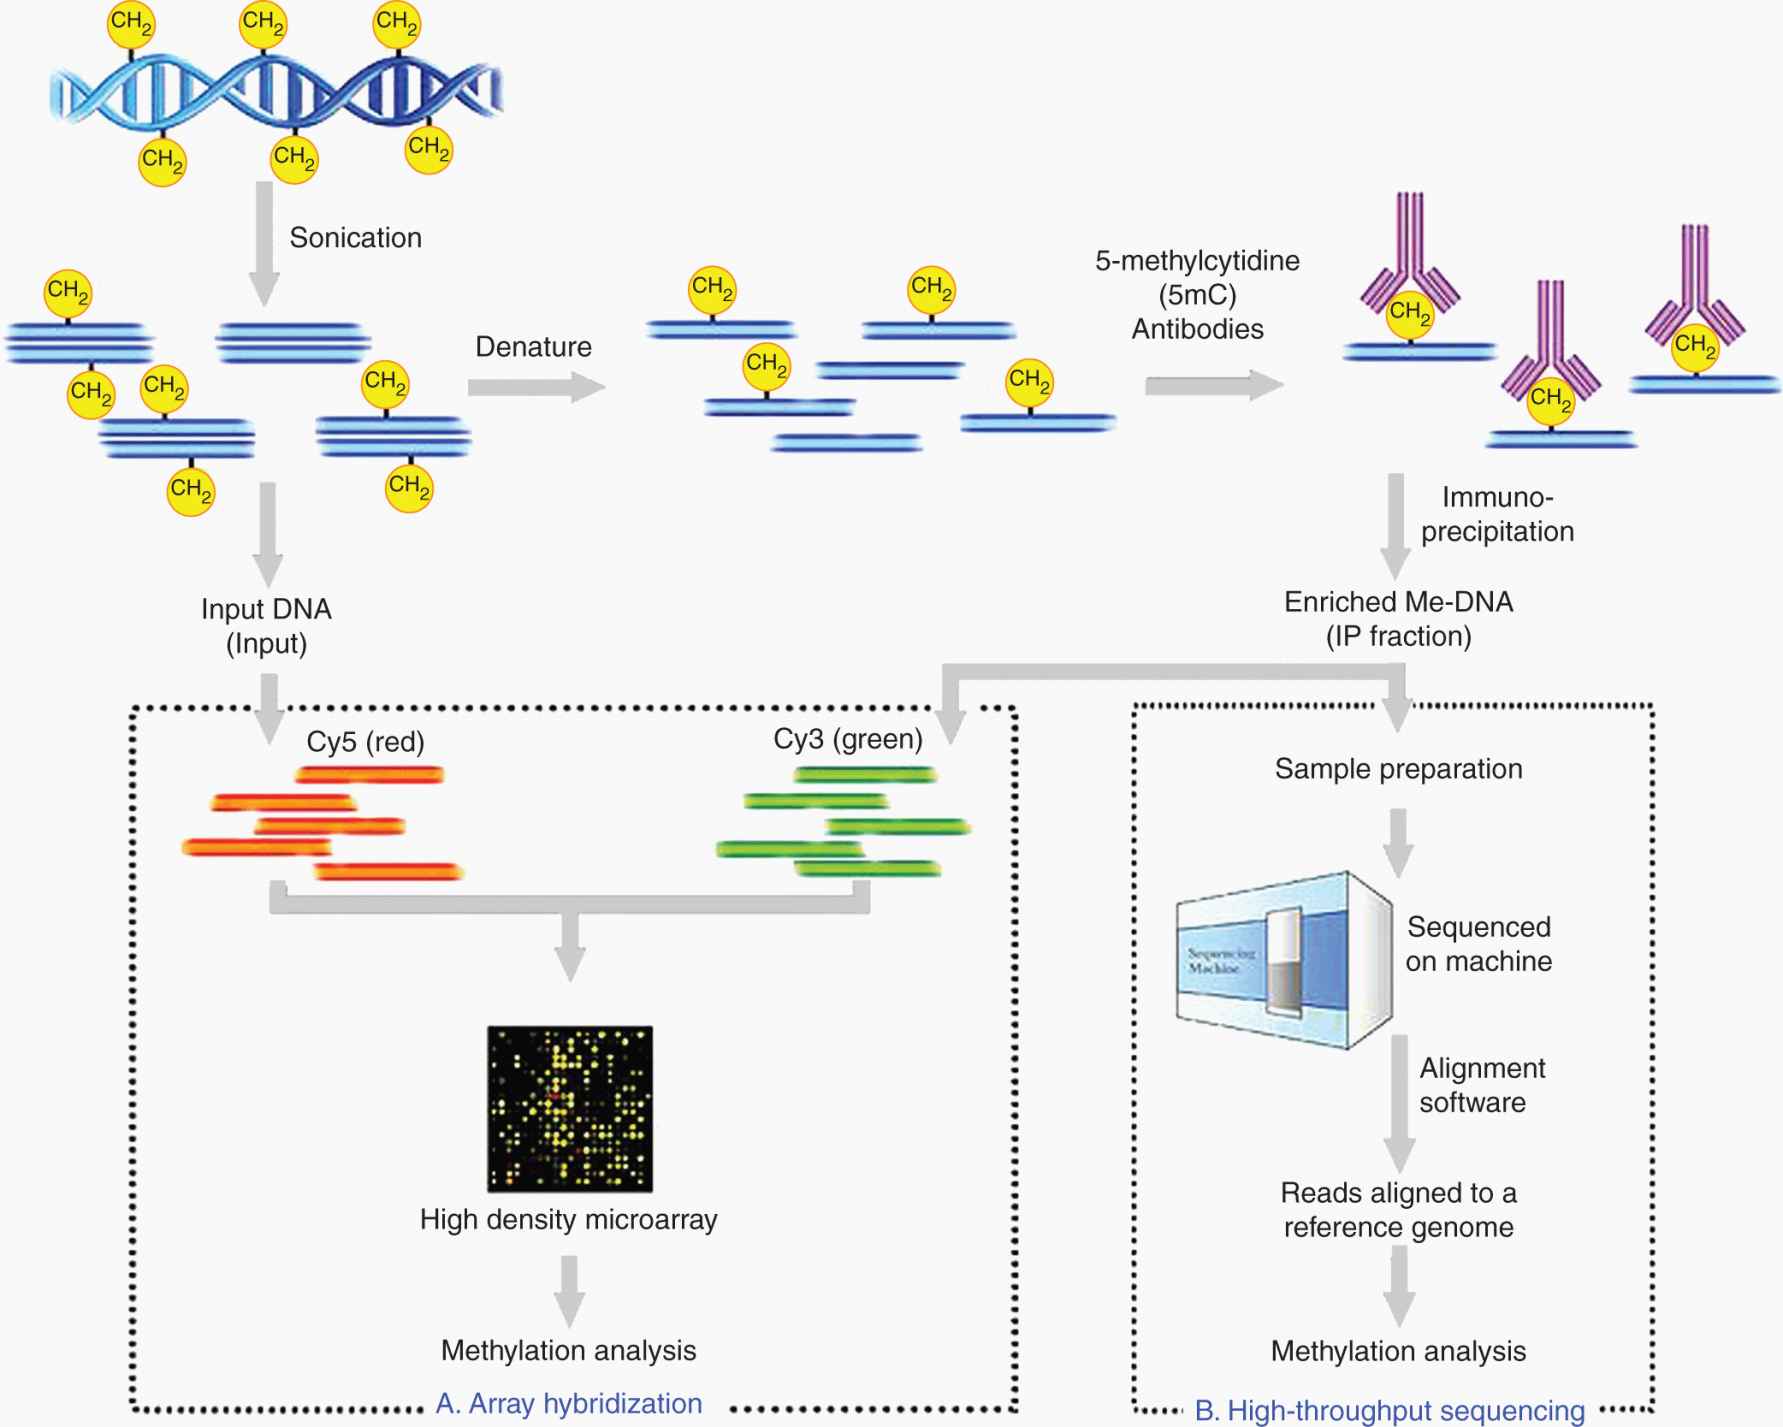
FIGURE 2–21 Schematic outline of MeDIP. Genomic DNA is sheared into approximately 400 to 700 bp using sonication and subsequently denatured. Incubation in 5-mC antibodies, along with standard immunoprecipitation (IP), enriches for fragments that are methylated (IP fraction). This IP fraction can become the input sample to 1 of 2 DNA detection methods: array hybridization using high-density microarrays (A) or high-throughput sequencing using the latest in sequencing technology (B). Output from these methods are then analyzed for methylation patterns to answer the biological question. (From http://en.wikipedia.org/wiki/Methylated_DNA_immunoprecipitation.)
A wide variety of analytical and enzymatic downstream methods can be used to characterize isolated genomic DNA of interest. Analytical methods, such as high-performance liquid chromatography (HPLC) and matrix-assisted laser desorption/ionization-time of flight mass spectrometry (MALDI-TOF MS; see also Sec. 2.4), have been used to quantify modified bases in complex DNAs. Although HPLC is highly reproducible, it requires large amounts of DNA and is often unsuitable for high-throughput applications. In contrast, MALDI-TOF MS provides relative quantification and is amenable to high-throughput applications.
Other methods to detect methylation include real-time PCR, blotting, microarrays (eg, ChIP on chip) and sequencing (eg, ChIP-Sequencing [ChIP-Seq]). ChIP-Seq combines ChIP with massively parallel DNA sequencing to identify the binding sequences for proteins of interest. Both ChIP techniques rely upon an antibody being available to an epigenetic modification of interest that is then used to “pull-down” the associated DNA via crosslinking so it can be subsequently analyzed. Previously, ChIP-on-chip was the most common technique utilized to study protein-DNA relations. This technique also utilizes ChIP initially, but the selected DNA fragments are ultimately released (“reverse crosslinked”) and the DNA is purified. After an amplification and denaturation step, the single-stranded DNA fragments are identified by labeling with a fluorescent tag such as Cy5 or Alexa 647 and poured over the surface of a DNA microarray, which is spotted with short, single-stranded sequences that cover the genomic portion of interest.
2.4 CREATING AND MANIPULATING MODEL SYSTEMS
2.4.1 Cell Culture/Cancer Cell Lines
Cells that are cultured directly from a patient are known as primary cells. With the exception of tumor-derived cells, most primary cell cultures have a limited life span. After a certain number of population doublings (called the Hayflick limit) cells undergo senescence and cease dividing although generally retaining viability. However, established or immortalized cell lines have an ability to proliferate indefinitely either through random mutation or deliberate modification, such as enforced expression of the telomerase reverse transcriptase (see Chap. 5, Sec. 5.7). There are numerous well-established cell lines derived from particular cancer cell types such as LNCaP for hormone-sensitive prostate cancer; MCF-7 for hormone-sensitive breast cancer; U87, a human glioblastoma cell line; and SaOS-2 for osteosarcoma.
Despite cell lines often being used in preclinical experiments to explore cancer biology there are a number of caveats that limit their validity: (a) The number of cells per volume of culture medium plays a critical role for some cell types. For example, a lower cell concentration makes granulosa cells undergo estrogen production, whereas a higher concentration makes them appear as progesterone-producing theca lutein cells. (b) Cross-contamination of cell lines may occur frequently and is often caused by proximity (during culture) to rapidly proliferating cell lines such as HeLa cells. Because of their adaptation to growth in tissue culture plates, HeLa cells may spread in aerosol droplets to contaminate and overgrow other cell cultures in the same laboratory, interfering with the validity of data interpretation. The degree of contamination among cell types is unknown because few researchers test the identity or purity of already-established cell lines, although scientific journals are increasingly requiring such tests. (c) As cells continue to divide in culture, they generally grow to fill the available area or volume. This can lead to nutrient depletion in the growth media, accumulation of apoptotic/necrotic (dead) cells and cell-to-cell contact, which leads to contact inhibition or senescence. Furthermore, tumor cells grown continuously in culture may acquire further mutations and epigenetic alterations that can change their properties and may affect their ability to reinitiate tumor growth in vivo. (d) The extent to which cancer cell lines reflect the original neoplasm from which they are derived is variable. For example, the prostate cancer cell line DU145 was derived from a brain metastasis, which is unusual in prostate cancer. Furthermore, the line does not express prostate-specific antigen (PSA) and its hypotriploid karyotype is uncommon in prostate cancer. The increasing recognition of the genetic heterogeneity both between and within individual cancers has raised further concerns about how well individual cell lines represent the cancer type from which they were derived.
2.4.2 Manipulating Genes in Cells
The function of a gene can often be studied by placing it into a cell different from the one from which it was isolated. For example, one may wish to place a mutated oncogene, isolated from a tumor cell, into a normal cell to determine whether it causes malignant transformation. The process of introducing DNA plasmids into cells is termed transfection. A number of transfection protocols have been developed for efficient introduction of foreign DNA into mammalian cells, including calcium phosphate or diethylaminoethyl (DEAE)-dextran precipitation, spheroplast fusion, lipofection, electroporation, and transfer using viral vectors (Ausubel and Waggoner, 2003). For all methods, the efficiency of transfer must be high enough for easy detection, and it must be possible to recognize and select for cells containing the newly introduced gene. Control over the expression of introduced genes can be achieved by the use of inducible expression vectors. These vectors allow the manipulation of a gene, most commonly when an exogenous agent (such as tetracycline or estrogen) is added or taken away from culture media: this is achieved with a specific repressor that responds to the exogenous agent, and is fused to domains that activate the gene of interest.
One method of transfection uses hydroxyethyl piperazineethanesulfonic acid (HEPES)-buffered saline solution (HeBS) containing phosphate ions combined with a calcium chloride solution containing the DNA to be transfected. When the 2 are combined, a fine precipitate of the positively charged calcium and the negatively charged phosphate of the DNA results in a fine solute, which is then added to the recipient cells. As a result of a process not completely understood, the cells take up the DNA-containing precipitate. A more efficient method is the inclusion of the DNA to be transfected in liposomes, which are small, membrane-bounded bodies that can fuse with the cell membrane, thereby releasing the DNA into the cell. For eukaryotic cells, transfection is better achieved using cationic liposomes (or mixtures). Popular agents are lipofectamine (Invitrogen, New York, USA) and UptiFectin (Interchim, Montiuçon Cedex, France). Another method uses cationic polymers such as DEAE-dextran or polyethyleni-mine: the negatively charged DNA binds to the polycation and the complex is absorbed via endocytosis.
Other methods require physical perturbation of cells (which may be detrimental to the study) to introduce DNA. Some examples include electroporation (application of an electric charge), sonoporation (sonic pulses), and optical (laser) transfection. Particle-based methods, such as the gene gun (where the DNA is coupled to a nanoparticle of an inert solid and “shot” directly into the target cell), magnetofection (utilizing magnetic forces to drive nucleic acid particle complexes into the target cell), and impalefection (impaling cells by elongated nanostructures such as carbon nanofibers or silicon nanowires which have been coated with plasmid DNA) are becoming less popular given the greater efficiency of viral transfection.
DNA can also be introduced into cells using viruses as carriers; the technique is called viral transduction, and the cells are transduced. Retroviruses are very stable, as their cDNA integrates into the host mammalian DNA, but only relatively small pieces of DNA (up to 10 kbp) can be transferred. Adenoviral-based vectors can accommodate larger inserts (~36 kbp) and have a very high efficiency of transfer (see Chap. 6, Sec. 6.2.2). However, with increasing frequency, lentiviruses (Fig. 2–22) are being used to introduce DNA into cells; they have the advantages of high-efficiency infection of dividing and nondividing cells, long-term stable expression of the transgene, and low immunogenicity.

FIGURE 2–22 Schematic outlining the process of lentiviral transfection. Cotransfection of the packaging plasmids and transfer vector into the packaging cell line, HEK293T, allows efficient production of lentiviral supernatant. Virus can then be transduced into a wide range of cell types, including both dividing and nondividing mammalian cells. Note that the packaging mix is often separated into multiple plasmids, minimizing the threat of recombinant replication-competent virus production. Viral titers are measured in either transduction units (TU)/mL or multiplicity of infection (MOI), which is the number of transducing lentiviral particles per cell to which the following relationship applies under experimental conditions:
(Total number of cells per well) × (Desired MOI) = Total TU needed
(Total TU needed)/(TU/mL reported on certificate of authentication) = Total mL of lentiviral particles to add to each well
Whichever method is used to introduce the DNA, it is usually necessary to select for retention of the transferred genes before assaying for expression. For this reason, a selectable gene, such as the gene encoding resistance to the antibiotics geneticin (G418), neomycin, or puromycin, can be introduced simultaneously.
2.4.3 RNA Interference
RNA interference (RNAi) is the process of mRNA degradation that is induced by double-stranded RNA in a sequence-specific manner. RNAi has been observed in all eukaryotes, from fission yeast to mammals. The power and utility of RNAi for specifically silencing the expression of any gene for which the sequence is available has driven its rapid adoption as a crucial tool for genetic analysis.
The RNAi pathway is thought to be an ancient mechanism for protecting the host and its genome against viruses that use double-stranded RNA (dsRNA) in their life cycles. RNAi is now recognized to be but one of a larger set of sequence-specific cellular responses to RNA, collectively called RNA silencing. RNA silencing plays a critical role in regulation of cell growth and differentiation using endogenous small RNAs called microRNAs (miRNAs). These miRNAs also play a role in carcinogenesis. For example, miR-15a and miR-16-1 act as putative tumor suppressors by targeting the oncogene BCL2. These miRNAs occur in a cluster at the chromosomal region 13q14, which is frequently deleted in cancer and is downregulated by genomic loss or mutations in CLL (Calin et al, 2005), prostate cancer (Bonci et al, 2008), and pituitary adenomas (Bottoni et al, 2005).
miRNAs are mostly transcribed from introns or other noncoding areas of the genome into primary transcripts of between 1 kb and 3 kb in length, called pri-miRNAs (Rodriguez et al, 2004) (Fig. 2–23). These transcripts are processed by the ribonucleases Drosha and DiGeorge syndrome critical region gene 8 (DGCR8) complex in the nucleus, resulting in a hairpin-shaped intermediate of approximately 70 to 100 nucleotides, called precursor miRNA (pre-miRNA) (Landthaler et al, 2004; Lee et al, 2003). The pre-miRNA is exported from the nucleus to the cytoplasm by exportin 5 (Perron and Provost, 2009). Once in the cytoplasm, the pre-miRNA is processed by Dicer, another ribonuclease, into a mature double-stranded miRNA of approximately 18 to 25 nucleotides. After strand separation, the guide strand or mature miRNA is incorporated into an RNA-induced silencing complex (RISC) and the passenger strand is usually degraded. The RISC complex is comprised of miRNA, argonaute proteins (argonaute 1 to argonaute 4) and other protein factors. The argonaute proteins have a crucial role in miRNA biogenesis, maturation and miRNA effector functions (Hutvagner and Zamore, 2002; Chendrimada et al, 2005).
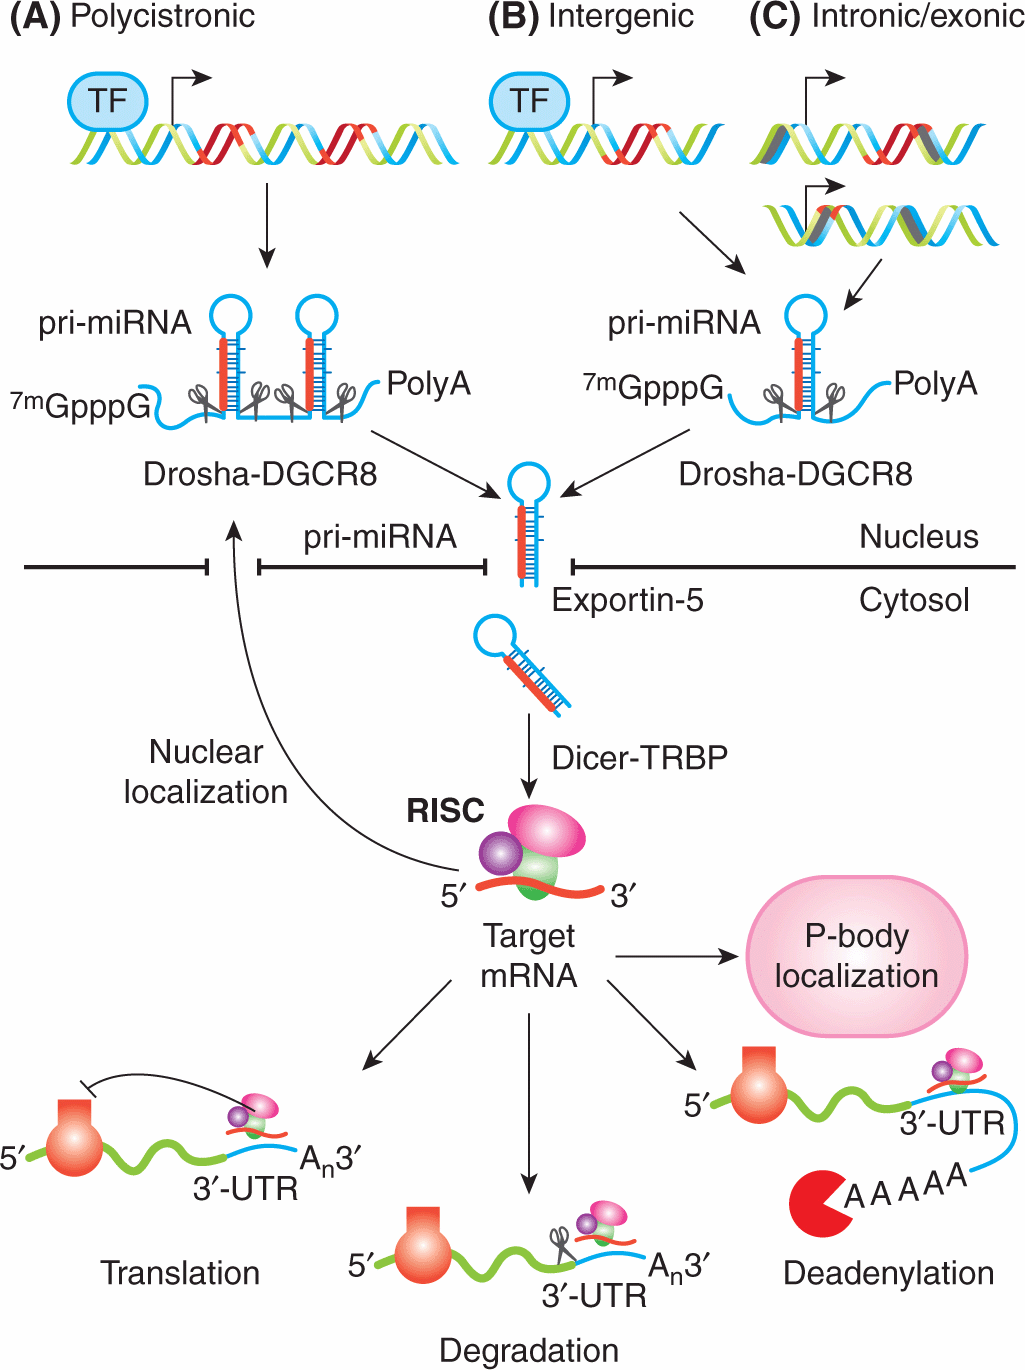
FIGURE 2–23 miRNA genomic organization, biogenesis and function. Genomic distribution of miRNA genes. The sequence encoding miRNA is shown in red. TF, Transcription factor. A) Clusters throughout the genome transcribed as polycistronic primary transcripts and subsequently cleaved into multiple miRNAs; B) intergenic regions transcribed as independent transcriptional units; C) intronic sequences (in gray) of protein-coding or protein-noncoding transcription units or exonic sequences (black cylinders) of noncoding genes. pri-miRNAs are transcribed and transiently receive a 7-methylguanosine (7mGpppG) cap and a poly(A) tail. The pri-miRNA is processed into a precursor miRNA (pre-miRNA) stem-loop of approximately 60 nucleotides (nt) in length by the nuclear ribonuclease (RNase) III enzyme Drosha and its partner DiGeorge syndrome critical region gene 8 (DGCR8). Exportin-5 actively transports pre-miRNA into the cytosol, where it is processed by the Dicer RNase III enzyme, together with its partner TAR (HIV) RNA binding protein (TRBP), into mature, 22 nt-long double-strand miRNAs. The RNA strand (in red) is recruited as a single-stranded molecule into the RNA-induced silencing (RISC) effector complex and assembled through processes that are dependent on Dicer and other double-strand RNA-binding domain proteins, as well as on members of the argonaute family. Mature miRNAs then guide the RISC complex to the 3′ untranslated regions (3′-UTRs) of the complementary mRNA targets and repress their expression by several mechanisms: repression of mRNA translation, destabilization of mRNA transcripts through cleavage, deadenylation, and localization in the processing body (P-body), where the miRNA-targeted mRNA can be sequestered from the translational machinery and degraded or stored for subsequent use. Nuclear localization of mature miRNAs has been described as a novel mechanism of action for miRNAs. Scissors indicate the cleavage on pri-miRNA or mRNA. (From Fazi et al, 2008.)
The discovery of the miRNAs suggested that RNAi might be triggered artificially in mammalian cells by synthetic genes that express mimics of endogenous triggers. Indeed, mimics of miRNAs in the form of short hairpin RNAs (shRNAs) have proven to be an invaluable research tool to further our understanding of many biological processes, including carcinogenesis. shRNAs contain a sense strand, antisense strand, and a short loop sequence between the sense and antisense fragments. Because of the complementarity of the sense and antisense fragments in their sequence, such RNA molecules tend to form hairpin-shaped dsRNA. shRNA can be cloned into a DNA expression vector and can be delivered to cells in the same ways devised for delivery of DNA. These constructs then allow ectopic mRNA expression by an associated pol III type promoter. The expressed shRNA is then exported into the cytoplasm where it is processed by dicer into short-interference RNA (siRNA), which then get incorporated into the siRNA RISC. A number of transfection methods are suitable, including transient transfection, stable transfection, and delivery using viruses, with both constitutive and inducible promoter systems.
2.4.4 Site-Directed Mutagenesis
Following the sequencing of the human genome (and that of other species), a plethora of genes are being identified without any knowledge of their function. Important clues concerning protein function may be provided through similarity in the amino acid sequence and secondary protein structure to other proteins or protein domains of known function. For example, many transcription-factor proteins have a characteristic motif through which DNA-binding takes place (eg, leucine-zipper or zinc-finger domain; see Chap 8. Sec. 8.2). One way of testing the putative function of such a sequence is to see whether a mutation within the critical site causes loss of function. In the example of transcription factors, a single mutation might result in a protein that failed to bind DNA appropriately. Site-directed mutagenesis permits the introduction of mutations at a precise point in a cloned gene, resulting in specific changes in the amino acid sequence. By site-directed mutagenesis, amino acids can be deleted, altered, or inserted, but for most experiments, the changes do not alter the reading frame and disrupt protein continuity. There are two classical methods of introducing a mutation into a cloned gene (Ausubel and Waggoner, 2003). The first method (Fig. 2–24A) relies on the chance occurrence of a restriction enzyme site in a region one wishes to alter. Typically, the gene is digested with the restriction endonuclease, and a few nucleotides may be inserted or deleted at this site by ligating a small oligonucleotide complementary to the cohesive DNA terminus that remains after enzyme digestion. The second method (Fig. 2–24B) is more versatile but requires more manipulation. The gene is first obtained in a single-stranded form by cloning into a vector such as M13 phage. First, a short oligonucleotide is synthesized containing the desired nucleotide change but otherwise complementary to the region to be mutated. The oligonucleotide will anneal to the single-stranded DNA but contains a mismatch at the site of mutation. The hybridized oligonucleotide-DNA duplex is then exposed to DNA polymerase I (plus the 4 nucleotides and buffers), which will synthesize and extend a complementary strand with perfect homology at every nucleotide except at the site of mismatch in the primer used to initiate DNA synthesis. The double-stranded DNA is then transfected into bacteria in the phage, and because of the semiconservative nature of DNA replication, 50% of the M13 phage produced will contain normal DNA and 50% will contain the DNA with the introduced mutation. Several methods allow easy identification of the mutant M13 virus. Using these techniques, the effects of artificially generated mutations can be studied in cell culture or in transgenic mice (see following section).
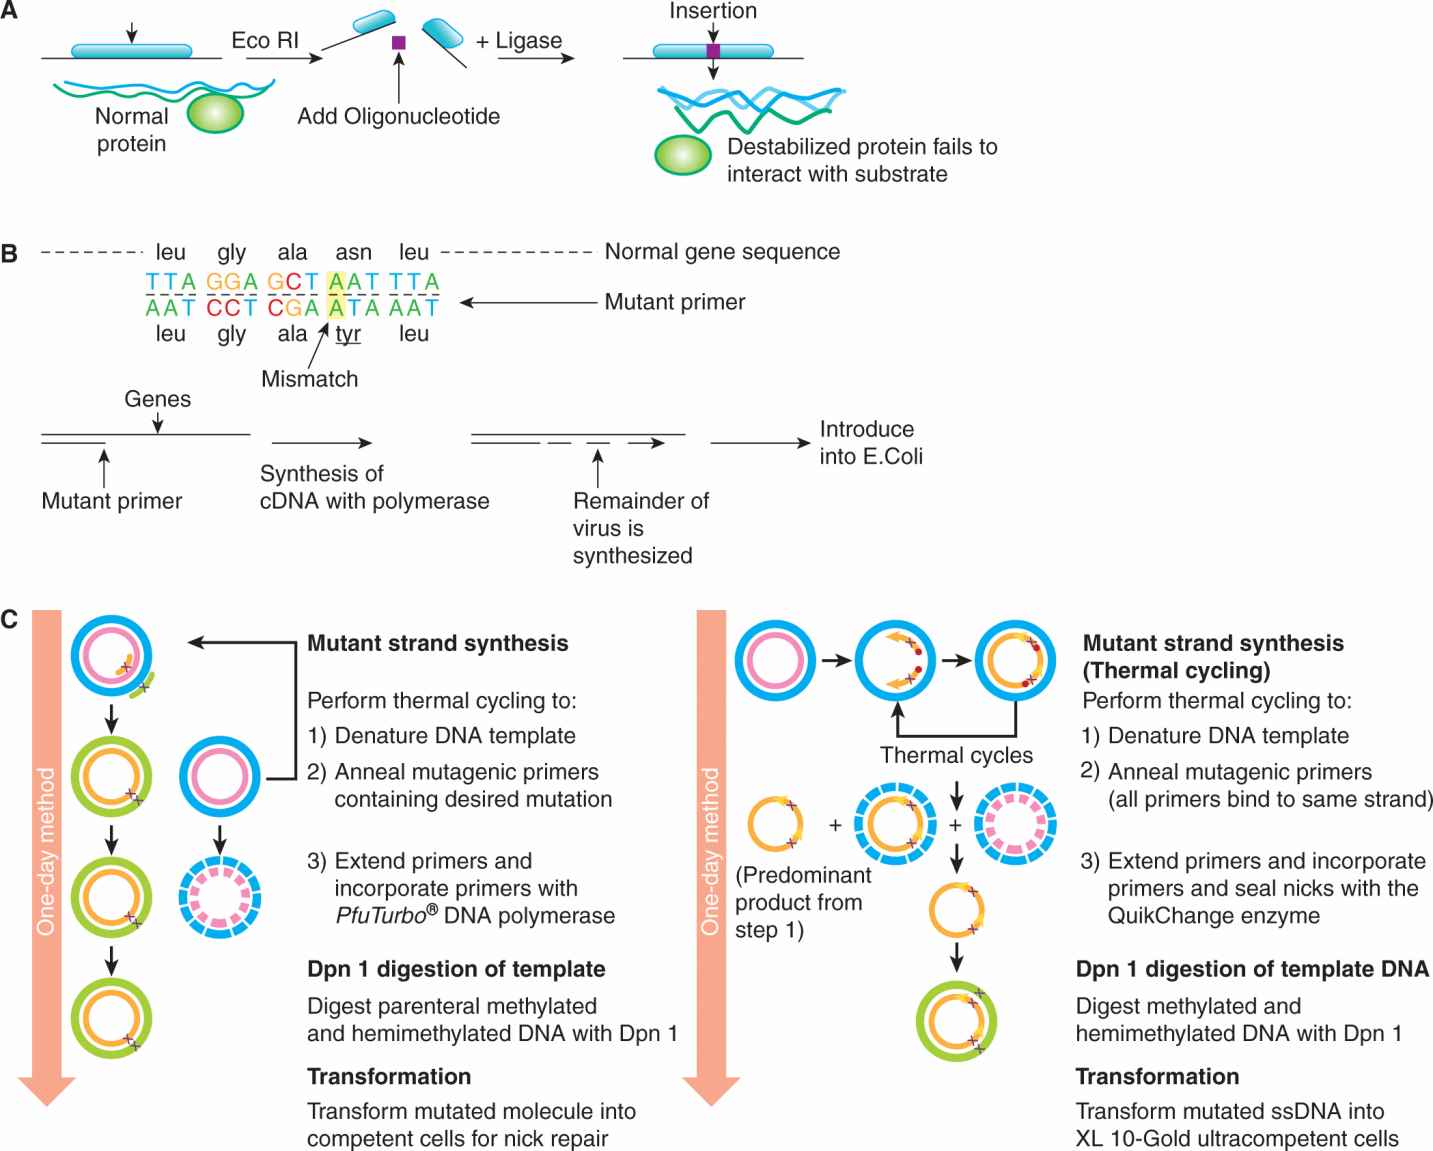
FIGURE 2–24 Methods for site-directed mutagenesis. A) Insertion of a new sequence at the site of action of a restriction enzyme by ligating a small oligonucleotide sequence within the reading frame of a gene. B) Use of a primer sequence that is synthesized to contain a mismatch at the desired site of mutagenesis. C) Outline of the PCR-based methodology. (From http://www.biocompare.com/Application-Notes/42126-Fast-And-Efficient-Mutagenesis/.)
More recently, techniques such as whole plasmid mutagenesis that rely on PCR (see Sec. 2.2.5) are often used as this produces a fragment containing the desired mutation in sufficient quantity to be separated from the original, unmutated plasmid by gel electrophoresis, which may then be used with standard recombinant molecular biology techniques. Following plasmid amplification (usually in Escherichia coli), commercially available kits (see Fig. 2–24C) can be used that involve a pair of complementary mutagenic primers that are used to amplify the entire plasmid DNA in a thermocycling reaction using a high-fidelity non–strand-displacing DNA polymerase. The reaction generates a nicked, circular DNA. The template DNA is eliminated by enzymatic digestion with a restriction enzyme such as DpnI, which is specific for methylated DNA, as all the DNA produced from the E. coli vector is methylated; the template plasmid which is biosynthesized in E. coli will therefore be digested, whereas the mutated plasmid is generated in vitro and is therefore unmethylated and left undigested.
2.4.5 Transgenic and Knockout Mice
One way to investigate the effects of gene expression in specific cells on the function of the whole organism is to transfer genes directly into the germline and generate transgenic mice. For example, inappropriate expression of an oncogene in a particular tissue can provide clues about the possible role of that oncogene in normal development and in malignant transformation. Usually a cloned gene with the desired regulatory elements is microinjected into the male pronucleus of a single-cell embryo so that it can integrate into a host chromosome and become part of the genome. If the introduced gene is incorporated into the germline, the resulting animal will become a founder for breeding a line of mice, all of which carry the newly introduced gene. Such mice are called transgenic mice, and the inserted foreign gene is called a transgene. Its expression can be studied in a variety of different cellular environments in a whole animal. Each transgene will have a unique integration site in a host chromosome and will be transmitted to offspring in the same way as a naturally occurring gene. However, the site of integration often influences the expression of a transgene, possibly because of the activity of genes in adjacent chromatin. Sometimes the integration event also alters the expression of endogenous genes (insertional mutation); this observation led to the development of gene-targeting approaches, so that specific genes could be inactivated or “knocked out.” The effect of the inserted or “knocked out” gene can then be studied for phenotypic effects in the animal (unless it turns out to be lethal in the embryo).
In vivo site-directed mutagenesis (Fig. 2–25) is the method by which a mutation is targeted to a specific endogenous gene. Instead of introducing a modified cloned gene at a random position as described above, a cloned gene fragment is targeted to a particular site in the genome by homologous recombination (a type of genetic recombination in which nucleotide sequences are exchanged between 2 similar or identical molecules of DNA). This process relies on the ability of a cloned mammalian gene or DNA fragment to preferentially undergo homologous recombination in a normal somatic cell at its naturally occurring chromosomal position, thereby replacing the endogenous gene. The intent is for the introduced mutation to result in the disruption of expression of the endogenous gene, or to result in a prematurely truncated, nonfunctional protein product. In typical targeting experiments, a DNA construct is prepared with a gene encoding drug resistance (usually to G418) and the DNA of interest. Initially, the modified DNA is introduced into pluripotent stem cells derived from a murine embryonic stem (ES) cells. The frequency of homologous recombination is low (less than 1 in a million cells), but is greatly influenced by a variety of factors, such as the host vector, the method of DNA introduction, the length of the regions of homology, and whether the targeted gene is expressed in ES cells. ES cells that contain the correctly targeted gene disruption are selected by growth in medium containing G418, and these cells are cloned and tested with PCR for homologous recombination. Once an ES cell line with the desired modification has been isolated and purified, ES cells are injected into a normal embryo, where they often contribute to all the differentiated tissues of the chimeric adult mouse. If gametes are derived from the ES cells, then a founder line containing the modification of interest can be established.
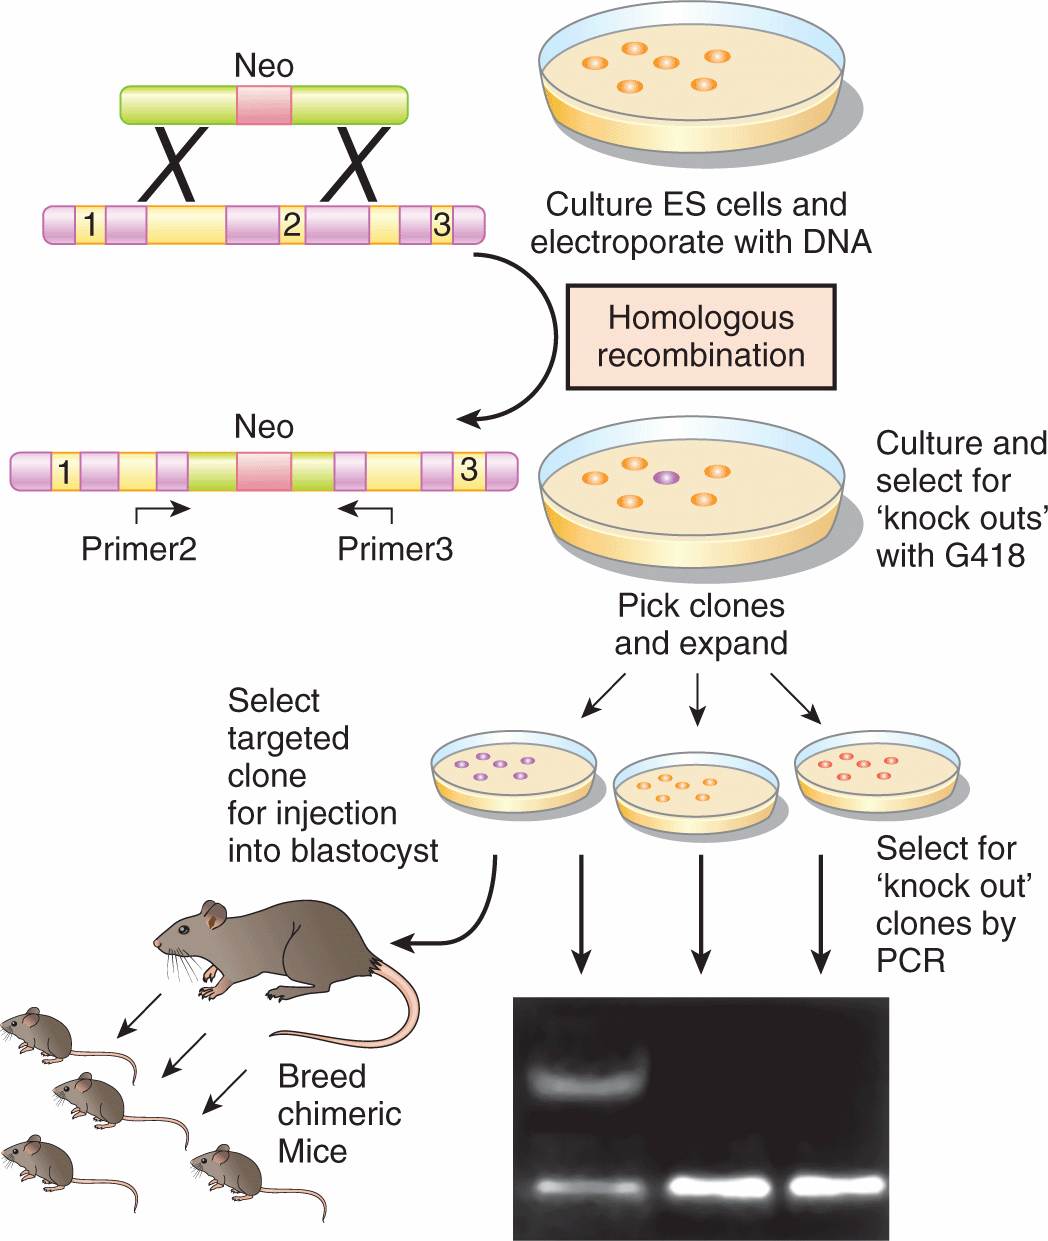
FIGURE 2–25 Disruption of a gene by homologous recombination in embryonic stem (ES) cells. Exogenous DNA is introduced into the ES cells by electroporation. The homologous region on the exogenous DNA is shown in gray, the selectable gene neomycin (neo) is speckled, and the target exons are black. The 2 recombination points are shown by Xs, and the exogenous DNA replaces some of the normal DNA of exon 2, thereby destroying its reading frame by inserting the small “neo” gene. ES cells that have undergone a successful homologous recombination are selected as colonies in G418 because of the stable presence of the neo gene. PCR primers for exons 2 and 3 are used to identify colonies in which a homologous recombination event has taken place. ES cells from such positive cells (dark colony) are injected into blastocysts, which are implanted into foster mothers (white). If germline transmission has been achieved, chimeric mice are bred to generate homozygotes for the “knocked out” gene.
Recent technologic advances in gene targeting by homologous recombination in mammalian systems enable the production of mutants in any desired gene. It is also possible to generate a conditionally targeted mutation within a mouse line using the cre-loxP system. This method takes advantage of the properties of the Cre recombinase enzyme first identified in P1 bacteriophage. Cre recognizes a 34-base pair DNA sequence (loxP). When two loxP sites are oriented in the same direction, the Cre recombinase will excise the intervening sequence; when they are oriented in the reverse direction, Cre will invert the intervening sequence. This system can be applied to the transgenic mouse in a number of ways (for review, see Babinet and Cohen-Tannoudji, 2001); for example, using the technique of homologous recombination, it is possible to replace a murine genomic sequence with the same sequence containing loxP sites, thus flanking a desired region by loxP sites. The resulting mice are normal, until the Cre recombinase is introduced. The manner of introduction of the recombinase can be carefully chosen so that only a specific cell type may be affected, or only a particular phase of differentiation, or both, thus allowing for spatial and temporal control of gene mutation within the mouse genome. This system is particularly advantageous in examining the role of essential genes in the mouse, particularly when knockout of the gene of interest is embryonic lethal. A conditional knockout mouse utilizing the cre-loxP system may allow one to study the effects of turning the gene on or off in a living animal. The cre-loxP system may also be used to generate chromosomal aberrations in a cell type-specific manner, which can improve understanding of the biology of some human diseases, particularly leukemias (Fig. 2–26).
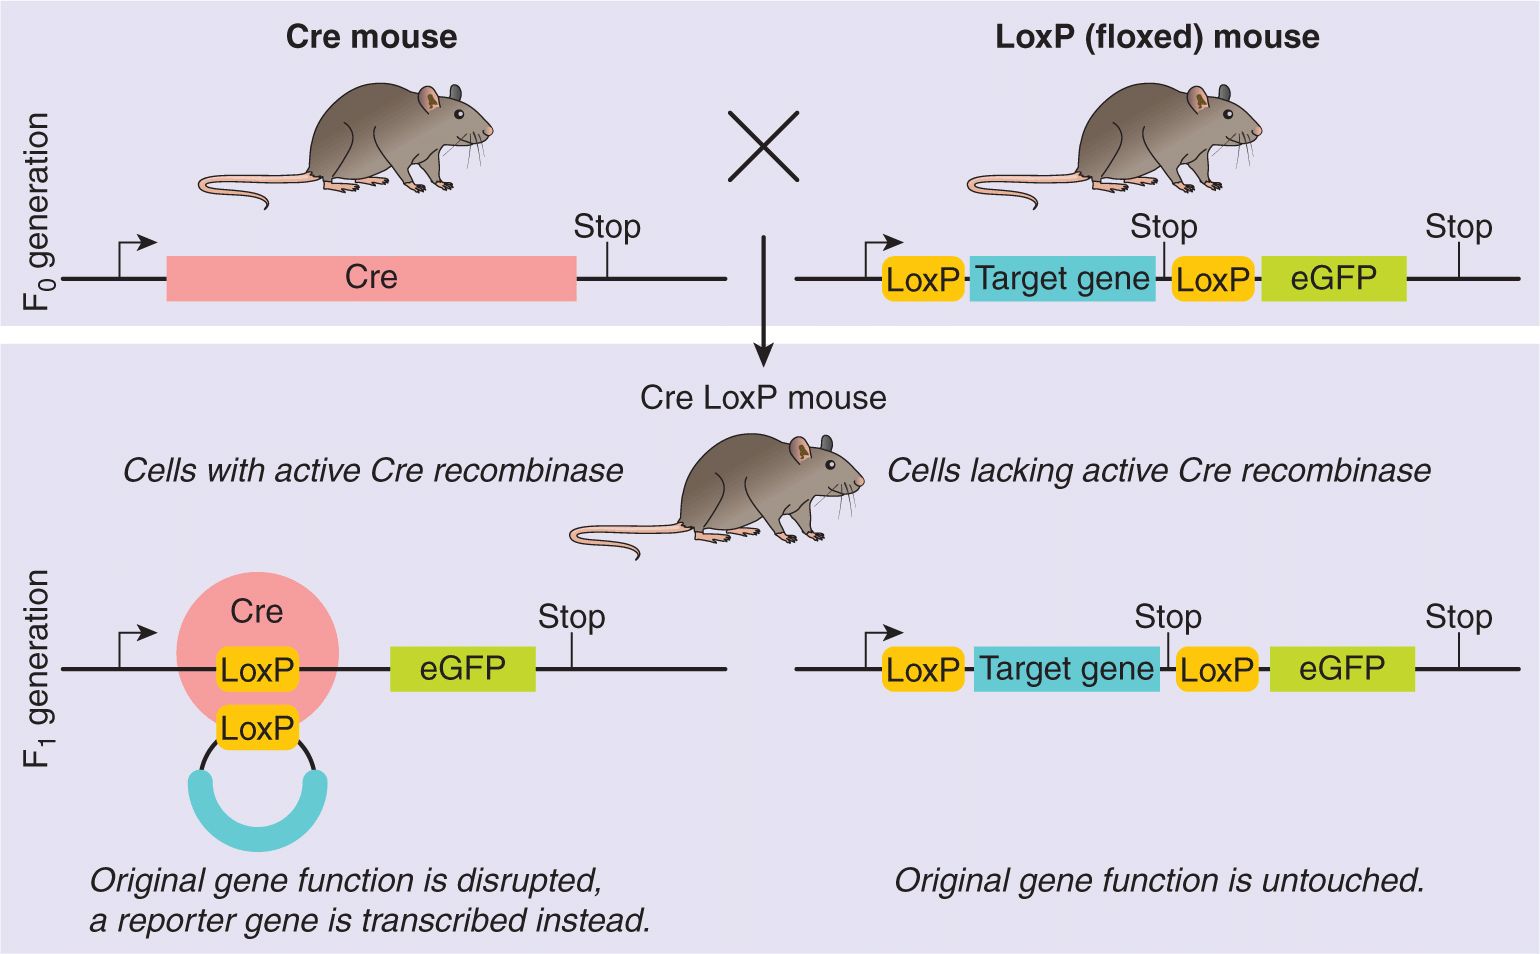
FIGURE 2–26 Illustration of a model experiment in genetics using the cre-lox system. The function of a target gene is disrupted by a conditional knockout. Typically, such an experiment would be performed with a tissue-specific promoter driving the expression of the cre-recombinase (or with a promoter only active during a distinct time in ontogeny). (From http://en.wikipedia.org/wiki/File:CreLoxP_experiment.png.)
Other means of targeting genes for manipulation in vivo include zinc finger nucleases and transcription activatorlike effector nucleases (TALENs). Zinc finger nucleases (ZFNs) are synthetic proteins consisting of an engineered zinc finger DNA-binding domain fused to the cleavage domain of the FokI restriction endonuclease. ZFNs can be used to induce double-stranded breaks (DSBs) in specific DNA sequences and thereby promote site-specific homologous recombination and targeted manipulation of genomic loci in a variety of different cell types. G-rich sequences are the natural preference of zinc fingers, which is currently a limitation to their use (Isalan, 2012). TALENs were discovered in plant pathogens but now have been modified to contain a TALEN DNA binding domain for sequence-specific recognition fused to the catalytic domain of the Fok1 nuclease that introduces DSBs. The DNA binding domain contains a highly conserved 33- to 34-amino acid sequence with the exception of the 12th and 13th amino acids. These 2 locations are highly variable (repeat variable diresidue [RVD]) and show a strong correlation with specific nucleotide recognition. This simple relationship between amino acid sequence and DNA recognition has allowed for the engineering of specific DNA binding domains by selecting a combination of repeat segments containing the appropriate RVDs. Therefore, the DNA binding domain of a TALEN is capable of targeting with high precision a large recognition site (for instance, 17 bp).
2.5 PROTEOMICS
Proteomics refers to the systematic, large-scale analysis of proteins in a biological system. It is a fusion of traditional protein biochemistry, analytical chemistry, and computer science to obtain a systemwide understanding of biological questions. Table 2–4 summarizes the types of proteomic research.
TABLE 2–4 Types of Proteomics Studies.
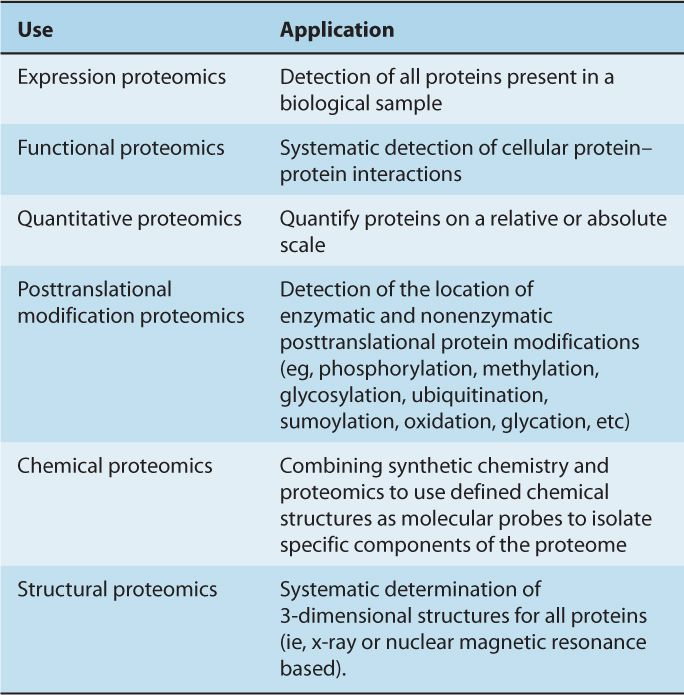
Mass spectrometry (MS), x-ray crystallography, and nuclear magnetic resonance (NMR) spectroscopy are often employed in the systematic analysis of protein–protein interaction networks, with emerging high-throughput tools, such as protein and chemical microarrays, making an increasing contribution. However, there are other useful methods for interrogating protein–protein interaction networks that may be applied on a systematic, genome-wide scale, including the yeast 2-hybrid system (Colas and Brent, 1998; Fields, 2009) and protein complementation assays (PCA) (Michnick et al, 2011). Each technique tends to enrich for specific types of protein interactions; for example, the yeast 2-hybrid system is highly sensitive, but often assesses only direct interactions between bait protein and its interaction partner. Despite the obvious issues surrounding signal-to-noise ratio, MS and other similar proteomic approaches can interrogate all detectable proteins that bind a bait protein, or can interrogate complex protein mixtures that have not been otherwise enriched for a particular protein.
2.5.1 Mass Spectrometry
MS is an analytical tool used to determine the mass, structure, and/or elemental composition of a molecule. In simplistic terms, a mass spectrometer is a very sensitive “detector” that can be divided into 3 main components (Fig. 2–27): an ion source, used to transfer the molecules to be analyzed into the gaseous state/gas phase (mass spectrometers are under high vacuum and therefore ions need to be transferred to the gas phase); a mass analyzer, used to measure the mass-to-charge ratio (m/z) of the generated ions (the elemental composition of analyzed ions results in specific m/z values used for identification); and a detector, used to register the intensity of the generated ions. One of the major developments for MS-based proteomics was the introduction of mild ionization technologies (MALDI and ESI) capable of ionizing large, intact biomolecules such as proteins or peptides.
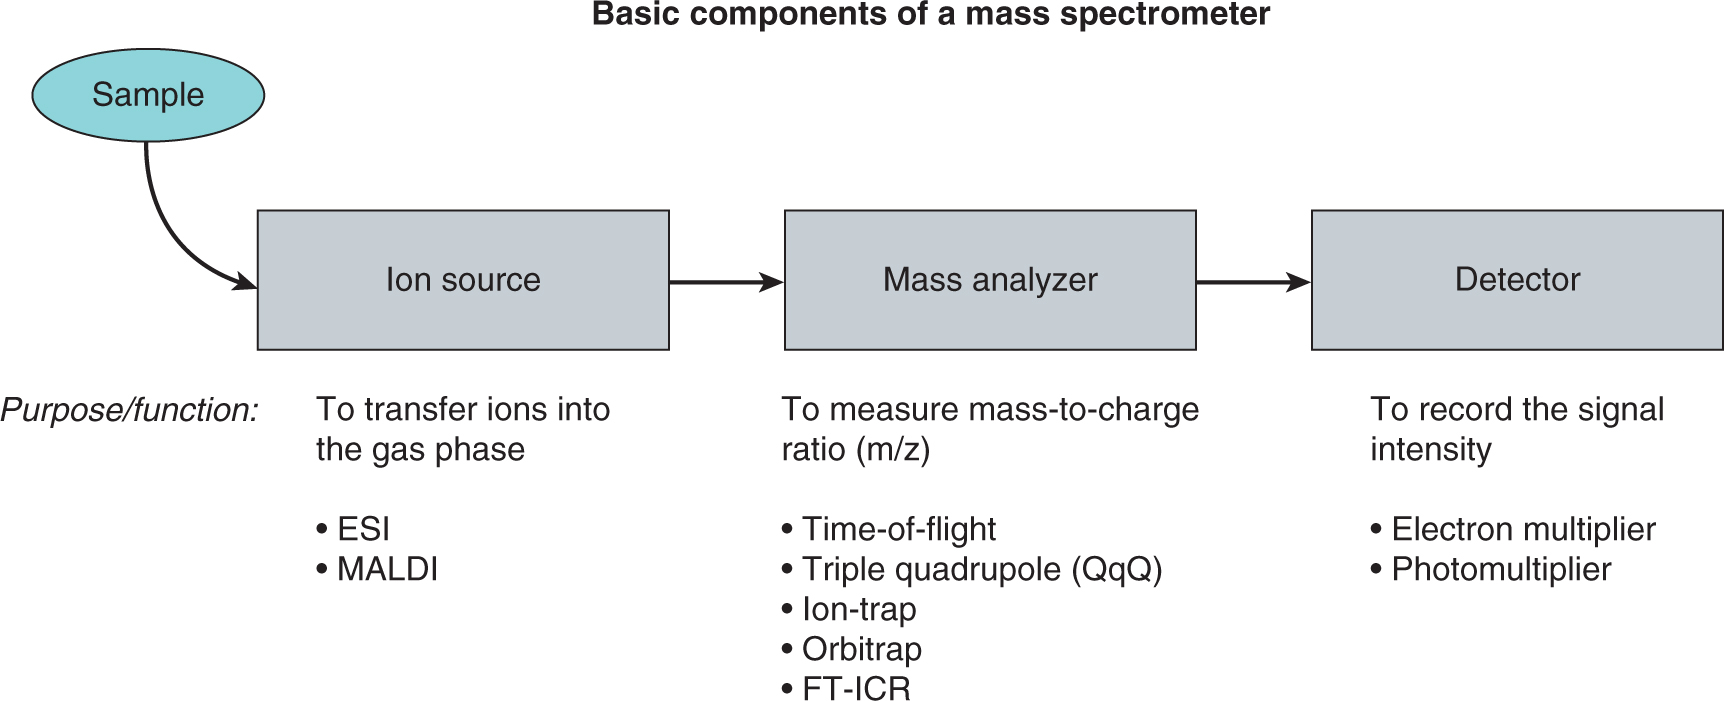
FIGURE 2–27 Schematic of the basic components of a mass spectrometer consisting of the ion source, the mass analyzer, and the detector. Individual examples for each component are listed in the figure. ESI, electrospray ionization; FT-ICR, fourier transform Ion cyclotron resonance; MALDI, matrix-assisted laser desorption/ionization.
In MALDI (matrix-assisted laser desorption/ionization), molecules to be analyzed (the analyte) are mixed with an energy-absorbing matrix consisting of organic aromatic acids (eg, sinapinic acid) in a solvent mixture of water, acetonitrile, and trifluoroacetic acid. The analyte is then mixed with the matrix solution (large excess of matrix; ~1:1000) and spotted onto a stainless steel target plate, dried to generate a cocrystal of analyte and matrix molecules. Pulsed lasers are then fired onto the cocrystal of matrix and analyte. Matrix molecules are used to absorb the majority of the laser energy, thereby protecting the analyte (the proteins and peptides being analyzed) from destruction. The matrix molecules and the organic acids then transfer their charge to the peptide/protein molecules, resulting in the mild ionization of these labile biomolecules (Fig. 2–28A).
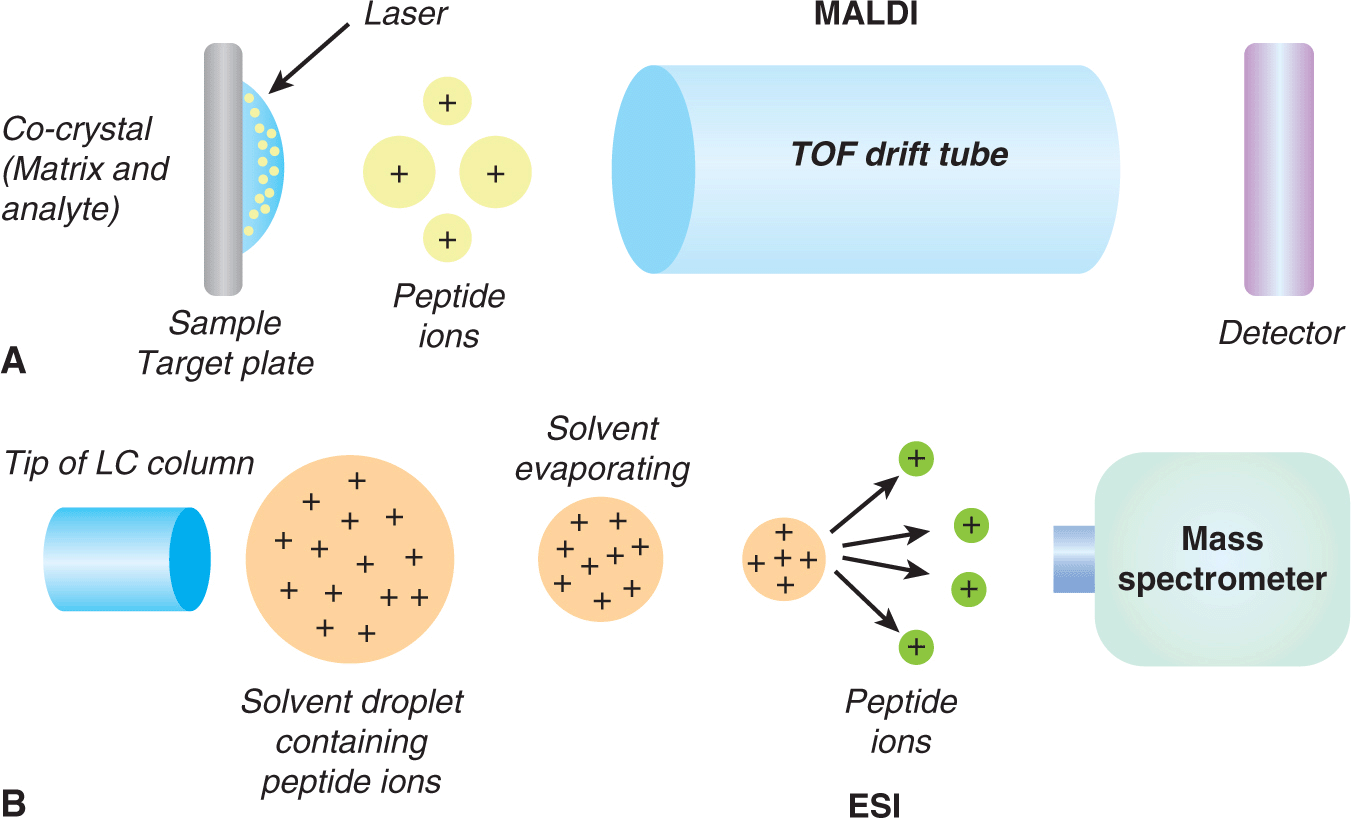
FIGURE 2–28 Schematics of mild peptide ionizations used for proteomics analyses. The 2 techniques used to ionize biological materials include matrix-assisted laser desorption/ionization (MALDI) and electrospray ionization (ESI). Both are soft ionization techniques allowing for the ionization of biomolecules such as proteins and peptides. A) In MALDI, ionization is triggered by a laser beam (normally a nitrogen laser). A matrix is used to protect the biomolecule from being destroyed by direct contact with the laser beam. This matrix-analyte solution is spotted onto a metal plate (target). The solvent vaporizes, leaving only the recrystallized matrix with proteins spread throughout the crystals. The laser is fired at the cocrystals on the MALDI target. The matrix material absorbs the energy and transfers part of its charge to the analyte and thus ionizing them. B) In ESI, a volatile liquid containing the analyte is passed through a microcapillary (ie, chromatography column). As the liquid is passed out of the capillary it forms an aerosol of small droplets. As the small droplets evaporate, the charged analyte molecules are forced closer together and the droplets disperse. The ions continue along to the mass analyzer of a mass spectrometer.
Electrospray ionization (ESI), involves analyte molecules being dissolved in the liquid phase and ionized by the application of a high voltage (2 to 4 kV) directly to the solvent, resulting in a fine aerosol at the tip of a chromatography column. The solvents used in MS-based proteomics are polar, volatile solvents (ie, water/acetonitrile containing trace amounts of formic acid). This ionization is ideally suited for coupling with high-resolution separation technologies such as liquid chromatography or capillary electrophoresis and is the most commonly used method of ionization in MS-based proteomics (see Fig. 2–28B).
A major challenge for comprehensive or large-scale, MS-based proteomics is the extreme complexity of the human proteome (Cox and Mann, 2007). Although there are only approximately 22,000 genes in the human genome, the human proteome is expected to be substantially larger, as a result of splicing, posttranslational protein modifications, and/or protein processing. This problem is further amplified because proteins have a large range of physicochemical properties, complicating extraction and/or solubilization of individual proteins. For example, membrane proteins have been largely underrepresented in proteomics studies as their solubility in polar, aqueous buffers is poor. Additionally, proteins in the human proteome span a wide range of concentrations, and the detection of low abundance species in the presence of very highly abundant proteins is a challenge even for modern, highly sensitive mass spectrometers. As a result, whole proteome analyses are extremely challenging. To overcome these problems, a variety of different analytical fractionations are used, aimed at minimizing sample complexity, thereby increasing the ability of the mass spectrometer to detect less abundant proteins. Fractionation methods can be applied to the intact protein (ie, chromatographic or electrophoretic), or proteins can first be digested and resulting peptides fractionated by liquid chromatography. MS is then used for identification and quantification, as described below.
2.5.2 Top-Down or Bottom-Up Proteomics
Conceptually, there are 2 different strategies for the MS-based analysis of proteins. The most commonly used strategy for the analysis of complex proteomes is termed bottom-up proteomics. Proteins or even complex proteomes are first digested to smaller peptides using (polypeptide) sequence-specific enzymes (trypsin is used most commonly). Resulting peptides are then separated by liquid chromatography (LC) and analyzed by ESI-MS. This process is referred to as “LC-MS analysis.” The resulting parent or precursor ions (ie, ions that have not undergone any collision-induced fragmentation) are consecutively selected for fragmentation by the MS, depending on their intensity. Fragmentation is usually achieved using collision-induced fragmentation (CID) through collision with inert gas molecules such as helium. Alternative fragmentation mechanisms include electron transfer dissociation (ETD) (Mikesh et al, 2006) or electron capture dissociation (ECD) (Appella and Anderson, 2007; Chowdhury et al, 2007). The resulting MS/MS spectra (ie, tandem mass spectra) contain information regarding the peptide amino acid sequence of the fragmented parent ions. The fragmentation of a parent/precursor peptide ion to a sequence specific tandem mass spectrum used for identification is dependent on several parameters, including the energy used for fragmentation, the fragmentation mechanism, and the amino acid sequence of the peptide. Resulting fragment ions can be classified according to a defined nomenclature (Roepstorff and Fohlman, 1984) (Fig. 2–29). Under conditions of CID fragmentation, b-ions and y-ions (ions generated from the N- or C-terminus of the peptide) are observed most commonly. Figure 2–30 is a schematic of a LC-MS analysis using data recorded on an LTQ-Orbitrap mass analyzer.
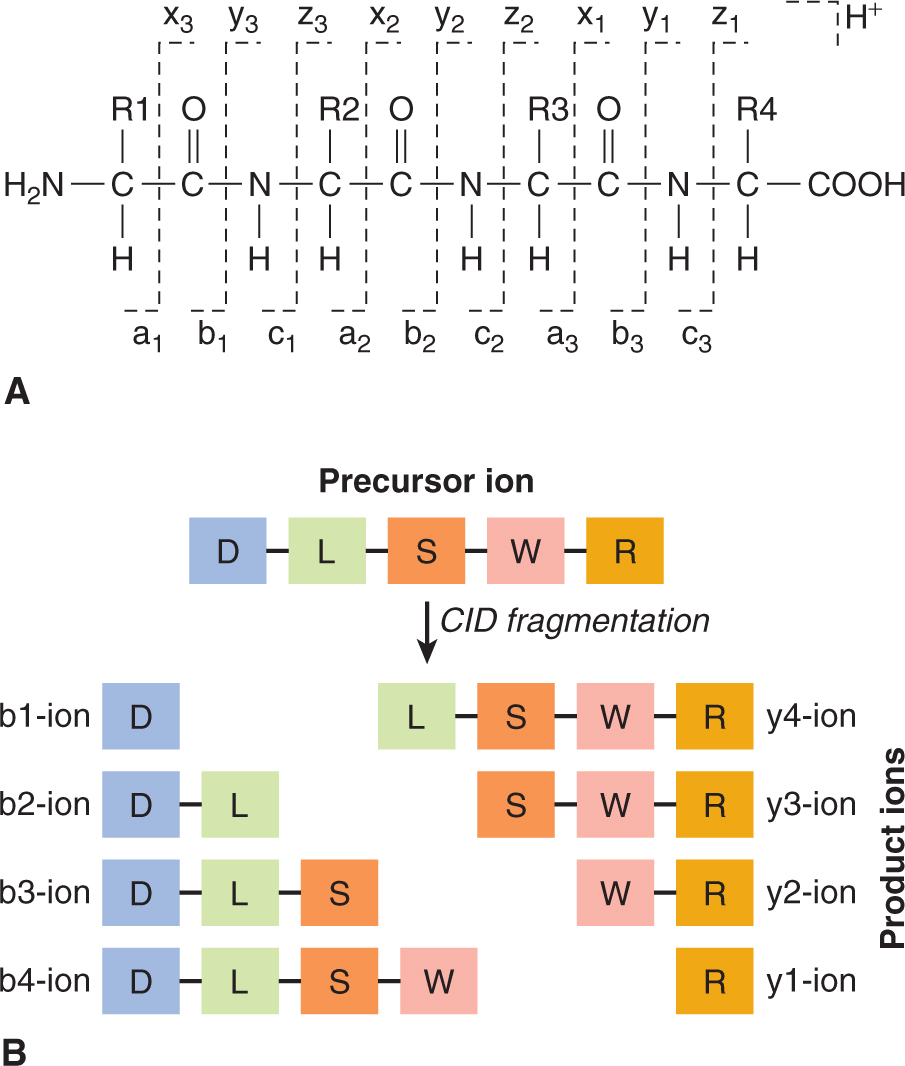
FIGURE 2–29 Schematic of peptide fragmentation by CID. A) Nomenclature of peptide fragments generated by CID. B) Cartoon of typical b- and y-type ions generated by CID fragmentation of a pentapeptide.
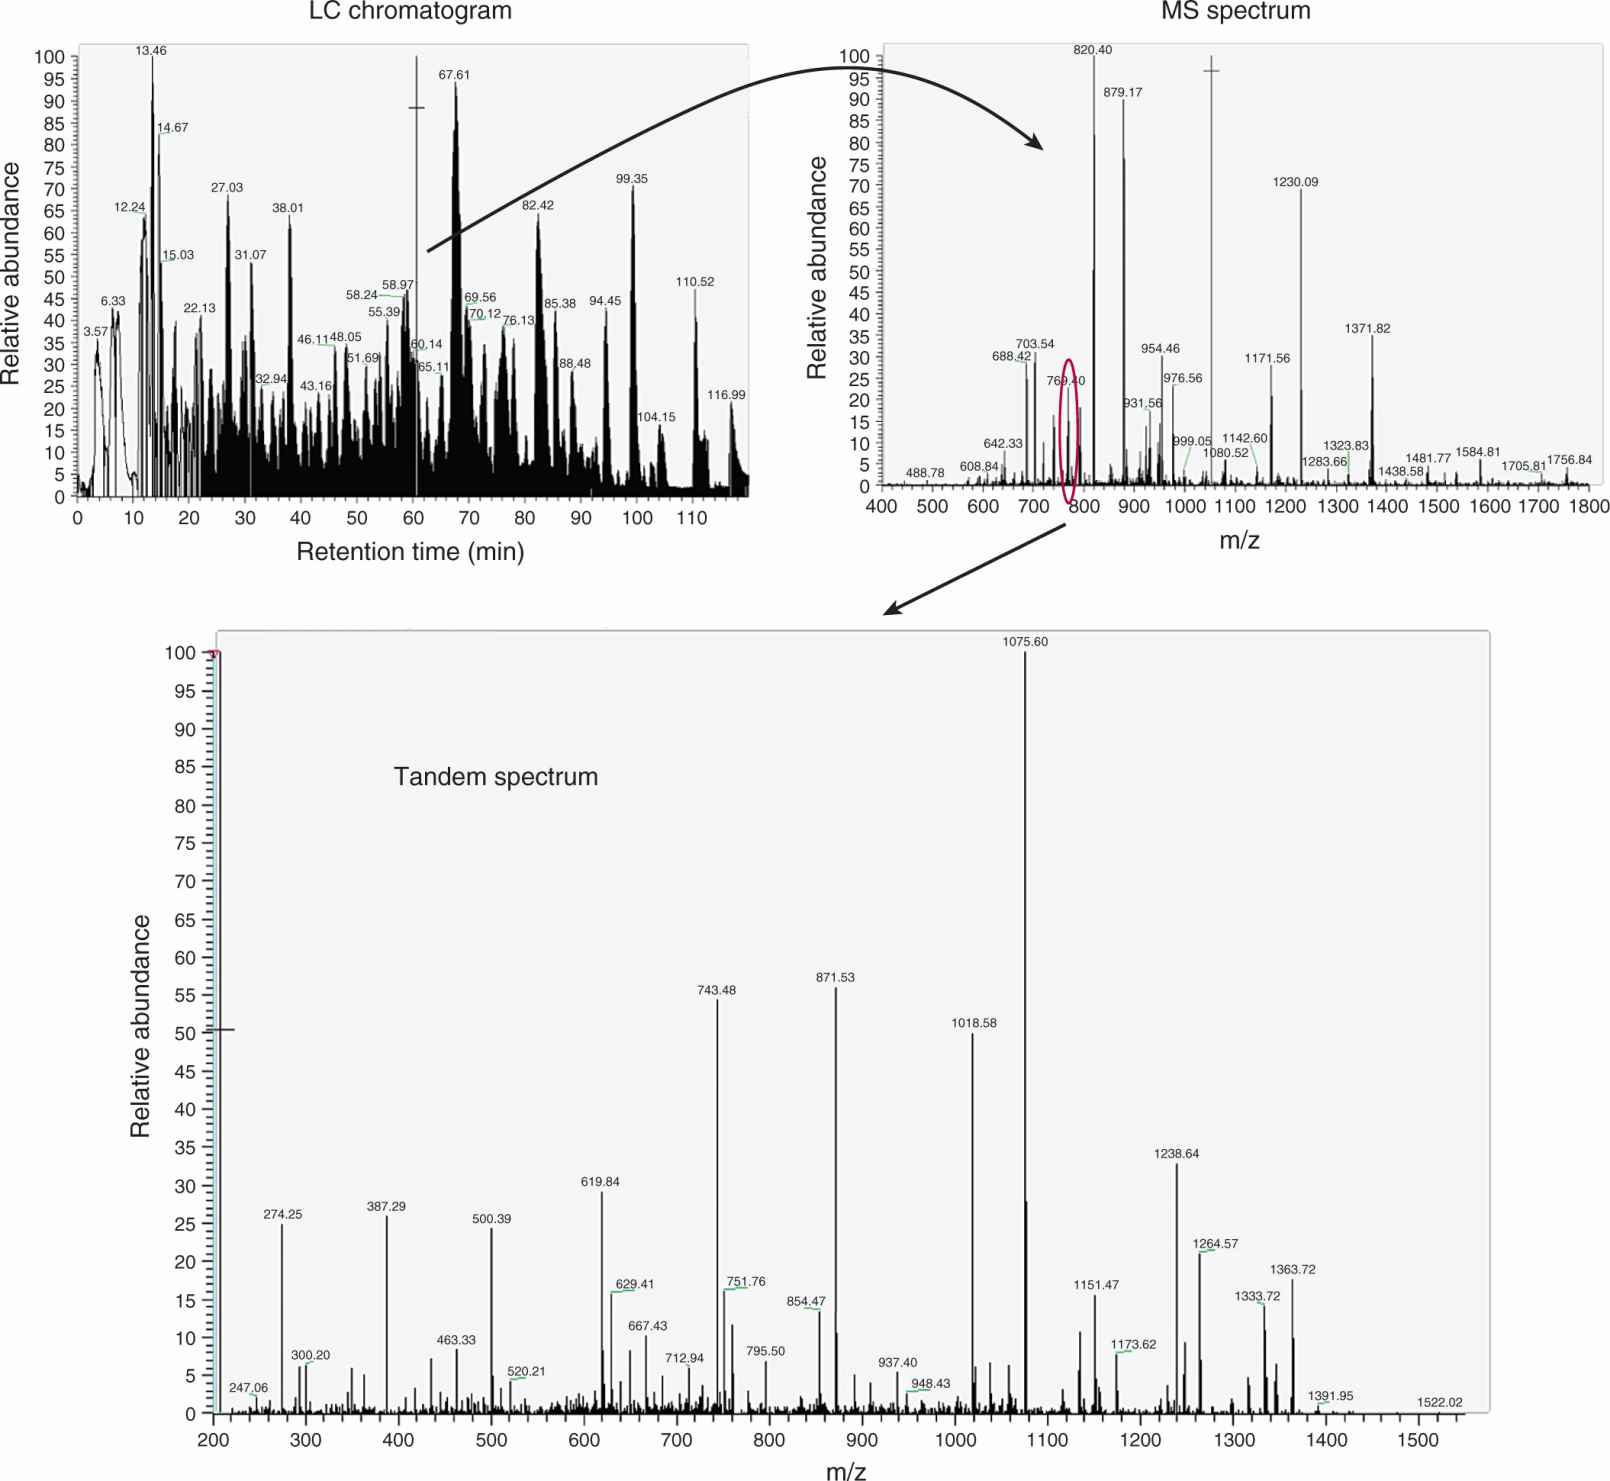
FIGURE 2–30 Screen shots of a typical “data-dependent” LC-MS experiment. Peptides are separated by nanoflow LC. Separated peptides are then analyzed by consecutive MS scans. First a MS spectrum of an intake parent ion is generated (ie, MS spectrum). An individual parent ion is then isolated by the mass analyzer and subjected to CID fragmentation resulting in a sequence specific tandem mass spectrum (ie, MS/MS spectrum).
Modern mass spectrometers are extremely fast scanning instruments, recording several hundred thousand spectra per day; computational spectral matching against available protein sequence databases is used for peptide/protein identification. To accomplish this task, several commercial (Sequest, Mascot) (Perkins et al, 1999) or open-source (X! Tandem, OMSSA, MyriMatch) algorithms are available. Careful interpretation of the results is crucial to assure high data quality and minimize false-positive and false-negative identifications. This process of automated spectral matching is highly dependent on the availability of well-annotated protein sequence databases, that correlate experimentally recorded spectra to theoretically generated spectra from the protein sequence database. It also requires that any potential PTM (posttranslational modification) needs to be specified prior to database correlation. More recently, algorithms for direct spectral searching, such as SpectraST, have been introduced. The main difference is that in spectral searching, experimental spectra are compared to experimental spectra that have been generated from the vast amount of proteomics data accumulated over the last decade.
Alternatively, proteins can be analyzed by top-down proteomics whereby intact proteins are directly ionized, fragmented by either ECD or ETD, and the resulting fragmentation pattern is used for protein identification (Kelleher, 2004). This strategy is less applicable to complex protein mixtures and is used mainly for the analysis of purified/enriched proteins. A potential advantage of top-down proteomics is that very high sequence coverage (ie, the majority of the protein’s primary amino acid sequence is observed in the mass spectrum) can be obtained for the analyzed proteins. The accurate assignment of posttranslational protein modification is another advantage of top-down proteomics.
2.5.3 Gel-Based or Gel-Free Approaches
Two approaches are available to fractionate samples just prior to ionization. In the early years of proteome research, 2-dimensional gel electrophoresis (2-DE) was used routinely for protein separation. Proteins were separated according to their isoelectric point (pI) via isoelectric focusing in the first dimension and according to their molecular mass using sodium dodecyl sulfate-polyacrylamide gel electrophoresis (SDS-PAGE) in the second dimension, resulting in so-called 2D proteome maps that could be compared. Poor reproducibility and bias against proteins with extremes in pI, molecular mass, or membrane proteins were some of the major drawbacks of this technology. More recently, the use of computer-controlled image analysis software packages and fluorescence-based staining protocols (eg, difference gel electrophoresis [DIGE]) (Marouga et al, 2005) have improved 2-DE, because 2 samples are analyzed in the same gel. This is made possible by the labeling of 2 independent protein samples by 2 different fluorophores. Following labeling samples are combined and analyzed on the same gel and visualized based on their different excitation wavelengths. Separated protein spots are excised, in-gel digested, and eventually identified by MS. Alternatively, proteins are separated by molecular mass using 1-dimensional gel electrophoresis (1D SDS-PAGE) and the entire gel is cut into individual gel blocks, followed by in-gel digestion and extraction of the resulting peptides from the gel matrix (Shevchenko et al, 1996). These resultant peptide mixtures are separated by LC and eluting peptides are identified by MS. This method is routinely used in modern proteomics laboratories and is termed gel-enhanced LC-MS or GeLC-MS.
In recent years, methods have also been developed to eliminate the use of gel-based separation. In these gel-free approaches, complex protein mixtures are first digested insolution, resulting in highly complex peptide mixtures, that are consecutively analyzed by LC-MS. In general, nanobore LC columns (75- to 150-mm inner diameter and packed with reversed-phased chromatography resin) are used for peptide separation (termed shotgun proteomics) (Wolters et al, 2001). Peptides are separated and ions are directly electrosprayed into the mass spectrometer.
An alternative gel-free approach relies on a methodology termed multidimensional protein identification technology (MudPIT) (Washburn et al, 2001; Wolters et al, 2001), which is similar to 2-DE, and separates peptides by 2 orthogonal chromatographic resins: strong cationic exchange (SCX) and reversed phase (RP18). This 2D shotgun proteomics approach enables better peptide separation, ultimately resulting in the detection of lower abundance proteins.
2.5.4 Quantitative Proteomics
Quantifying proteins on a proteome level is a challenging analytical task, and not every protein identified can be accurately quantified. Some of the commonly used strategies for quantitative proteomics are based on the labeling of proteins with stable isotopes, similar to what has been used for quantitative MS of small molecules.
The 3 commonly used approaches to quantify proteins using isotope labeling are ICAT, SILAC, and iTRAQ. In the ICAT (isotope-coded affinity tags) approach, the relatively rare amino acid cysteine is chemically modified by the ICAT reagent. The ICAT label contains a chemical group that reacts specifically with cysteine moieties, and contains a linker region (which contains the light or heavy isotopes) and a biotin group for efficient affinity purification of labeled peptides. Briefly, protein lysates are either labeled with a light ICAT reagent (1H or 12C) or with the heavy analog (2H or 13C). The protein lysates are then combined (1:1 mixture), digested with trypsin, and labeled peptides purified by affinity chromatography using the biotin moiety (ie, streptavidin column). Resulting peptide mixtures are then analyzed by LC-MS to identify and quantify the relative levels of peptides/proteins in the mixture. Briefly, identification occurs as described above via spectral correlation of the resulting MS/MS spectra against protein sequence database using algorithms such as Sequest. Relative quantification requires the integration of the area under the curves for both the light and the heavy labeled peptides. This is accomplished by extraction parent ion intensities over time (ie, chromatographic retention time as these ions enter the MS). Because both the light and heavy isotopes have identical biophysical properties, they will coelute from the LC columns, but are separated by the MS as a result of their different mass. Comparison of the areas under the curves for both ions will provide relative quantification.
SILAC (stable isotope labeling with amino acids in cell culture) involves the addition of an essential amino acid (ie, light or heavy isotope version of lysine) to the cell culture medium, resulting in its metabolic incorporation into newly synthesized proteins (Ong et al, 2002). After complete labeling of the cellular proteome (ie, keeping cells in culture for several divisions), cells are lysed, combined at a 1:1 ratio and analyzed by MS as described above. Relative peptide quantification is accomplished by integration of the parent ion peak of either the light or heavy peptide ion. This procedure has been used recently for the relative quantification of tissue proteomes by metabolically labeling entire model organisms (Kruger et al, 2008).
iTRAQ (isobaric tag for relative and absolute quantitation) enables relative peptide quantification in the MS/MS mode (Ross et al, 2004). Primary amines (lysine side chains and/or the N-terminus) are covalently labeled by the iTRAQ reagent. Tryptic peptide mixtures, from 4 or 8 different experimental conditions, are individually labeled, combined, and analyzed by LC-MS. In contrast to the ICAT reagent, the individual iTRAQ labels have the same mass, resulting in the identical peptide mass for the same peptide isolated from individual experimental conditions. Upon fragmentation of a given parent ion via CID, the iTRAQ reagent will release a specific reporter ion for each experimental condition. The relative peak intensity of these reporter ions is used to quantify an individual peptide within the different experimental conditions (Fig. 2–31).
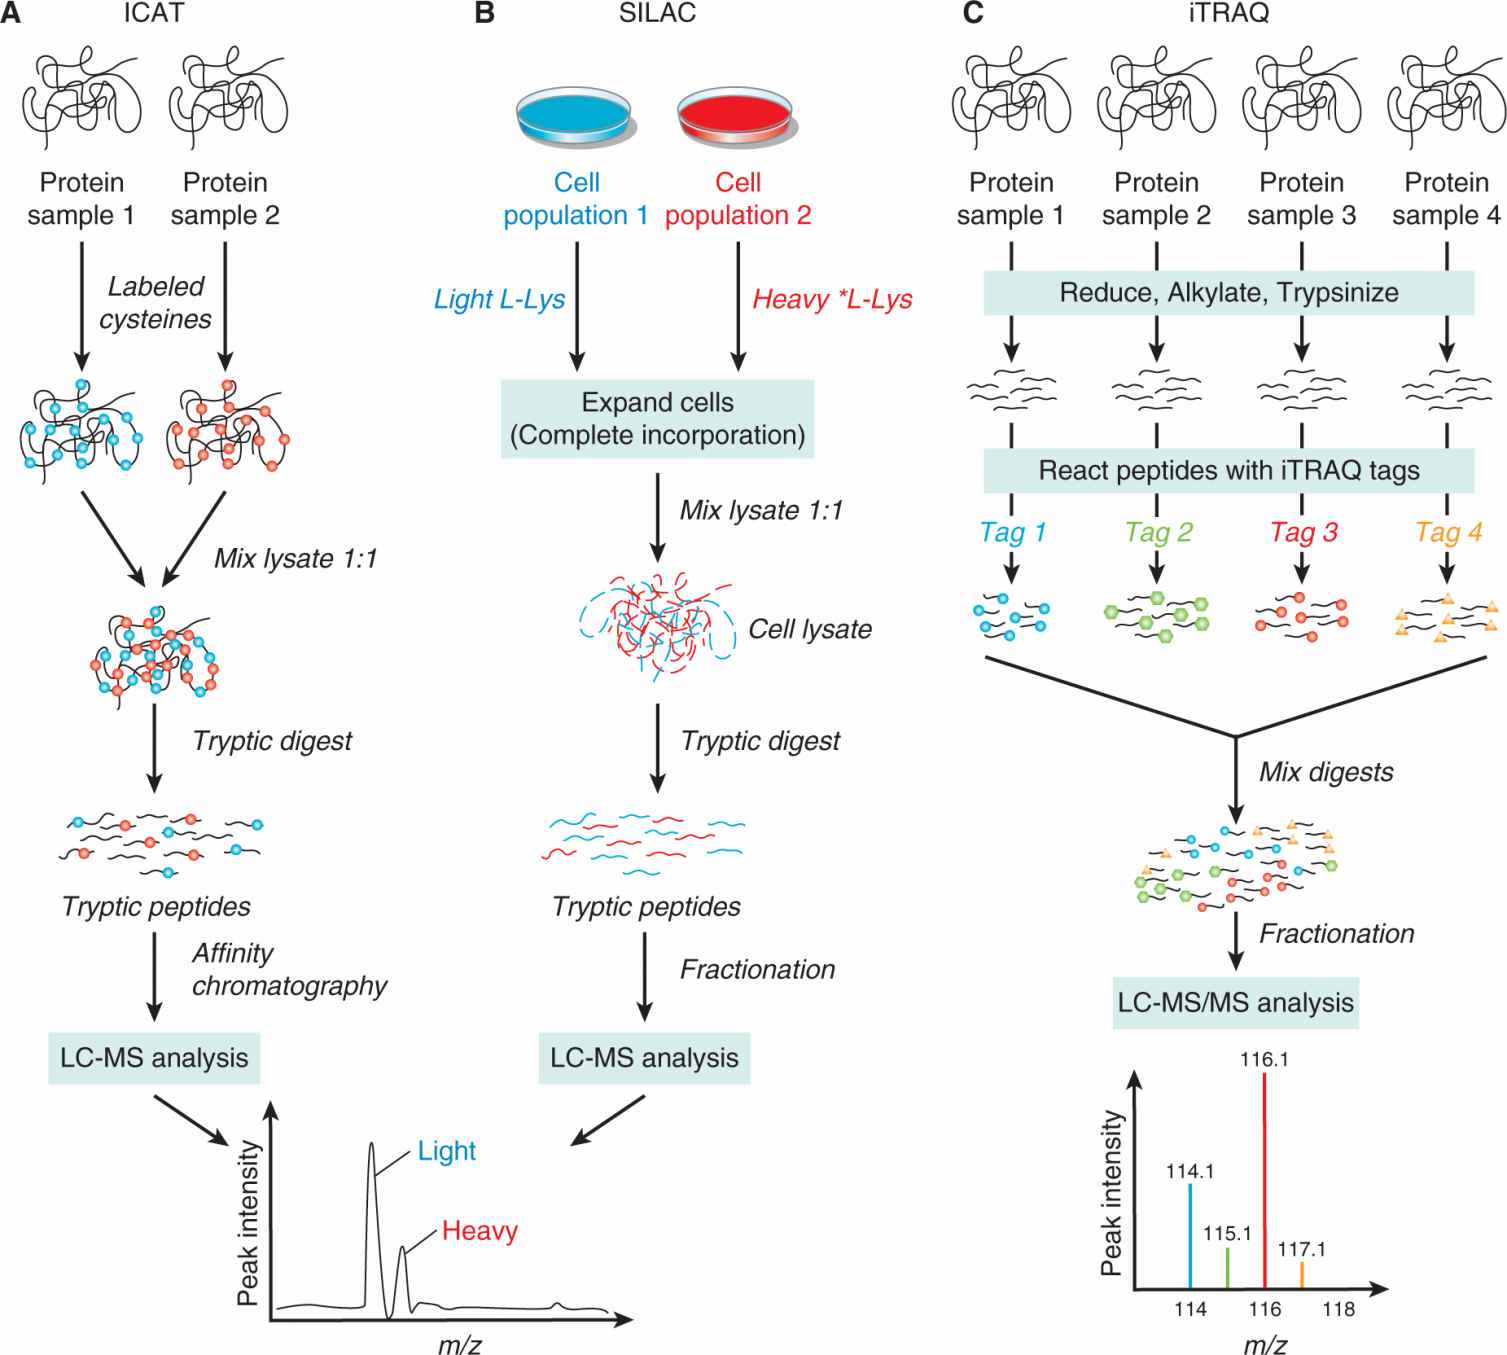
FIGURE 2–31 Graphic demonstration of the workflow of 3 proteomic methodologies developed to utilize stable isotope technology for quantitative protein profiling by mass spectrometry. A) ICAT can be used to label 2 protein samples with chemically identical tags that differ only in isotopic composition (heavy and light pairs). These tags contain a thiol-reactive group to covalently link to cysteine residues, and a biotin moiety. The ICAT-labeled fragments can be separated, and quantified by LC-MS analysis. B) SILAC is a similar approach to quantify proteins in mammalian cells. Isotopic labels are incorporated into proteins by metabolic labeling in the cell culture. Cell samples to be compared are grown separately in media containing either a heavy (red) or light (blue) form on an essential amino acid such as L-lysine that cannot be synthesized by the cell. C) iTRAQ is a unique approach that can be used to label protein samples with 4 independent tag reagents of the same mass that can give rise to 4 unique reporter ions (m/z = 114 to 117) upon fragmentation in MS/MS. This recorded data can be subsequently used to quantify the 4 different samples, respectively.
Some of the drawbacks of these reagents are the high cost, extensive data processing requirements (ie, integration of thousands of peptide ions), and the relatively low number of experimental conditions that can be compared (2 to 8 conditions depending on the reagent). To overcome some of these problems, label-free peptide/protein quantification was developed using spectral counting and label-free peak integration. Spectral counting uses the total, redundant number of tandem mass spectra (ie, spectral counts) recorded by MS/MS for each identified protein, as a semiquantitative measure of relative protein abundance (Liu et al, 2004) and is not limited by the number of analyzed samples. Thus, an unlimited number of experimental conditions could be compared.
Label-free peak integration is conceptually similar to the peptide quantification used by isotope labeling technologies but the major difference is that individual experimental conditions are not combined (ie, light and heavy isotope), but analyzed individually by LC-MS. Therefore, chromatographic peaks need to be carefully aligned prior to integration/quantification, which is an extensive computational procedure.
2.5.5 Challenges for Biomarker Discovery with Proteomics
MS-based proteomics has the ability to identify and quantify hundreds to thousands of proteins in complex biological samples and has been used extensively for biomarker discovery (Faca et al, 2007; Jurisicova et al, 2008). Nonetheless, few such studies have been validated biologically and introduced into clinical practice. Some of the challenges of proteomics based biomarker discovery are: (a) extreme complexity of biological samples; (b) the heterogeneity of the disease and of the human population; (c) the difficulty to obtain accurate quantification for all proteins in the course of a discovery proteomics experiment; (d) the availability of adequate, well annotated human samples (tissue or body fluids); and (e) the expensive and very time-consuming process of proteomics-based biomarker discovery. Several analysis strategies were proposed and applied in recent years. The combination of extensive discovery-based proteomics on a limited number of patient samples, followed by the accurate quantification of putative biomarker candidates using targeted proteomics approaches (ie, Selected Reaction Monitoring, SRM-MS) is considered the most promising strategy (Fig. 2–32).
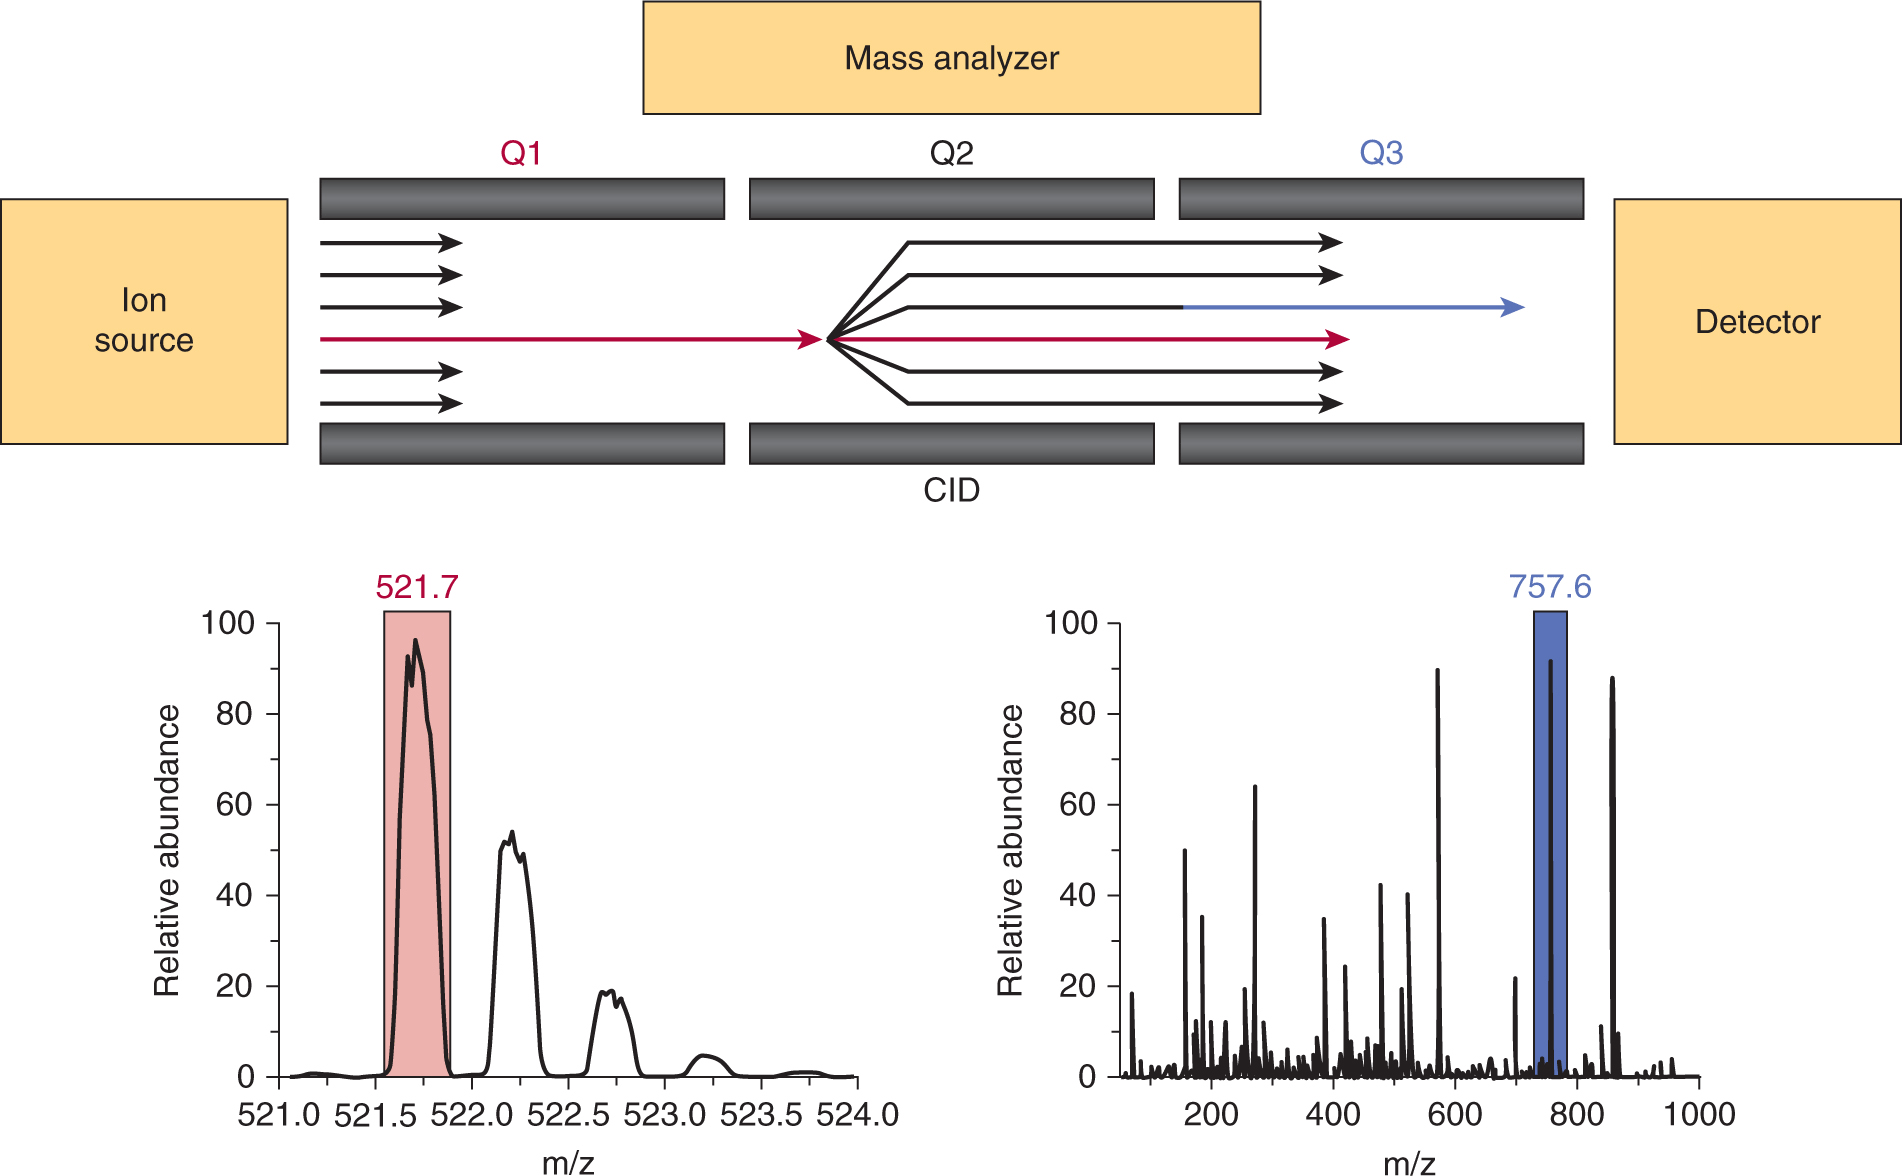
FIGURE 2–32 Schematic of a targeted proteomics experiment based on selected reaction monitoring-mass spectrometry (SRM-MS). Peptides that elute off an LC column are ionized by ESI and resulting ions are guided into the first quadrupole (Q1). This quadrupole works as a mass filter and transfers only peptide ions of interest (based on a predefined m/z value) into the second quadrupole (Q2), in which an inert gas induces fragmentation. All fragments are transferred into the third quadrupole (Q3), which, like Q1, acts as a mass filter, so that only few, select fragment ions will trigger a signal at the detector. The area under the curve of these ions can be used for quantification.
2.5.6 X-Ray Crystallography
X-ray crystallography is a technique in which a high intensity x-ray beam is directed through the highly ordered crystalline phase of a pure protein. The regular array of electron density within the structure of the crystalline protein diffracts the x-rays so that the diffracted x-rays interfere constructively, giving rise to a unique diffraction pattern (detected on an x-ray imaging screen or film). From the diffraction pattern the distribution of electrons in the molecule (an electron density map) is calculated and a molecular model of the protein is then progressively built into the electron density map.
A critical step in this process is the generation of crystals of the protein of interest, which is a trial-and-error procedure in which a variety of solvent conditions are tested in multiple well plates with protein crystals almost always grown in solution. Crystal growth in solution is characterized by 2 steps: nucleation of a microscopic crystallite (possibly having only 100 molecules), followed by growth of that crystallite, ideally to a diffraction-quality crystal (Chernov, 2003). The solution conditions that favor the first step (nucleation) are not always the same conditions that favor the second step (subsequent growth). Ideally, solution conditions should favor the development of a single, large crystal, as larger crystals offer improved resolution upon diffraction.
Generally, favorable conditions are identified by screening; a very large batch of the protein molecules is prepared, and a wide variety (up to thousands) of crystallization solutions are tested (Chayen, 2005). Thereafter, various conditions are used to lower the solubility of the molecule, including change in pH or temperature, adding salts or chemicals that lower the dielectric constant of the solution, or adding large polymers, such as polyethylene glycol, that drive the molecule out of solution. These methods require large amounts of the target molecule, as they use high concentration of the molecule(s) to be crystallized. Because of the difficulty in obtaining such large quantities (milligrams) of crystallization-grade protein, robots have been developed that can accurately dispense crystallization trial drops that are only approximately 100 nanoliters in volume (Stock et al, 2005). Highly pure protein (usually from recombinant sources) is divided into a series of small drops of aqueous buffers that often contain 1 or more cosolvents or precipitants. The drop is left to slowly evaporate or equilibrate with a reservoir solution (in the same well), and if conditions are favorable, the protein slowly comes out of solution in a crystalline form. This represents the limiting step in crystallography as the conditions may vary greatly from one protein to another, and it is impossible to know a priori under which conditions, if any, a given protein will crystallize. Indeed, not every protein will crystallize, and often researchers try individual domains or multiple domains within a given protein or homologous proteins from other species in order to find a combination of protein and conditions that will yield a well-diffracting crystal.
When a crystal is mounted and exposed to an intense beam of x-rays, it scatters the x-rays into a pattern of spots or reflections that can be observed on a screen behind the crystal. The relative intensities of these spots provide the required information to determine the arrangement of molecules within the crystal in atomic detail. The intensities of these reflections may be recorded with photographic film, an area detector or with a charge-coupled device (CCD) image sensor. The recorded series of 2-dimensional diffraction patterns, each corresponding to a different crystal orientation, is converted into a 3-dimensional model of the electron density. Each spot corresponds to a different type of variation in the electron density; the crystallographer must determine which variation corresponds to which spot (indexing), the relative strengths of the spots in different images (merging and scaling), and how the variations should be combined to yield the total electron density (phasing).
The final step of fitting the atoms of the protein into the electron density map requires the use of interactive computer graphics programs, or semiautomated programs if the data is of sufficient quality and resolution. Initially the electron density map contains many errors, but it can be improved through a process called refinement in which the atomic model is adjusted to improve the agreement with the measured diffraction data. The quality of an atomic model is judged through the standard crystallographic R-factor, which is a measure of how well the atomic model fits the experimental data.
The fine details revealed by high-resolution x-ray structures are useful to understand the principles of molecular recognition in protein-ligand complexes (Fig. 2–33). For example, the structure of imatinib bound to c-Abl kinase domain is an example of the application of this approach. Imatinib is a potent and selective inhibitor of the chronic myeloid leukemia-related translocation product of bcr-abl, making it an effective therapy for chronic myelogenous leukemia (CML; see Chap. 7, Sec. 7.5 and Chap. 17, Sec. 17.3). It was discovered by using high-throughput screening of compound libraries to identify the 2-phenylaminopyrimidine class of kinase inhibitors. The pharmaceutical properties of these compounds were then optimized through successive rounds of medicinal chemistry and evaluation of structure-activity relationships. Ultimately, the structural mechanism of the inhibition of bcr-abl by imatinib was shown by x-ray crystallography to involve binding by the inhibitor to inactive kinase structure of the enzyme (the kinase exists in active and inactive forms). The inactive form is the more unique conformation of the enzyme (relative to other similar kinases), thereby explaining its relatively few side effects (Schindler et al, 2000).
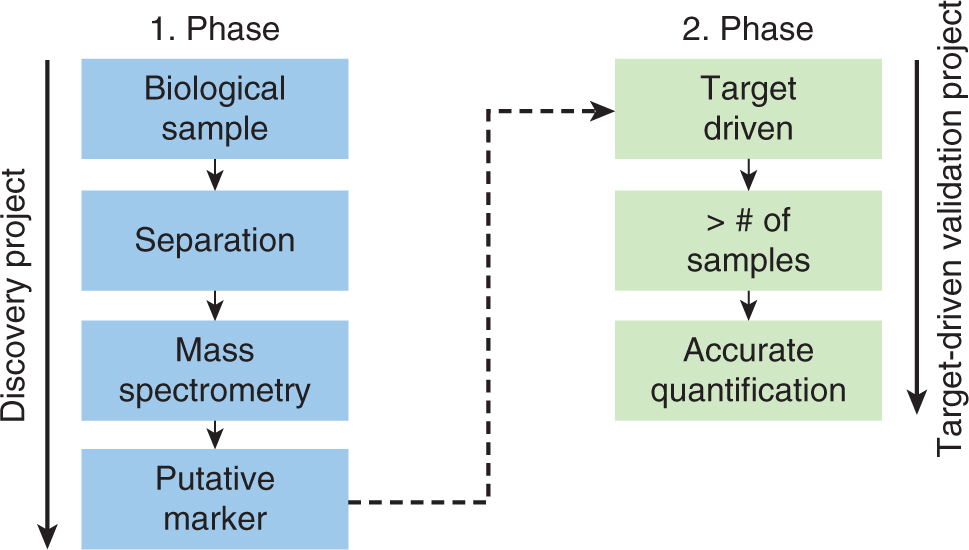
FIGURE 2–33 Schematic of a typical biomarker experiment. In the discovery project (1. Phase) a limited number of biological samples are separated to reduce sample complexity. Individual fractions are then analyzed by mass spectrometry to generate putative biomarkers for verification. In the target-driven validation project (2. Phase) targeted MS-assays (ie, SRM-MS) are developed for each putative candidate marker. This approach allows to significantly increase the sample throughput and provides accurate quantification in a multiplexed manner.
2.5.7 Nuclear Magnetic Resonance Spectroscopy
NMR spectroscopy takes advantage of a fundamental property of the nuclei of atoms called the nuclear spin (see Chap. 14, Sec. 14.3). When placed in a static magnetic field, nuclei with nonzero spin will align their magnetic dipoles with (low-energy state) or against (high-energy state) the magnetic field. Under normal circumstances there is a small difference in the population distribution between the 2 energy states, thereby creating a net magnetization, which is then manipulated using multiple electromagnetic pulses (and delays) which help to clarify the types of connections between nuclei. Each nucleus absorbs energy from these pulses at a characteristic frequency that is dependent on its chemical properties and the surrounding environment, including the conformation of the molecule and its nearest neighbor nuclei. Structures of noncrystalline proteins in aqueous solution are derived from a series of NMR experiments that reveal interactions of nuclei close together in 3-dimensional space, even though they are distant within the protein primary sequence. These data allow one to calculate an ensemble of protein conformations that satisfy a large number (hundreds to thousands) of experimental restraints. This necessitates extensive data collection (often more than 10 experiments lasting hours to days) and computer-assisted analysis of the spectra in order to calculate a structure.
The main nucleus observed by NMR is that of hydrogen (1H). However, proteins have hundreds to thousands of 1H signals, many with the same resonance frequency. This problem is solved by the use of multidimensional NMR, in which protein samples are labeled with the NMR-active stable isotopes,15 N and 13C. The incorporation of stable isotopes is required to resolve the large number of signals in 2, 3, or 4 dimensions, each dimension corresponding to 1H, 15N, and/or 13C resonance frequencies. Because of the poor signal-to-noise ratio of the NMR signals in large proteins, the size of proteins amenable to high-resolution NMR structural studies is limited to approximately 30 kilodaltons (kDa) or less. Recent developments have made it possible to study larger molecules by using partial or full deuteration (ie, incorporation of heavy hydrogen) in combination with special NMR techniques, resulting in lower-resolution structural information. Samples typically need to be concentrated; this requirement makes it difficult to study proteins with low solubility or those that are prone to aggregation or precipitation. Much time is devoted in optimizing the stability and solubility of a protein prior to study by NMR spectroscopy.
2.5.8 Protein Arrays
A protein microarray provides an approach to characterize multiple proteins in a biological sample. There are 3 types of protein microarrays (Fig. 2–34). Functional protein arrays display folded and active proteins and are designed to assay functional properties (Zhu and Snyder, 2003). They are used for screening molecular interactions, studying protein pathways, identifying targets for protein-targeted molecules, and analyzing enzymatic activities. In analytical or capture arrays, affinity reagents (eg, antibodies) or antigens (that may be nonfolded) are arrayed for profiling the expression of proteins (Sanchez-Carbayo et al, 2006) or for the quantification of antibodies in complex samples such as serum. Applications of antibody arrays include biomarker discovery and monitoring of protein quantities and activity states in signaling pathways. Antigen arrays are applied for profiling antibody repertoires in autoimmunity, cancer, infection or following vaccination. Moreover, antigen arrays are tools for controlling the specificity of antibodies and related affinity reagents. Reverse-phase arrays comprise cell lysates or serum samples. Replicates of the array can then be probed with different antibodies. Reverse-phase arrays are particularly useful for studying changes in the expression of specific proteins and protein modifications during disease progression and, thus, are applied primarily for biomarker discovery.
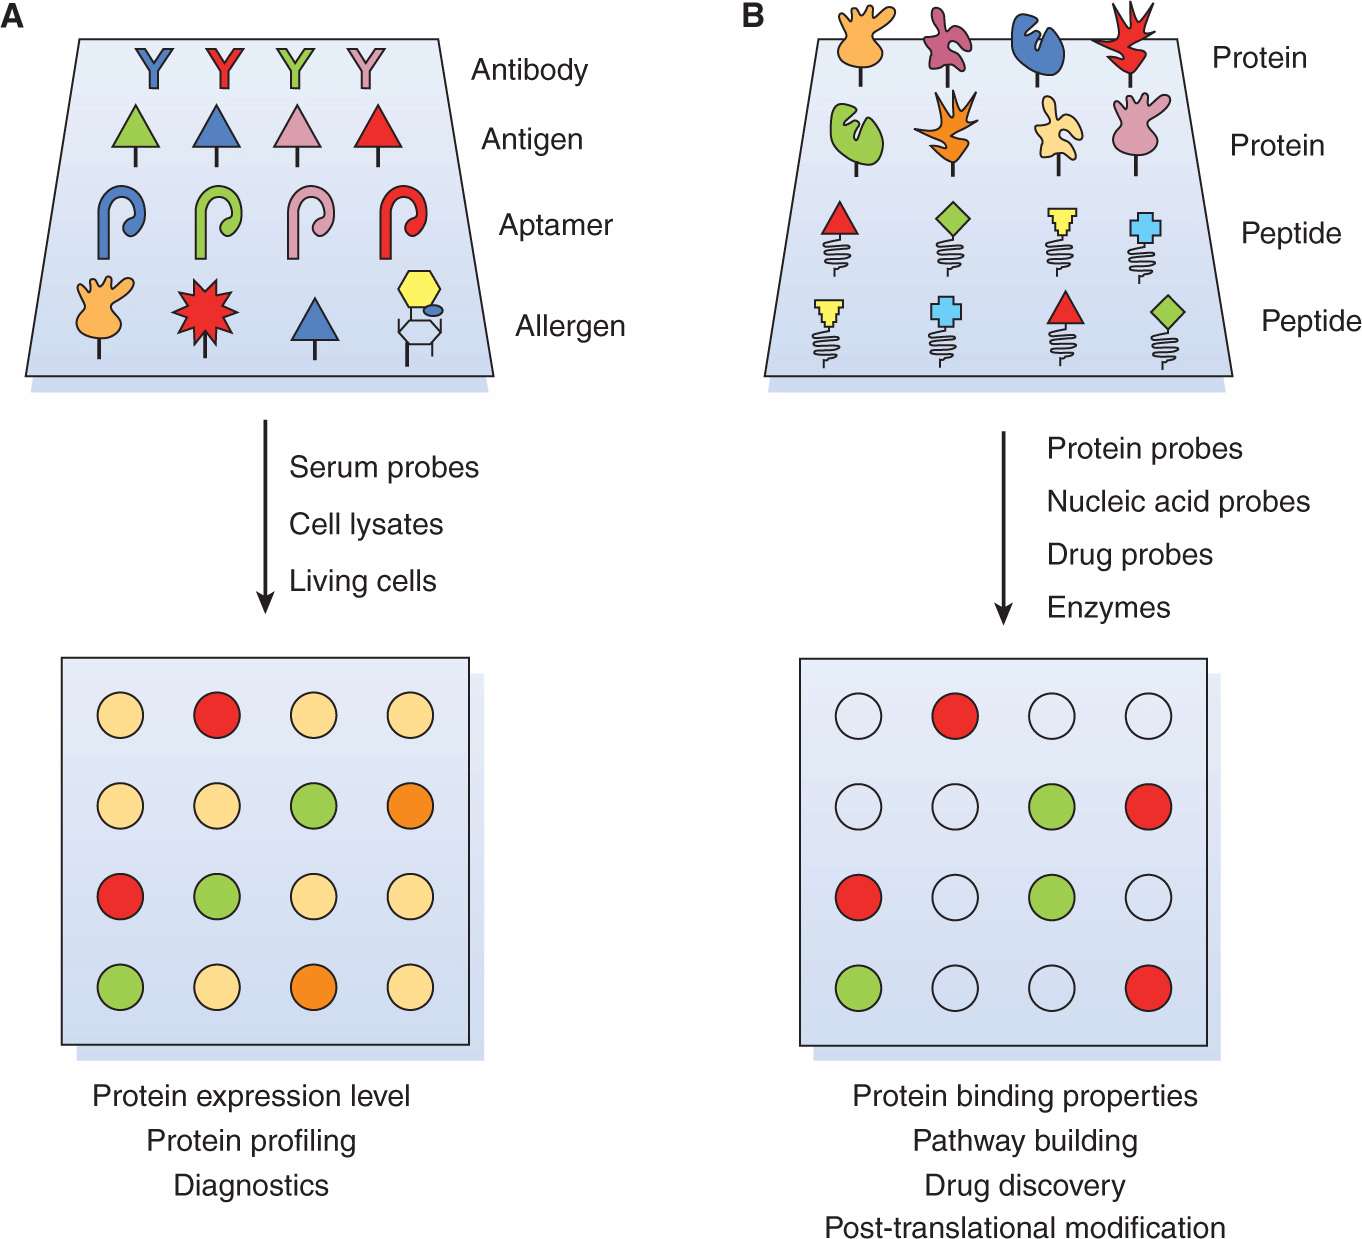
FIGURE 2–34 A) Analytical protein microarray. Different types of ligands, including antibodies, antigens, DNA or RNA aptamers, carbohydrates, or small molecules, with high affinity and specificity, are spotted down. These chips can be used for monitoring protein expression level, protein profiling, and clinical diagnostics. Similar to the procedure in DNA microarray experiments, protein samples from 2 biological states to be compared are separately labeled with red or green fluorescent dyes, mixed, and incubated with the chips. Spots in red or green color identify an excess of proteins from one state over the other. B) Functional protein microarray. Native proteins or peptides are individually purified or synthesized using high-throughput approaches and arrayed onto a suitable surface to form the functional protein microarrays. These chips are used to analyze protein activities, binding properties and posttranslational modifications. With the proper detection method, functional protein microarrays can be used to identify the substrates of enzymes of interest. Consequently, this class of chips is particularly useful in drug and drug-target identification and in building biological networks. (From Phizicky et al, 2003.)
2.6 TRANSLATIONAL APPLICATIONS WITH CELLS AND TISSUES
Genetic or epigenetic analysis of primary human tumors (or other tissues) requires access to appropriately handled material. Generally, human tumor or tissue samples are fixed in formalin and then embedded in paraffin wax to preserve cell and tissue morphology for histological analysis as part of diagnostic procedures. Formalin fixation is a rather erratic process with thick tissue sections requiring the formalin to diffuse into the tissue resulting in unequal protein preservation. Only seldom are tissues snap-frozen after an operation (or biopsy) so as to improve preservation of cellular antigens or mRNA. These limitations, as well as the presence of stroma, immune infiltrates, and other secreted proteins, create a number of difficulties for identifying genetic or epigenetic changes specifically associated with the tumor cells (or the stromal cell populations), emphasizing the need to develop better techniques to isolate individual cells from tissue sections for further study.
Fortunately, despite the fact that formalin crosslinks proteins, it has little effect on the structural integrity of DNA or miRNAs. Therefore, the ability to use FISH on paraffin-embedded archival specimens is dependent only on the accessibility of the target DNA within the cell nucleus, and can be enhanced by pretreatment that increases the efficiency of hybridization. Such protocols are now routinely used for the analysis of HER2 in breast cancer tissues. Similarly, miRNAs can be retrieved from formalin-fixed tissue with reasonable success. Although there are protocols for extracting mRNA from archival formalin fixed tissue, its tendency to be degraded by ubiquitous RNases limits the performance of these assays.
Hematological malignancies aside, where it is much easier to retrieve the malignant cells, the development of a number of techniques over the last 10 years has enhanced substantially the ability of scientists to isolate and rapidly analyze cells and tissue from solid tumors.
2.6.1 Laser-Capture Microdissection
One problem associated with the molecular genetic analysis of small numbers of tumor cells is that substantial numbers of normal cells will often be present and can confound interpretation. Because these stromal and various infiltrating cells are scattered throughout a tumor section, it is rarely possible to dissect a pure population of tumor cells cleanly. This problem has been circumvented by the use of laser capture microdissection, in which sections (usually from frozen tissue) are coated with a clear ethylene vinyl acetate (EVA) polymer prior to microscopic examination (Emmert-Buck et al, 1996). Tumor cells can be captured for subsequent analysis by briefly pulsing the area of interest with an infrared laser. The EVA film becomes adherent and will selectively attach to the tumor cells directly in the laser path. When sufficient cells have been fused to the EVA film, it is placed into nucleic acid extraction buffers and used for PCR or other molecular analyses (Fig. 2–35). One application of laser capture microdissection is whole-genome amplification of captured cells, for example from a small number of tumor-derived cells. A variety of techniques including random PCR allow for the global amplification of all DNA sequences present in the microdissected samples, thereby increasing globally the amount of DNA for subsequent analysis. The method can also be adapted to generate representative amplification of the mRNA in a small number of cells. The technique has been useful in providing DNA for molecular genetic studies using microdissected DNA from paraffin blocks, cDNA from single-cell RT-PCR reactions, and chromosome band-specific probes derived for micro-dissected chromosomal DNA.
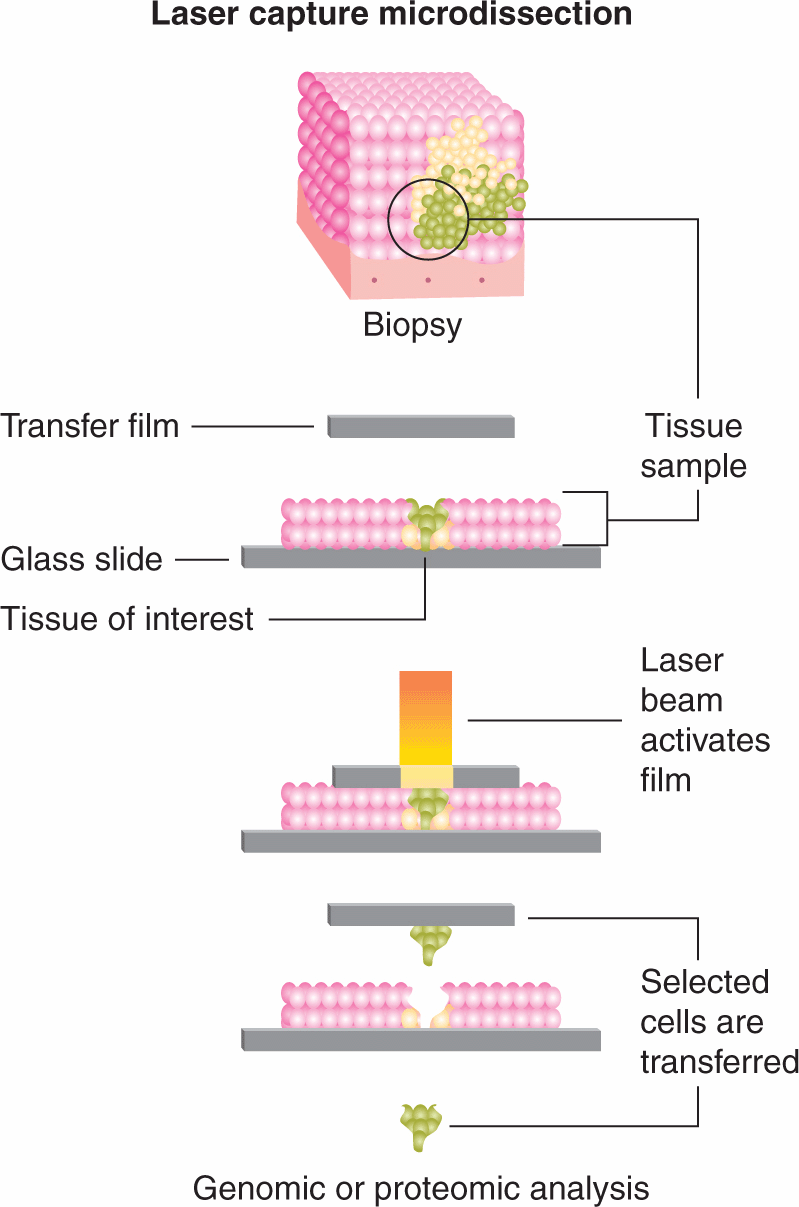
FIGURE 2–35 Outline of the process of laser-capture microdissection. Under a microscope–software interface, a tissue section (typically 5 to 50 μm thick) is assessed and cells are identified for the selection of targets for isolation. In general, collection technologies use an UV-pulsed laser for cutting the tissues directly, sometimes in combination with an infrared (IR) laser responsible for heating/melting a sticky polymer for cellular adhesion and isolation. After the collection, the tissue can be processed for protein, RNA, or DNA downstream analyses. (From http://www.cancer.gov/cancertopics/understandingcancer/moleculardiagnostics/page29.)
2.6.2 Tissue Microarrays
Tissue microarray (TMA) technology provides a method of relocating tissue from conventional histological paraffin blocks so that tissue from multiple patients (or multiple blocks from the same patient) can be analyzed on the same slide. The microarray technique (Kononen et al, 1998), introduced a high-precision punching instrument that enabled the exact and reproducible placement and relocalization of distinct tissue samples. The construction of a TMA starts with the careful selection of donor tissues and precise recording of their localization. The slides must be reviewed so that suitable donor blocks can be selected and the region of interest defined on a selected paraffin wax block. Needles with varying diameters of 0.6 mm up to 2.0 mm are used to punch tissue cores from a predefined region of the tissue block embedded in paraffin wax. A hematoxylin and eosin stained slide arranged beside the donor block surface is used for orientation (Fig. 2–36). Tissue cores are transferred to a recipient paraffin wax block, into a ready-made hole, guided by a defined x–y position. This technique minimizes tissue damage and still allows sections to be cut from the donor paraffin wax block with all necessary diagnostic details, even after the removal of multiple cores. The number of cores in the recipient paraffin block varies, depending on the array design, with the current comfortable maximum using a 0.6-mm needle being approximately 600 cores per standard glass microscope slide. New techniques may allow as many as 2000 or more cores per slide. Using this method, an entire cohort of samples (eg, from different patients) can be analyzed by staining just 1 or 2 master array slides, instead of staining hundreds of conventional slides. Each core on the array is similar to a conventional slide in that complete demographic and outcome information is maintained for each patient contributing that core, so that rigorous statistical analysis can be performed when the arrays are analyzed.
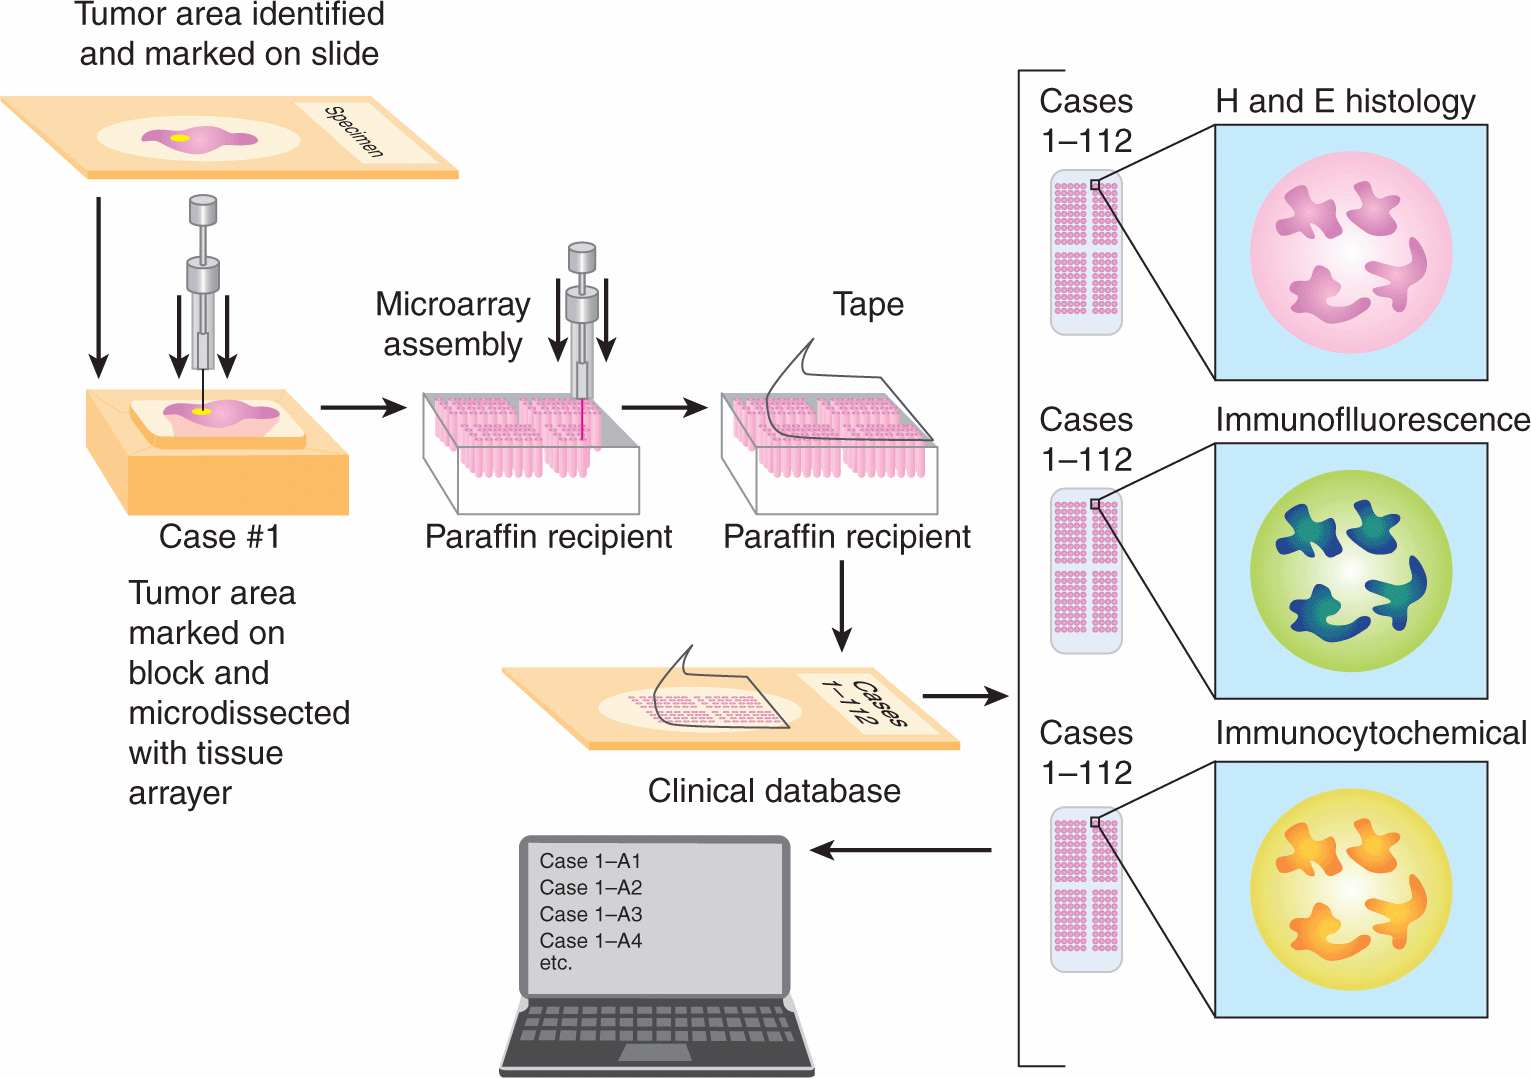
FIGURE 2–36 Outline of the process of TMA assembly. In the TMA technique, a hollow needle is used to remove tissue cores as small as 0.6 mm in diameter from regions of interest in paraffin-embedded tissues, such as clinical biopsies or tumor samples. These tissue cores are then inserted in a recipient paraffin block in a precisely spaced, array pattern, usually along with control samples. Sections from this block are cut using a microtome, mounted on a microscope slide and then analyzed by any method of standard histological analysis. Each microarray block can be cut into 100 to 500 sections, which can be subjected to independent tests. The number of spots on a single slide varies, depending on the array design, the current comfortable maximum with the 0.6-mm needle being about 600 spots per standard glass microscope slide. New technologies are under development that may allow as many as 2000 or more sections per slide. (Adapted from http://apps.pathology.jhu.edu/blogs/pathology/wp-content/uploads/2010/05/Tissue_Microarray_Process.jpg.)
The TMA approach has been criticized for its use of small punches of usually only a 0.6-mm diameter from tumors with much larger diameter (up to several centimeters) when there is considerable heterogeneity in the tissue sample or the marker of interest being studied. Several experimental and clinicopathological efforts have been made to reduce these concerns and they can be alleviated by including multiple cores from each patient block on the array (Rubin et al, 2002; Eckel-Passow et al, 2010). For example, the grading of breast cancer is dependent on the presence and number of mitoses. Because this important parameter of breast grading is evaluated mainly at the periphery of the tumor, breast cancer arrays focusing on proliferation markers should be mainly composed of punches taken from the periphery of the original tumor. Other studies show that the frequency of prognostically significant gene amplifications in a series of invasive breast cancers, such as erbB2 or cyclin D1, is similar after TMA analysis to frequencies described in the literature using other techniques (Kononen et al, 1998).
2.6.3 Flow Cytometry
Flow cytometry enables the analysis of multiple parameters of individual cells using a suspension of heterogeneous cells. The flow cytometer directs a beam of laser light of a single wavelength onto a hydrodynamically focused stream of saline solution, optimally of only 1 cell in diameter (Fig. 2–37). A number of fluorescent detectors are aimed at the point where the stream passes through the light beam: 1 in line with the light beam (forward scatter) and several beams perpendicular to it (side scatter). Each suspended cell passes through the beam and thus scatters the light. In addition, fluorescent chemicals found in the cell or attached to it may be excited and emit light at a longer wavelength than the light source. Forward scatter correlates with the cell size and side scatter depends on the inner complexity or granularity of the cell (ie, shape of the nucleus, the amount and type of cytoplasmic granules or the membrane roughness). By analyzing fluctuations in brightness at each detector (1 for each fluorescent emission peak), it is possible to derive various types of information about the physical and chemical properties of each individual particle. For example, fluorescently labeled antibodies can be applied to cells, or fluorescent proteins can be contained in cells. Modern flow cytometers are able to analyze several thousand cells every second, in “real time,” and can separate, analyze, and isolate cells having specified properties. Acquisition of data is achieved by a computer using software that can adjust parameters (eg, voltage and compensation) for the sample being tested. Modern instruments usually have multiple lasers and fluorescence detectors. Increasing the number of lasers and detectors allows for multiple antibody labeling, and can more precisely identify a target population by their phenotypic markers. Some instruments can even take digital images of individual cells, allowing for the analysis of fluorescent signal location within or on the surface of the cell.
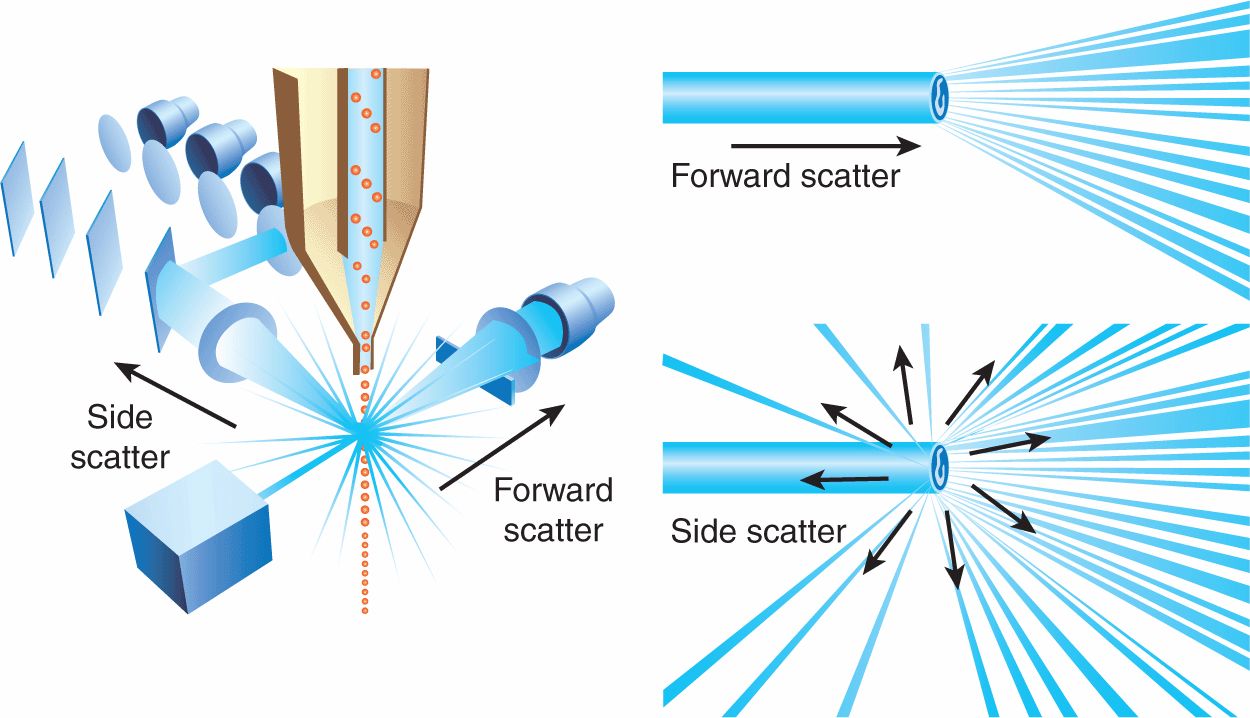
FIGURE 2–37 In flow cytometry, lenses are used to shape and focus the excitation beam from a laser, directing the beam through the hydrodynamically focused sample stream. Where the laser intersects the stream is the “interrogation zone,” when the particle passes through the interrogation zone there is light scatter and possibly fluorescence; it is the detection and analysis of this light scatter and fluorescence that gives information about a particle. To detect the light scatter and fluorescent light, there are detectors—1 in line with the laser (to detect forward scatter) and 1 perpendicular to the laser (to detect side scatter). The intensity of the forward scatter is in relation to the particle size. The side scatter channel (SSC) detects light at a 90-degree angle to the laser source point; this scatter gives information on granularity and internal complexity. (Copyright © 2012 Life Technologies Corporation. Used under permission.)
The applications of flow cytometry to research are constantly expanding but include the volume and morphological complexity of cells; total DNA content (cell-cycle analysis, see Chap. 12, Sec. 12.1.2); total RNA content; DNA copy number variation (by Flow-FISH); chromosome analysis and sorting (library construction, chromosome paints); protein expression and localization; posttranslation protein modifications; fluorescent protein detection; detection of cell surface antigens (cell differentiation [CD] markers); intracellular antigens (various cytokines, secondary mediators, etc); nuclear antigens; apoptosis (quantification, measurement of DNA degradation, mitochondrial membrane potential, permeability changes, caspase activity; see Chap. 9, Sec. 9.4.2); cell viability; and multidrug resistance (see Chap. 19, Sec. 19.2.3) in cancer cells.
Fluorescence-activated cell sorting is a specialized type of flow cytometry that allows a heterogeneous cell population to be sorted into 2 or more containers, 1 cell at a time, based upon the light scattering and fluorescent properties of each cell. It utilizes a similar system of hydrodynamic focusing, but with a large separation between cells relative to cell diameter. A vibrating mechanism causes the stream of cells to break into individual droplets with a low probability of more than 1 cell per droplet. Just before the stream breaks into droplets, the flow passes through a fluorescence-measuring station where the fluorescent character of each cell is measured and an electrical charge is applied to the droplet, depending on the fluorescence-intensity measurement. The charged droplets then fall through an electrostatic deflection system that diverts droplets into different chambers based upon their charge.
2.7 BIOINFORMATICS AND OTHER TECHNIQUES OF DATA ANALYSIS
Bioinformatics employs a variety of computational techniques to analyze biological data and to integrate the data with publicly available resources. This section outlines some of the major biological problems that can be addressed using computational techniques, with a focus on 2 major areas particularly relevant to cancer biology and research: microarray analysis and pathway analysis.
2.7.1 Microarray Analysis
The first step in obtaining the most information from any large-scale experiment such as a microarray study is to consider its design. The statistical power of the analysis (called a Type II or β error) indicates the probability that a false-negative result will be avoided. There are several methods for analysis of power, based on trade-offs between the magnitude of the effect, the intersample variability, and the number of samples used, and these techniques can be extended to handle multidimensional datasets, like microarray data (Begun, 2008; Asare et al, 2009; Hackstadt and Hess, 2009).
The next step is to consider which types of samples should be processed for validation and quality control. For example, each sample can be hybridized once, or technical replicates can be used. A technical replicate occurs when the same RNA sample is split into 2 separate aliquots and each is hybridized separately to multiple microarray chips. The use of technical replicates allows for the assessment of technical variability within the experiment but this comes with 2 costs. First, each sample is hybridized in duplicate, essentially doubling the price and sample requirements of the experiment. Second, more complex statistical models (called repeated-measures models) must be used to analyze this type of data. An alternative is to use multiple RNA samples from each biological sample. For example, different regions of a tumor can be isolated and RNA extracted from each and hybridized to independent microarrays. This type of experiment provides a highly informative assessment of intratumor heterogeneity, but requires the use of complex statistical techniques, such as mixed models (Bachtiary et al, 2006).
An important step in handling microarray data is the removal of spurious background signals. These signals can arise from pooling of samples during hybridization, from stochastic events, or from defects in array manufacture or scanning. Background signal almost always varies from 1 region of the array to another. A wide range of computational techniques have been developed to remove these background effects, but the most successful techniques model the fraction of bound probes in a given spot directly from the number of pixels available (Kooperberg et al, 2002). A very widely-used method for Affymetrix (ie, printed oligonucleotide) arrays, called GCRMA, takes into account the differential hybridization strengths of G:C and A:T base-pairings directly in the background correction procedure (Wu et al, 2004).
Normalization is the process of removing technical artifacts from a dataset. For example, successful normalization of a microarray experiment will remove variability caused by differential rates of dye incorporation, differential fluorescent efficiency of fluorophores, irregularities in the surface of a microarray, unequal sample loading, and differential sample quality or degradation. At the same time, biological factors like the inherent biological variability between replicate animals should be preserved. Normalization methods can be classified as either global or local. A global method considers the entire dataset, and excels at removing artifacts that are consistently present across multiple arrays in a study. By contrast, local methods focus on a subset of the data, usually a single array. These tend to be both more computationally efficient and to be more efficacious at removing nonsystematic (eg, stochastic) effects.
2.7.2 Statistical Analysis
Once microarray data has been preprocessed to remove or reduce nonbiological signals, statistical analysis is required to identify genes or features that have a specific pattern of interest. The most common question to arise from a micro-array experiment is, “What differs between two prespecified groups?” This study design encompasses many common biological situations, such as treatment/vehicle, case/control, and genetic-perturbation/wild-type comparisons. A variety of novel statistical tests have been evaluated to address 2-group microarray questions, but it is common to apply t-tests, for example, to compare the mean expression of a gene between 2 groups, such as primary and metastatic tumors. First, the t-test assumes that the 2 groups have equivalent variability; this assumption is often violated, as some tumor types are more heterogeneous than others, and there is usually more variability in tumors than normal tissues, but corrections can be applied. Second, the t-test assumes that the data are drawn (sampled) from a population with a normal distribution, and it is difficult to verify this assumption—tests for the normality of a distribution are very insensitive. Third, the use of multiple t-tests assumes that each test is independent from the others. Microarray data often violate this assumption, as the expression of RNA from different genes can be highly correlated.
Often, queries related to translational oncology involve assessment of patient survival or tumor recurrence. It is rare that a clinical study is carried out until all patients have died, entered stable remission, or experienced a recurrence of their disease; instead, only a specified amount of follow-up will be available for each patient, and many will remain alive at the conclusion of the study. The analysis of survival is usually performed using log-rank analysis as described in Chapter 22, Section 22.2.5. An alternative, the Cox proportional hazards model, is analogous to a multiple regression model and enables the difference between survival times of particular groups of patients to be tested while allowing for other factors (covariates), each of which is likely to influence survival. These techniques have been widely applied in relating microarray data to survival or recurrence of disease in patients.
Independent of what statistical test is employed for a microarray analysis, the final set of p-values must be considered carefully. A p-value represents the chance of making a Type I (or α) error (a false-positive) for testing a single hypothesis. Consider an experiment where 20 primary colon cancers are analyzed by microarray to measure the mRNA abundance of 10,000 genes. These 20 samples are randomly split into 2 groups of 10 each, where there is no expectation that the groups are actually different. A simple t-test is used to compare the level of each of the 10,000 genes between groups, and a stringent p-value threshold of 0.01 is applied. In this case, we predict that there will be 10,000 × 0.01 = 100 false-positives; that is, 100 genes will be found different between the 2 groups by chance alone. There are several “multiple testing adjustments” that help alleviate this problem. One classic adjustment is called the Bonferroni correction, which involves dividing the threshold p-value by the number of tests to be performed. In the example above, we would use a threshold of p <0.01/10,000, or p <10–6. This type of adjustment is very conservative, as it assumes that all of the comparisons are independent (whereas many are often correlated) and suggests that, across all 10,000 tests, we will have only a 1% chance of finding even 1 false-positive. An alternative approach is called the false-discovery rate (FDR) adjustment. This adjustment controls the percentage of tests that will be expected to be false-positives. For example, if there are 100 genes with an FDR <0.1 (eg, a FDR of 10%), then we anticipate that 100 × 0.1 = 10 genes from this list will be false-positives. Calculation of the FDR itself for any given experiment is complex (Storey and Tibshirani, 2003) but is easily performed in common statistical software packages, and the use of FDR-adjusted p-values (also called q-values) has become widespread in genomic studies.
2.7.3 Unsupervised Clustering
After differentially expressed genes have been identified using statistical techniques, as described above, there remains the major challenge of interpreting the biological relevance of these changes. A common technique is to group similar patterns of change in gene expression together. This may provide information about co-regulation of genes, and coregulated genes are well known to share biological functions (Boutros and Okey, 2005). Therefore patterns of similarity of differentially expressed genes might shed light into disease etiology or mechanisms.
The next step is to select an appropriate method to classify patterns (eg, of gene expression). If the biological question involves a characteristic of the samples—such as identifying novel tumor subtypes or predicting patient response—then supervised machine-learning methods (described below) are most appropriate. If the goals involve characteristics of individual genes, then an unsupervised method is more appropriate. These unsupervised methods are often called clustering methods (see also Chap. 22, Sec. 22.5), and there are a variety of available techniques that are distinguished by their mathematical characteristics and the assumptions that they make. For example, a commonly used method called k-mean clustering assumes that the number of “classes” of genes can be defined a priori but makes no other assumptions regarding the interrelationships between specific pairs of genes. Another very common method, called hierarchical clustering, makes no assumptions regarding the number of classes of genes (de Hoon et al, 2004). Instead, it assumes that genes are related to each other in a hierarchical way, where certain gene-pairs are more similar than others (Duda et al, 2001). A large number of clustering algorithms have been developed but there have been no comprehensive comparisons of them, so it is difficult to suggest optimal methods for particular experimental designs.
A common misconception about unsupervised methods such as clustering is that all genes within a single group share a common mechanism. However, although different genes may exhibit similar expression profiles, this does not necessarily indicate a single common mechanism. For example, the p53 response might be abrogated in tumors by multiple mechanisms, each producing the same resulting expression profile. Other causes may lead to sets of genes being coregulated, especially in genome-wide experiments where millions of gene-pairs are assessed. By definition, clustering methods only identify genes that are correlated. Mechanistic hypotheses can be framed from these data, but there is no necessity for a single underlying mechanism (Boutros and Okey, 2005; Boutros, 2006).
2.7.4 Gene Signatures
Increasingly microarray and other -omic datasets are being used to make predictions about clinical behavior. The approach is straightforward: Those features that are correlated with the presence of a specific clinical event are identified using an appropriate statistical methodology. These features are merged to construct a multifeature predictive signature. This signature is then evaluated in an independent group of patients to test and demonstrate its robustness. This general approach was first applied to demonstrate that acute myeloid and acute lymphoblastic leukemias could be distinguished with good accuracy, solely on the basis of their mRNA expression profiles (Golub et al, 1999). A large number of groups extended this initial work to demonstrate that many tumor subtypes could be distinguished and even discovered from microarray data (Bild et al, 2006; Chin et al, 2006; Neve et al, 2006).
The second major application of machine-learning techniques to -omic data has already substantially changed clinical practice. Rather than defining tumor subtypes, many investigators have sought to predict which patients might be under- or overtreated. The first major study, in breast cancer, identified a 70-gene signature that predicted survival of breast cancer patients (van ‘t Veer et al, 2002). Subsequent external validations have helped this predictor be developed into a tool that is used in clinical practice (van de Vijver et al, 2002; van ‘t Veer and Bernards, 2008). Similar efforts have led to the development of prognostic signatures for other tumor types, particularly non–small cell lung carcinoma (Beer et al, 2002; Chen et al, 2007; Lau et al, 2007; Boutros et al, 2009) and serous ovarian cancers (Mok et al, 2009). Nevertheless, the field has come under critical review recently for the proliferation of poorly validated and described signatures (Shedden et al, 2008; Subramanian and Simon, 2010), with evidence that current studies are under-powered (Ein-Dor et al, 2006). It therefore remains unclear if analogies to the promising breast cancer prognostic signatures can be found for other tumor types.
2.7.5 Pathway Analysis
Many -omic experiments result in a large list of genes. For example, the determination of genes that are amplified or deleted in cancer using array CGH (Li et al, 2009) can result in hundreds or thousands of genes present in copy-number altered regions. Similarly, a microarray analysis can identify hundreds or thousands of genes altered between cancerous and normal tissue or associated with prognosis. When presented with a gene-list of this size and scope, the most common question is, “What do all these genes have in common?” There is a reductionist tendency to search for a smaller number of underlying “driver” changes that drive or explain the changes in all these genes. There are 2 primary approaches to this challenge: gene ontology enrichment analysis and protein-interaction network analysis.
Gene ontology (GO) is a systematic attempt to organize and categorize what is known about gene function and localization. GO defines functions first in a general, nonspecific manner and it is then refined into more specific statements. Each of these functions are given a specific GO identifier, and if a gene is assigned a specific function it automatically “inherits” all less-specific functions (Consortium, 2001). Different genes possess varying degrees of GO annotation. Some well-characterized genes will be annotated with dozens of different functions, whereas other less-characterized genes may possess little or no annotation. For example, a gene might first be described as involved in the general process of “metabolism,” then the more specific process of “monosaccharide metabolism” (GO:0005996), then the more specific terms of “hexose metabolism” (GO:0019318), “fructose metabolism” (GO:0006000), and, ultimately, the most precise term, “fructose 1,6-bisphosphonate metabolism” (GO:0030388).
Numerous groups are working to annotate every gene with all specific functions that have been reported in the literature (Camon et al, 2003). Because information about gene-function is usually reported in the text of peer-reviewed journals this is a time-consuming and manual endeavor. More recently -omic studies have provided the capacity for more rapid assessment of gene function. GO stores both types of information, but allows users to distinguish them with “evidence codes.” Every association of a gene and a function is supported by 1 or more codes that indicate their origin. The most common codes include IEA (inferred from electronic annotation, usually -omic datasets) and TAS (traceable author statement, usually published datapoints).
There are multiple online tools to associate each gene with its known GO annotation. Essentially, all these tools attempt to assign a statistical assessment of “GO enrichment”: in other words, are there any specific GO terms that occur more often than expected by chance in this list of genes? The most common approach is to ignore the structure of the GO tree and to simply perform a large number of proportion tests—1 for every GO term. A proportion test essentially asks if a ratio differs between 2 conditions: It tests whether the fraction of genes in the gene list annotated with a given function is significantly different from the fraction of all genes with this function. The main challenges are the presence of unannotated genes, the statistical problems of performing parallel tests on correlated data, and the potential for error in existing annotations.
An alternative approach to using GO enrichment analysis to identify functions in a gene list is to analyze the data from the context of interacting networks of proteins. The rationale is that proteins that physically interact are highly likely to be involved in similar functions. There is substantial support for this concept, particularly from model organisms. Protein–protein interactions can be identified using several experimental techniques (see Sec. 2.5) however, the protein–protein interaction networks of humans and other mammals are less-well known than those of model organisms. Many groups have inferred mammalian protein–protein interactions from those of other organisms, under the assumption that they are likely to be evolutionarily conserved (Brown and Jurisica, 2005) or to manually curate protein–protein interactions in much the same way as GO annotations are annotated by manual review of the primary literature. Both approaches have problems, as the former biases against proteins with poor evolutionary conservation, while the latter biases toward well-studied proteins. Additional high-throughput screens will be needed to provide deeper coverage of human protein–protein interactions.
Once a database of protein–protein interactions has been identified, the most common approach is to superimpose a gene list upon the overall network. Each gene in the list, along with its nearest neighbors (ie, the direct interactions), is then be probed. The interaction network can be arranged in 2-dimensional space, and it can be determined if the genes on the gene list are more proximal to one another than would be expected by chance alone, thus suggesting that they encode components of common functional pathways. This type of approach has identified critical characteristics of cancer cells, including potential opportunities to exploit synthetic lethal interactions (Jonsson and Bates, 2006; Pujana et al, 2007; Rambaldi et al, 2008). Additionally, there is emerging evidence that lung cancer bio-markers may also be improved by addition of protein–protein interactions (Wachi et al, 2005; Lau et al, 2007).
Stay updated, free articles. Join our Telegram channel

Full access? Get Clinical Tree


