##
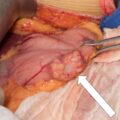
Lipid-poor adrenal masses are the landmines of adrenal disorders. Although lipid-poor adrenal masses may be benign nonfunctional cortical adenomas, it can be difficult to make the distinction from more concerning diagnoses such as a small adrenocortical carcinoma (ACC) (see Case 23) and prebiochemical pheochromocytoma (see Case 36). Choosing nonsurgical management can carry a clinically significant risk. Herein we present such a case.
Case Report
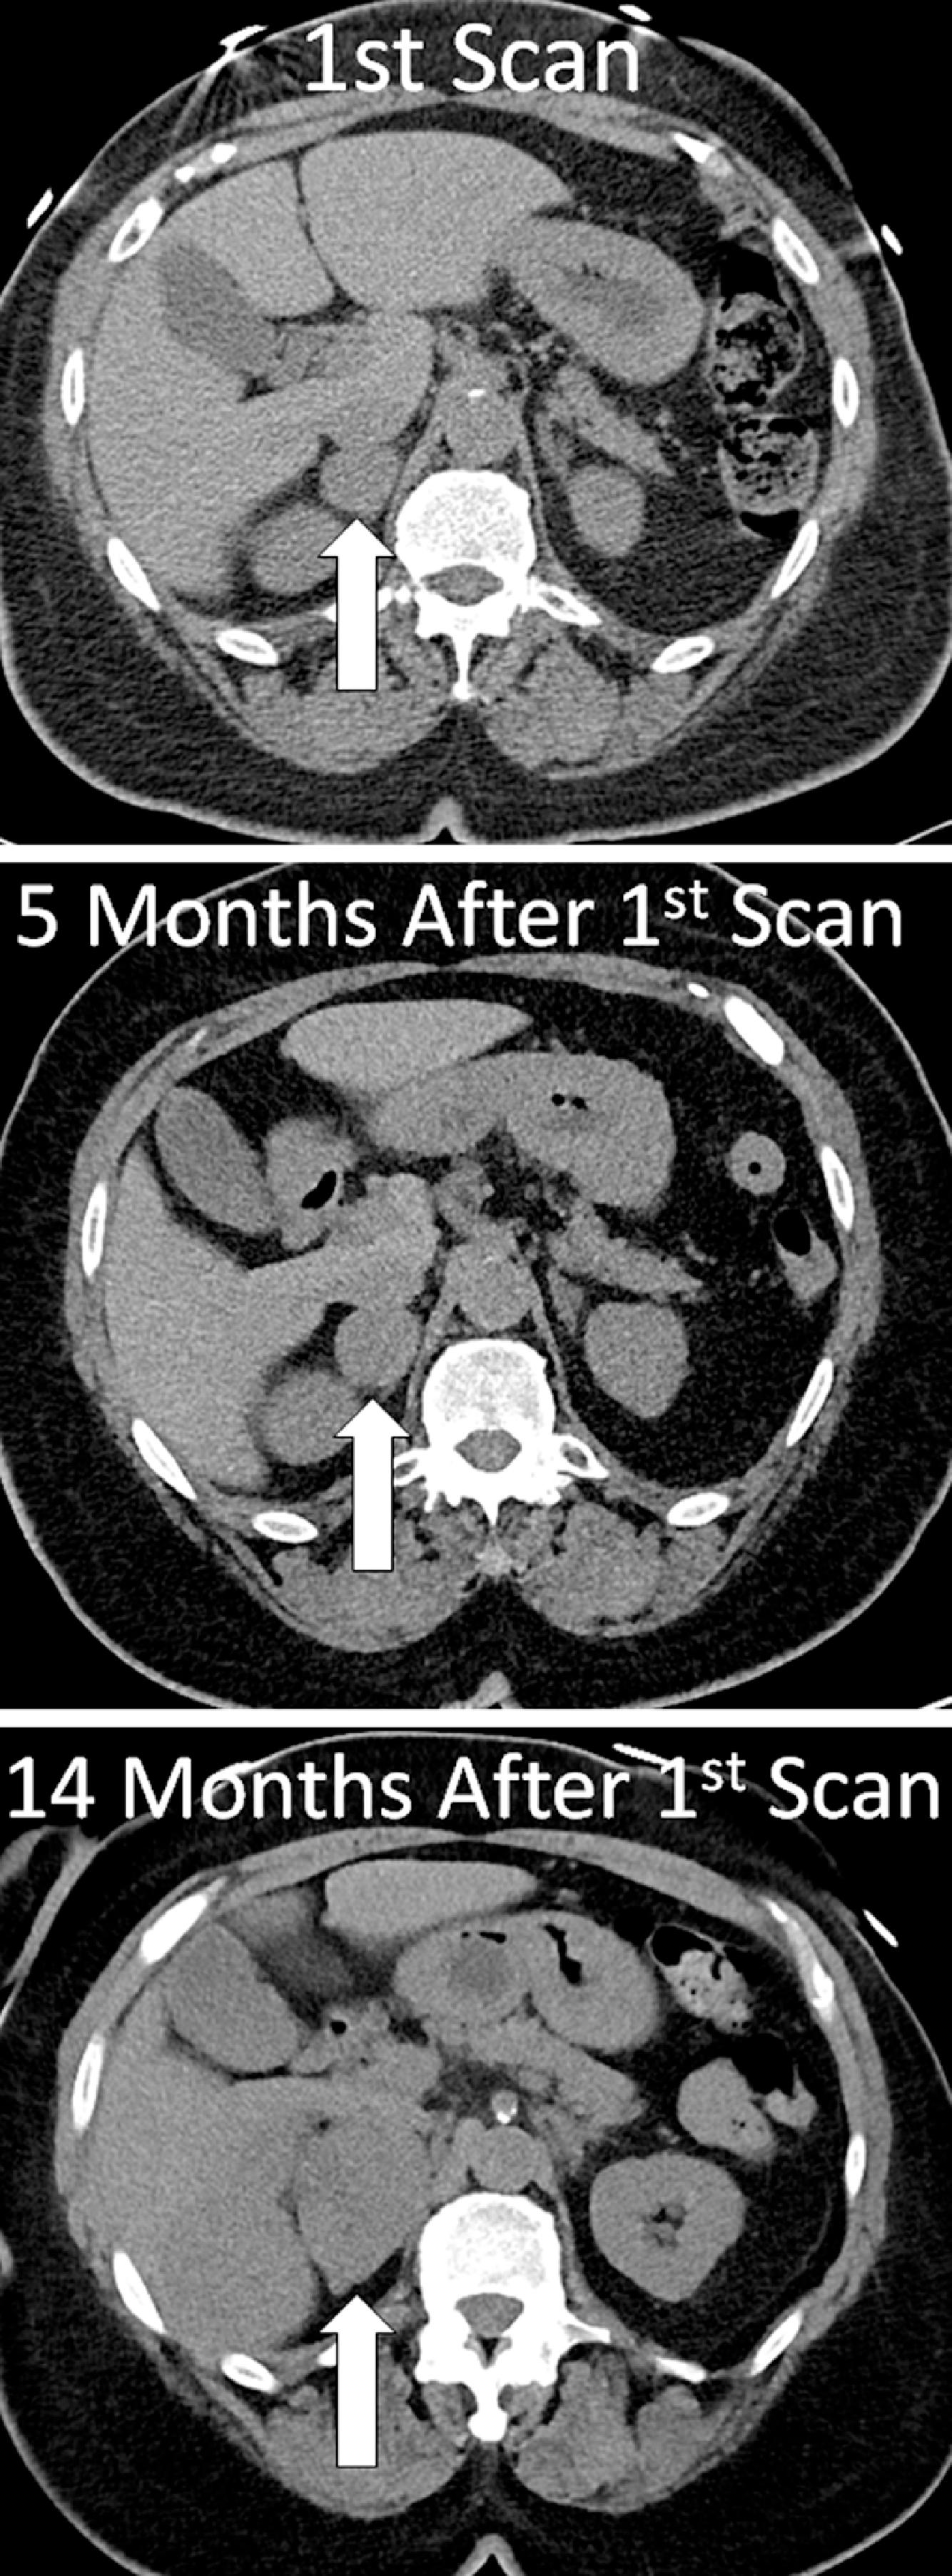
The patient was an 82-year-old woman who 5 months previously presented with community-acquired pneumonia. To exclude pulmonary embolism, a chest computed tomography (CT) angiogram was performed and a right adrenal mass was noted incidentally. An adrenal-dedicated CT scan showed the mass to measure 2.3 × 2.5 × 3.2 cm with an unenhanced CT attenuation of 28 Hounsfield units (HU) ( Fig. 6.1 ). Follow-up CT scan was obtained 5 months later, and the right adrenal mass increased in size (2.8 × 2.5 × 3.5 cm) (see Fig. 6.1 ). She had a history of hypertension and type 2 diabetes mellitus. Her antihypertensive medications included a calcium channel blocker (amlodipine 10 mg daily) and a β-adrenergic blocker (metoprolol 12.5 mg twice daily). She had no overt signs of adrenal dysfunction or past history of malignancy. She had no change in body weight. On physical examination her body mass index was 32 kg/m 2 , blood pressure 161/81 mmHg, and heart rate 81 beats per minute. She had no stigmata of Cushing syndrome.
INVESTIGATIONS
The baseline laboratory test results are shown in Table 6.1 . The laboratory tests were normal with the exception of a positive case detection test for primary aldosteronism and minimal elevations in serum total testosterone and plasma normetanephrine.

