Chapter Outline
Iron metabolism 166
Dietary iron absorption 166
Dietary and luminal factors 166
Iron absorption at the molecular level 167
Regulation of iron absorption 167
Cellular iron uptake and release 167
Iron storage 168
Regulation of iron metabolism 168
Plasma iron transport 168
Iron status 168
Disorders of iron metabolism 169
Methods for assessing iron status 169
Estimation of serum iron concentration 173
Alternative procedure: serum iron without protein precipitation 174
Serum iron concentrations in health and disease 175
Estimation of total iron-binding capacity 175
Determination of unsaturated iron-binding capacity 175
Fully automated methods 176
Serum transferrin 176
Normal ranges of transferrin and total iron-binding capacity 176
Transferrin saturation 177
Serum transferrin receptor 177
Assays for the serum transferrin receptor 178
Reference ranges 178
Samples 178
Transferrin receptor concentrations in diagnosis 178
Erythrocyte protoporphyrin 179
Hepcidin 180
Methodological and biological variability of assays 180
Predictive value of blood tests for iron deficiency 181
Iron deficiency anaemia in adults 181
Detection of iron deficiency in acute or chronic disease 182
Functional iron deficiency 182
Iron deficiency in infancy and childhood 183
Pregnancy 183
Evaluation of suspected iron overload 183
Conclusion 183
Iron metabolism
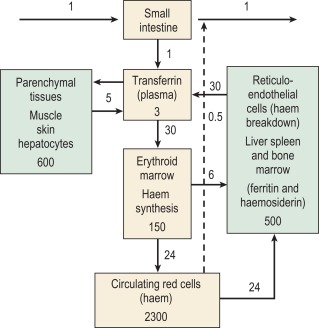
The iron content of the body and its distribution among the various proteins are summarised in Table 9-1 . Most of the iron is present in the oxygen-carrying protein of the red blood cell, haemoglobin, the synthesis and breakdown of which dominate iron turnover. Haem of haemoglobin is synthesised in nucleated red cells in the bone marrow and in reticulocytes by a pathway ending with the incorporation of iron into protoporphyrin IX by ferrochelatase. Haem breakdown from haemoglobin takes place mainly in phagocytic cells, largely those in the spleen, liver and bone marrow. Iron is released from haem by haem oxygenase and is largely reused for haem synthesis. Every day about 30 mg of iron is used to synthesise haemoglobin and most of this is obtained from the breakdown of old red cells.
| Protein | Location | Iron Content (mg) |
|---|---|---|
| Haemoglobin | Red blood cells | 3000 |
| Myoglobin | Muscle | 400 |
| Cytochromes and iron sulphur proteins | All tissues | 50 |
| Transferrin | Plasma and extravascular fluid | 5 |
| Ferritin and haemosiderin | Liver, spleen and bone marrow | 100–1000 |
Relatively little iron is lost from the body (about 1 mg/d in men) and these losses are not much influenced by body iron content or the requirement of the body for iron. The body iron content is maintained by variation in the amount of iron absorbed. In women, menstruation and childbirth increase iron losses to about 1.5 mg/d. Iron absorption may not increase sufficiently to compensate for these iron losses and this may eventually lead to the development of iron deficiency anaemia. In most men and post-menopausal women there is some ‘storage’ iron. This is iron in ferritin or its insoluble derivative haemosiderin, which is available for haem synthesis if necessary. Many young women and children have little or no storage iron.
The iron-binding protein transferrin is responsible for extracellular transport. Each molecule of transferrin can bind up to two molecules of ferric iron. Most cells obtain iron from diferric transferrin, which binds to transferrin receptors (TfRs) on the cell surface. This is followed by internalization into vesicles, release of iron, transport of iron into the cytoplasm and recycling of the apotransferrin (the protein without iron) into the plasma ( Fig. 9-1 ).
Dietary iron absorption
Iron absorption depends on the amount of iron in the diet, its bioavailability and the body’s need for iron. A normal Western diet provides approximately 15 mg of iron daily. Of that iron, digestion within the gut lumen releases about half in a soluble form, from which only about 1 mg (5–10% of dietary iron) is transferred to the portal blood in a healthy adult male.
Dietary and luminal factors
Most of the dietary iron is non-haem iron derived from cereals (often fortified with additional iron), with a lesser, but well-absorbed, component of haem iron from meat and fish. With iron deficiency, the maximum iron absorption from a mixed Western diet is no more than 3–4 mg daily. This amount is much less in the more vegetarian, cereal-based diets of many populations.
Non-haem iron is released from protein complexes by acid and proteolytic enzymes in the stomach and small intestine. It is maximally absorbed from the duodenum and less well from the jejunum, probably because the increasingly alkaline environment leads to the formation of insoluble ferric hydroxide complexes. Many luminal factors enhance (e.g. meat and vitamin C) or inhibit (e.g. phytates and tannins) non-haem iron absorption. Therapeutic ferrous iron salts are well absorbed (approximately 10–20%) on an empty stomach, but when taken with meals, absorption is reduced by the same dietary interactions that affect non-haem food iron.
Iron absorption at the molecular level
Several membrane transport proteins, regulatory proteins and associated oxidoreductases involved in iron transport through the intestinal cell have been identified. Non-haem iron is released from food as Fe 3 + (ferric iron) and reduced to Fe 2 + (ferrous iron) by a membrane-bound, ferrireductase, duodenal cytochrome b (DCYTB). Iron is then transported across the brush-border membrane by the divalent metal transporter DMT1. Some iron is incorporated into ferritin and lost when the cells are exfoliated. Iron destined for retention by the body is transported across the serosal membrane by ferroportin-1. Before uptake by transferrin, Fe 2 + is oxidised to Fe 3 + by hephaestin (a membrane protein homologous to the plasma copper-containing protein caeruloplasmin) or by plasma caeruloplasmin.
Haemoglobin and myoglobin are digested in the stomach and small intestine. Haem is initially bound by haem receptors at the brush border membrane and the iron is released intracellularly by haem oxygenase before entering the labile iron pool and following a common pathway with iron of non-haem origin.
Regulation of iron absorption
Iron absorption may be regulated both at the stage of mucosal uptake and at the stage of transfer to the blood. Recent studies show that in mice HIF-2α, a mediator of cellular adaptation to hypoxia, regulates transcription of SLC11A2 (the gene encoding divalent metal transporter 1, DMT1) and thus mucosal uptake of iron. As the epithelial cells develop in the crypts of Lieberkühn, their iron status reflects that of the plasma (transferrin saturation) and this programmes the cells to absorb iron appropriately as they differentiate along the villus. Transfer to the plasma depends on the requirements of the erythron for iron and the level of iron stores. This regulation is mediated directly by hepcidin, a peptide synthesised in the liver in response to iron and inflammation.
Cellular iron uptake and release
Diferric transferrin binds with high affinity to TfR1 on the membrane of the cell to form a complex which initiates endocytosis of the local membrane. The resulting endosome contains the holotransferrin–transferrin receptor complex. The pH of the endosome is reduced by a proton pump, and a conformational change in holotransferrin is induced, causing iron release. Iron is then reduced by a membrane-bound ferrireductase (six-transmembrane epithelial antigen of the prostate 3, STEAP3, in erythroid cells ) and transported into the cytoplasm by DMT1. This iron is then either stored as ferritin or used within the cell. Iron destined for haem and mitochondrial iron-sulphur (Fe-S) clusters is transported into mitochondria by mitoferrin for incorporation into protoporphyrin by ferrochelatase and for Fe-S cluster assembly on the scaffold protein ISCU. Export by ABCB7 of an as yet unknown component (possibly a glutathione persulphide or a glutathione–co-ordinated [2Fe-2S] cluster ) to the cytoplasm stimulates Fe-S cluster protein assembly there, essential for cellular iron homeostasis. Apotransferrin and the transferrin receptor of the endosome return rapidly to the cell surface where they dissociate at neutral pH so that the cycle can start again.
The reticuloendothelial macrophages play a major role in recycling iron resulting from the degradation of haemoglobin from senescent erythrocytes. They engulf red blood cells and release the iron within the cells using haem oxygenase. The iron is rapidly released to plasma transferrin or stored as ferritin. The protein transporting iron to plasma is ferroportin or SLC40A1. Ferroportin activity is regulated in a negative manner by the mainly liver-derived peptide hepcidin that binds to ferroportin externally, inducing endocytosis and degradation.
Hepcidin synthesis in the hepatocyte is controlled at the transcriptional level through the alteration of levels within the nucleus of different transcription factors able to bind to the gene. Interaction of diferric transferrin, bone morphogenetic proteins (BMPs), interleukin (IL) 6 and other inflammatory cytokines with cell surface receptors TfR1, TfR2, hemojuvelin (haemojuvelin) (HJV) and IL6 receptor leads to upregulation of the hepcidin gene through different and sometimes interacting signalling pathways. Matriptase-2 (gene TMPRSS6 ), a plasma membrane serine protease, inhibits the HJV-BMP-SMAD signalling pathway by cleaving HJV from the surface of the cell, thus preventing overproduction of hepcidin and maintaining iron homeostasis. , A soluble form of HJV (sHJV) produced within the cell by the enzyme furin and released into the plasma antagonises and also inhibits this pathway.
The mechanism of action of the HFE protein is less clear. HFE binds to both TfR1 and TfR2, decreasing the affinity of each for transferrin. Stabilization and endocytosis of TfR2 stimulate hepcidin production and there is evidence that diferric transferrin displaces the protein HFE from TfR1, leaving it free to interact with TfR2, thus stimulating hepcidin production in response to plasma iron levels. More recent studies have failed to demonstrate an HFE-TfR2 complex and suggest that the actions of HFE and TfR2 on hepcidin regulation may be independent. ,
Increased erythropoiesis causes decreased hepcidin, increased iron absorption and increased iron availability for haemoglobin production. So far, two plasma antagonists of the BMP-HJV-SMAD pathway, GDF15 and TWSG1, produced by erythroid cells and associated with expanded ineffective erythropoiesis, have been found. , In addition, acting through an unknown and apparently distinct pathway to suppress hepcidin production, erythroferrone (ERFE), a member of the tumour necrosis factor-α (TNF-α) superfamily, has been identified as a mediator of the erythroid-hepatic signal to respond to acute blood loss. The extent and the manner in which these regulatory pathways vary between different tissues await further investigation. Genetic alteration of the function of key regulators leads to body iron overload or iron deficiency (see later).
Iron storage
All cells require iron for the synthesis of proteins but have the ability also to store excess iron. There are two forms of storage iron: a soluble form, known as ferritin and insoluble haemosiderin. Ferritin consists of a spherical protein (molecular mass 480 000 Da) enclosing a core of ferric-hydroxy-phosphate, which may contain up to 4000 atoms of iron. The protein component of ferritin is designated specifically ‘apoferritin’, with the term ‘ferritin’ being usually used to indicate both apoferritin and iron-containing ferritin. Haemosiderin is a denatured form of ferritin in which the protein shells have partly degraded, allowing the iron cores to aggregate. Haemosiderin deposits are readily visualised with the aid of the light microscope as areas of Prussian-blue positivity after staining of tissue sections with potassium ferrocyanide in acid (see Perls stain, Chapter 15 ). Ferritin is found in all cells and in the highest concentration in liver, spleen and bone marrow.
Regulation of iron metabolism
The expression of a number of iron proteins involved in both transport and storage is largely controlled post- transcriptionally by iron regulatory proteins (IRP1 and IRP2). The conformation of IRP1 required for binding to messenger ribonucleic acid (mRNA) iron-responsive elements (IREs) and the turnover of IRP2 are directly affected by the amount of iron within a cell. Depending on where the target IRE elements are found, these proteins may inhibit or enhance translation of many proteins involved in iron metabolism.
IREs are regions of mRNA that form hairpin-like stem-loop structures. These consist of a base-paired stem of variable length interrupted by an asymmetrical region including a 5′ unpaired cytosine, followed by an upper stem of five paired bases and a six-membered loop. When the labile iron pool is deficient in iron, IRP1 has an available binding site for IRE. When the labile iron pool is saturated with iron, the iron binds to IRP1 to produce a 4Fe-4S cluster, which blocks the IRE-binding site and prevents IRP1 binding to the IRE. Fe-saturated IRP1 is then able to function as the enzyme aconitase. In the presence of iron, IRP2 (which is not an Fe-S protein) is degraded. The turnover of IRP1 is also affected by iron levels.
Different iron proteins are regulated by IRP in different ways, depending on where the IRE is located. If the IRE is at the 3′ untranslated region (UTR) of the mRNA, IRP binding will stabilise translation by protecting the translation product from endonucleolytic cleavage (e.g. TfR1 and DMT1). If the IRE is at the 5′ UTR of the mRNA, IRP binding will inhibit the translation of mRNA. Both L and H ferritin subunits have 5′ UTR IRE. When iron is abundant, the IRP does not bind to the 5′ IRE so ferritin expression is not inhibited and excess iron can be stored adequately. When iron is scarce, the IRP binds to the IRE and inhibits ferritin synthesis.
Plasma iron transport
Almost all the iron in plasma is tightly bound to transferrin, which is usually less than 50% saturated with iron. Transferrin, when incompletely saturated with iron, exists in four forms: apo, monoferric (A) (iron bound at the ‘A’ site), monoferric (B) and diferric. The distribution may be determined by urea-polyacrylamide electrophoresis. Delivery to cells requires specific binding to transferrin receptors. The plasma iron pool (transferrin-bound iron) is about 3 mg, although the daily turnover is more than 10 times this amount. In addition, smaller amounts of iron are carried in the plasma by other proteins.
Haptoglobin is a serum glycoprotein that avidly binds haemoglobin αβ dimers released into the bloodstream by haemolysis. The haemoglobin–haptoglobin complex is rapidly removed from the plasma by a specific receptor, CD163, highly expressed on tissue macrophages.
Hemopexin is a plasma glycoprotein of molecular mass approximately 60 kDa that binds haem and transports the haem to cells by a process that involves receptor-mediated endocytosis and recycling of the intact protein.
Low concentrations of ferritin are found in the plasma and ferritin concentrations in healthy subjects reflect body iron stores. Much of this ferritin appears to be glycosylated and has a relatively low iron content. Such ferritin has a half-life ( T 1/2 ) of approximately 30 h. Ferritin is also released into the circulation as a result of tissue damage (most strikingly after necrosis of the liver). Tissue ferritin is cleared rapidly from the circulation ( T 1/2 in approximately 10 min) by the liver.
Non-transferrin–bound iron describes a form of iron that is not bound to transferrin, is of low molecular mass and can be bound by specific iron chelators. Several assays have been described that have demonstrated such a fraction in plasma from patients with iron overload. The chemical form of this iron is unknown, but it is probably rapidly removed from the circulation by the liver. Various ferrireductases and divalent metal transporters (ZIP14, ZIP8, DMT1) are implicated in this process.
Iron status
Normal iron status implies a level of erythropoiesis that is not limited by the supply of iron and the presence of a small reserve of ‘storage iron’ to cope with normal physiological needs. The ability to survive the acute loss of blood (and thus iron) that may result from injury is also an advantage. The limits of normality are difficult to define and some argue that physiological normality is the presence of only a minimal amount of storage iron but the extremes (i.e. iron deficiency anaemia and haemochromatosis) are well understood.
Apart from too little or too much iron in the body, there is also the possibility of a maldistribution ( Fig. 9-2 ). An example is anaemia associated with inflammation or infection, usually known as ‘the anaemia of chronic disease’ but also as ‘the anaemia of inflammation’, where there is a partial failure of erythropoiesis and of iron release from the phagocytic cells in liver, spleen and bone marrow, which results in accumulation of iron as ferritin and haemosiderin in these cells.
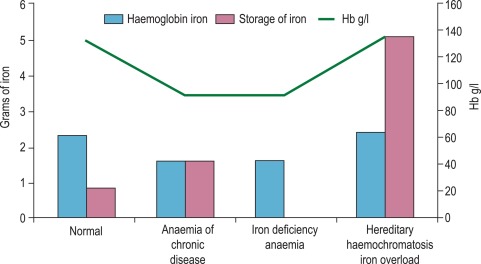
Determination of iron status requires an estimate of the amount of haemoglobin iron (usually by measuring the haemoglobin concentration [Hb] in the blood; see Chapter 3 ) and the level of storage iron (usually by measuring serum ferritin concentration). Iron deficiency should be suspected in hypochromic, microcytic anaemia, but in the early stages of iron deficiency red cells may be normocytic and normochromic. Another feature of iron deficiency is an increased concentration of protoporphyrin in the red cells; normally, there is a small amount present, but defective haem synthesis caused by lack of iron results in the accumulation of zinc protoporphyrin and occasionally free protoporphyrin is increased as well.
Additional assays are sometimes required. In hereditary haemochromatosis, early iron accumulation is indicated by increased transferrin saturation alone. The serum ferritin concentration increases only later as the level of stored iron increases. In the anaemia of chronic disease, patients often have normal serum ferritin concentrations even when storage iron in the bone marrow is absent. In this situation, the assay of serum transferrin receptor (also known as soluble transferrin receptor) may help detect tissue iron deficiency.
Disorders of iron metabolism
Clinical aspects of iron metabolism have been reviewed and are summarised in Table 9-2 . Guidelines on the management of hereditary haemochromatosis are available. ,
| Iron Deficiency |
| Deficient Iron Intake |
| Diet of low bioavailability |
| Increased physiological requirements due to rapid growth in early childhood and in adolescence |
| Blood loss |
| Physiological (e.g. menstruation) |
| Pathological (e.g. gastrointestinal) |
| Malabsorption of Iron |
| Reduced or absent gastric acid secretion (e.g. after partial or total gastrectomy or with atrophic gastritis) |
| Reduced duodenal absorption (e.g. in coeliac disease) |
| Bypass of stomach and duodenum (bariatric surgery) |
| Rare, inherited iron-refractory iron deficiency anaemia (e.g. deficiency of TMPRSS6 [transmembrane protease, serine 6], also known as matriptase-2) |
| Redistribution of Iron |
| Macrophage iron accumulation in reticuloendothelial system in inflammatory, infectious or malignant diseases (anaemia of chronic disease, also known as anaemia of inflammation) |
| Macrophage iron accumulation within the lungs in idiopathic pulmonary haemosiderosis |
| Iron Overload |
| Due to Increased Iron Absorption |
| Hereditary haemochromatosis – commonly (amongst Northern Europeans) homozygosity for HFE C282Y but sometimes involving non-C282Y HFE or other genes ( HAMP, HFE2 [encoding hemojuvelin] , TFR2, SLC40A1 ) Substantial ineffective erythropoiesis (e.g. β thalassaemia intermedia and major, some types of sideroblastic anaemia, congenital dyserythropoietic anaemia) Sub-Saharan iron overload (‘Bantu siderosis’) – only in combination with increased dietary iron Other rare inherited disorders (e.g. congenital atransferrinaemia, DMT1 deficiency, acaeruloplasminaemia) Inappropriate iron therapy (rare) |
| Due to Multiple Blood Transfusions for Refractory Anaemias or for other Reasons |
| Thalassaemia major |
| Aplastic anaemia |
| Myelodysplastic syndromes |
| Sickle cell disease (when regularly transfused) |
Methods for assessing iron status
The methods used to assess iron status are summarised in Table 9-3 . Some are not generally applicable but have value in the standardisation of indirect methods. The determinations of Hb and red cell indices are described in Chapter 3 .
| Measurement | Reference Range (Adults) | Diagnostic Use | Confounding Factors |
|---|---|---|---|
| Full Blood Count | |||
| Haemoglobin concentration | Male: 130–170 g/l Female: 120–150 g/l | Defining anaemia and assessing its severity; response to a therapeutic trial of iron confirms iron deficiency anaemia | Other causes of anaemia besides iron deficiency |
| Mean cell volume | 83–98 fl | Low values may indicate iron deficient erythropoiesis | May be reduced in disorders of haemoglobin synthesis other than iron deficiency (thalassaemia, sideroblastic anaemias, anaemia of chronic disease). May be reduced in other conditions. |
| Mean cell haemoglobin | 27–32 pg | Low values may indicate iron deficient erythropoiesis | May be reduced in disorders of haemoglobin synthesis other than iron deficiency (see above) |
| Tissue Iron Supply | |||
| Serum iron | 10–30 μmol/l | Low values in iron deficiency, high values in iron overload | Labile, but use of a fasting morning sample reduces variability; reduced in acute and chronic disease |
| Total iron-binding capacity (TIBC) | 47–70 μmol/l | High values are characteristic of tissue iron deficiency Low values in iron overload May also be calculated from transferrin concentration (transferrin g/l × 25) | Rarely used on its own Reliable reference ranges not available |
| Unsaturated iron-binding capacity (UIBC) | See text | ||
| Transferrin saturation [iron/TIBC] × 100 | 16–50% | Low values in iron deficiency, high values in iron overload Raised level is an early indicator of iron accumulation in hereditary haemochromatosis | See serum iron (above) |
| Iron Supply to the Bone Marrow | |||
| Serum transferrin receptor (sTfR) | 2.8–8.5 mg/l * | Increased sTfR, ZPP or % hypochromic red cells, or reduced red cell ferritin, may indicate impaired iron supply to the bone marrow. sTfR is useful for identifying early iron deficiency and, with a measure of iron stores, distinguishing this from ACD. In ACD, sTfR only increases in the presence of tissue iron deficiency. | sTfR concentration is related to extent of erythroid activity as well as iron supply to cells; ZPP, red cell ferritin and % hypochromic cells are stable measures determined at the time of red cell formation. ZPP may be increased by other causes of impaired iron incorporation into haem (some sideroblastic anaemias, lead poisoning, inflammation and in X-linked protoporphyria); % hypochromic cells will be affected by change in red cell volume on sample storage |
| Red cell zinc protoporphyrin (ZPP) | < 80 μmol/mol haemoglobin | ||
| Red cell ferritin (‘L’ type) | 3–40 ag/cell | ||
| % Hypochromic red cells | < 6% | ||
| Iron Stores | |||
| Serum ferritin | Male: 15–300 μg/l Female: 15–200 μg/l | Correlated with body iron stores from deficiency to overload | Increased: as acute-phase protein and by release of tissue ferritin after organ damage (particularly liver disease) Increased in rare inherited disorders of ferritin overproduction Decreased: vitamin C deficiency |
| Tissue Iron | |||
| Chemical assay: liver | 3–33 μmol/g dry weight | Confirmation of iron overload | Adequate biopsy sample required |
| Perls stain of liver | (Grade) | Confirmation of iron overload, also to distinguish between parenchymal and macrophage iron accumulation | Adequate biopsy sample required |
| Perls stain of bone marrow | (Grade) | Graded as absent, present or increased Most commonly used to differentiate ACD from iron deficiency anaemia | Adequate biopsy sample required |
| Quantitative phlebotomy | < 2 g Fe | Assessment of the amount of storage iron for confirmation of iron overload in hereditary haemochromatosis and other iron-loading conditions with simultaneous treatment of the iron overload. | Interpretation should take into account that early diagnosis will be associated with lower iron loads than used to be obtained when late diagnosis was more common |
| Urine-chelatable Fe (after intramuscular injection of deferoxamine) | < 2 mg/24 h | Rarely used but may provide confirmation of iron overload | |
| Imaging | |||
| MRI (magnetic resonance imaging) | Available both for hepatic and for cardiac iron deposition | Machines only widely available in developed countries | |
| SQUID (superconducting quantum interface device) | Quantitation of liver iron overload using magnetic properties of iron | Not available in UK and rarely available worldwide | |
Serum ferritin assay
With the recognition that the small quantity of ferritin in human serum (15–300 μg/l in healthy men) reflects body iron stores, measurement of serum ferritin has been widely adopted as a test for iron deficiency and iron overload. The first reliable method to be introduced was an immunoradiometric assay in which excess radiolabelled antibody was reacted with ferritin and antibody not bound to ferritin was removed with an immunoadsorbent. This assay was supplanted by the two-site immunoradiometric assay, which is sensitive and convenient. Since then the principle of this assay has been extended to non- radioactive labelling, including enzymes (enzyme-linked immunosorbent assay or ELISA). Most current laboratory immunoassay systems for clinical laboratories include ferritin in the assay repertoire. Factors to be considered when selecting an immunoassay system are discussed later. A detailed method, for which the most sophisticated equipment required was a microtitre plate reader, is described in the previous edition of this book.
Immunoassay for ferritin
Selecting an assay method
The following notes may be of use for those considering introducing a ferritin assay into a clinical laboratory using an immunoassay system. The major manufacturers of immunoassay analysers include ferritin in the test menu and allow for either batch or random access operation. Most use chemiluminescent signal detection with microparticle separation of free and ferritin-bound labelled antibody.
- 1.
Limit of detection. Most current assays have a lower limit of < 1 μg/l. This is adequate for all clinical purposes.
- 2.
The ‘high-dose hook’. This is a problem peculiar to labelled-antibody assays when sera with very high ferritin concentrations give anomalous readings in the lower part of the standard curve. Most current commercial assays are not affected. Because of the wide range of serum ferritin concentrations that may be encountered in hospital patients (0–40 000 μg/l), it is essential to dilute and re-assay any samples giving readings higher than the working range of the assay. This may be done automatically in some systems but might require manual dilution.
- 3.
Interference by non-ferritin proteins in serum. This may occur with any method but particularly with labelled-antibody assays. Serum proteins may inhibit the binding of ferritin to the solid phase when compared with binding in buffer solution alone. Such an effect may be avoided by diluting the standards in a buffer containing a suitable serum or by diluting serum samples as much as possible. For example, in the assay described in the previous edition of this book, the sample is diluted 20 times with buffer. Another cause of error, difficult to detect, is interference by antibodies to animal immunoglobulins. These antibodies bind to the animal immunoglobulins used to detect the antigen and form artefactual ‘sandwiches’, thereby falsely elevating the reading. Such antibodies are found in up to 10% of patients and normal subjects. Interference may be reduced by adding the appropriate species of animal immunoglobulins to block the cross-reaction, but this is not always successful. One solution is to use antibodies from different species as solid-phase and labelled antibodies. Thus one may use a polyclonal, rabbit antiferritin to coat plates in the ELISA with a polyclonal sheep antiferritin labelled with horseradish peroxidase as the second antibody.
- 4.
Reproducibility. Most assays are satisfactory. With microtitre plate assays there may be ‘edge’ effects (differences between readings for inner and outer wells).
- 5.
Dilution of serum samples. It should be established that both standard and serum samples dilute in parallel over a 100-fold range.
- 6.
Accuracy. The use of the WHO standard ferritin preparation is recommended. Calibrate the working standard against that of the World Health Organisation (WHO) (standard for the assay of serum ferritin 94/572, recombinant human L type ferritin-information available at www.nibsc.org ).
Interpretation
The use of serum ferritin for the assessment of iron stores has become well-established. In most normal adults, serum ferritin concentrations lie within the range of 15–300 μg/l. During the first months of life, mean serum ferritin concentrations change considerably, reflecting changes in storage iron concentration. Concentrations are lower in children (< 15 years) than in adults and from puberty to middle life are higher in men than in women. In adults, concentrations < 15 μg/l indicate an absence of storage iron. Reference ranges quoted by kit manufacturers vary and this is partly a result of the selection of ‘normal’ subjects. Sometimes subjects with iron deficiency are included and sometimes they are excluded. The interpretation of serum concentration in many pathological conditions is less straightforward, but concentrations < 15 μg/l indicate depletion of storage iron. In children, mean levels of storage iron are lower and a 12 μg/l threshold has been found to be appropriate for detecting iron deficiency.
Iron overload causes high concentrations of serum ferritin, but these may also be found in patients with liver disease, infection, inflammation or malignant disease. In addition some rare inherited causes of increased ferritin production unlinked to iron stores occur. Careful consideration of the clinical evidence is required before concluding that a high serum ferritin concentration is primarily the result of iron overload and not a result of tissue damage or enhanced synthesis of ferritin. A normal ferritin concentration provides good evidence against iron overload but does not exclude hereditary haemochromatosis. This is because the most common type of hereditary haemochromatosis in Northern Europeans is a late-onset condition and iron stores may remain within the normal range for many years.
Serum ferritin concentrations are high in patients with advanced haemochromatosis, but since the serum ferritin may be within the normal range its estimation should not be used alone to screen the relatives of patients or to assess re-accumulation of storage iron after phlebotomy. The early stages of iron accumulation are detectable by an increased serum iron concentration, a decreased unsaturated iron-binding capacity and increased transferrin saturation. In this situation, the measurement of serum iron and total iron-binding capacity provides useful clinical information not given by the ferritin assay.
In patients with acute or chronic disease, interpretation of serum ferritin concentrations is less straightforward and patients may have serum ferritin concentrations up to 100 μg/l despite an absence of stainable iron in the bone marrow. Ferritin synthesis is enhanced by interleukin-1 (IL1) – the primary mediator of the acute-phase response. In patients with chronic disease, the following approach should be adopted: low serum ferritin concentrations indicate absent iron stores, values within the normal range indicate either low or normal levels and high values indicate either normal or high levels. In elderly patients a ferritin below 45 μg/l is usually indicative of iron deficiency with a ferritin level of up to 75 or 100 μg/l in the elderly being compatible with iron deficiency. In terms of adequacy of iron stores for replenishing haemoglobin in patients with anaemia, the degree of anaemia must also be considered. Thus a patient with Hb of 100 g/l may benefit from iron therapy if the serum ferritin concentration is < 100 μg/l because below this level there is unlikely to be sufficient iron available for full regeneration. Here, measurement of serum transferrin receptor concentration may be of value (see p. 182 ).
Immunologically, plasma ferritin resembles the ‘L-rich’ ferritins of liver and spleen and only low concentrations are detected with antibodies to heart or HeLa cell ferritin, ferritins rich in ‘H’ subunits. The heterogeneity of serum ferritin on isoelectric focusing is largely the result of glycosylation and the presence of variable numbers of sialic acid residues and not variation in the ratio of H to L subunits. Attempts to assay for ‘acidic’ (or ‘H’-rich) isoferritins in serum as tumour markers have not been successful. The iron content of serum ferritin is low and measurement of this iron has no diagnostic use.
Estimation of serum iron concentration
Iron is carried in the plasma bound to the protein transferrin (molecular mass 78 000 Da). This molecule binds two atoms of iron as Fe 3 + and delivers iron to cells by interaction with membrane transferrin receptors. The following method is a modification of that recommended by the International Council for Standardisation in Haematology (ICSH) and is based on the development of a coloured complex when ferrous iron released by serum protein denaturation in the presence of reducing agent is treated with a chromogen solution.
Reagents and materials
Reagents must be at least of analytical grade with the lowest obtainable iron content. Before handling any of the reagents and materials described below a risk assessment should be carried out. If there is significant risk of harm, the word ‘caution’ has been added.
Preparation of glassware
It is essential to avoid contamination by iron. If possible, use disposable plastic tubes and bottles. If glassware is to be used, wash in a detergent solution, soak in 2 mol/l HCl (caution) for 12 h and finally rinse in iron-free water.
Protein precipitant
100 g/l trichloroacetic acid (0.61 M) and 22.7 mmol/l ascorbic acid in 0.9 mol/l HCl. The original reducing agent was thioglycolic acid. Ascorbic acid is an alternative reducing agent, although there may be more interference from copper. However, any benefit from reduced copper interference is usually outweighed by the associated health and safety problems of working with thioglycolic acid. To 45 ml of 1 mol/l HCl in a 50-ml screwcap polypropylene tube add 5 ml of 6.1 mol/l trichloroacetic acid solution (Sigma–Aldrich T0699; caution). Add 200 mg of ascorbic acid and mix. Make a fresh solution when required and discard after 4 h.
Chromogen solution (ferrozine)
In 100 ml of 1.5 mol/l sodium acetate dissolve 25 mg of ferrozine [Sigma–Aldrich 82950, monosodium 3-(2-pyridyl)-5,6-bis(4-phenylsulphonic acid)-1,2,4-triazine] (caution). Store in the dark for up to 4 weeks.
Iron-free water
Use deionised water for the preparation of all solutions.
Iron standard 80 μmol/l
Add 22.1 ml of deionised water to a universal container (the easiest way is by weight). Add 200 μl of 2 mol/l HCl and mix. Add 100 μl of iron standard solution (1000 μg of Fe/ml in 1% v/v HCl, Sigma–Aldrich 30595–2) and mix. Store for up to 2 months at room temperature.
Method
Place 0.5 ml of serum (must be free of haemolysis), 0.5 ml of working iron standard and 0.5 ml of iron-free water (as a blank), respectively, in each of three 1.5-ml polypropylene microcentrifuge tubes with lids. Add 0.5 ml of protein precipitant to each and replace the lid. Mix the contents vigorously (e.g. with a vortex mixer) and allow to stand for 5 min. Centrifuge the tube containing the serum at 13 000 g for 4 min (in a microfuge) to obtain an optically clear supernatant. To 0.5 ml of this supernatant and to 0.5 ml of each of the other mixtures, add 0.5 ml of chromogen solution with thorough mixing. After standing for 10 min, measure the absorbance in a spectrophotometer against water at 562 nm. If a microcentrifuge is not available, use double the volume of serum and reagents in a 3-ml plastic tube with lid and centrifuge at 1500 g for 15 min in a bench centrifuge.
If ethylenediaminetetra-acetic acid (EDTA)–plasma is used, the colour develops more slowly and its use is therefore not recommended. Iron chelators (e.g. deferoxamine) also delay colour development.
Calculation
Serum iron μ mol / l = A 562 test − A 562 blank A 562 standard − A 562 blank × 80
Stay updated, free articles. Join our Telegram channel

Full access? Get Clinical Tree


