Imaging in Oncology
14.1 INTRODUCTION
The need to detect and characterize cancer in an individual has resulted in a dramatic increase in the use of imaging over the last 20 years. Clinical imaging is now a routine part of diagnosis, staging, guiding localized therapy, and assessing response to treatment. Cancers occur anatomically among surrounding normal tissues, including critical structures, such as major vessels and nerves, and delineation of the extent of malignant and nonmalignant tissues is essential for planning surgery and radiation therapy. Cancers also have morphological, physiological, and biochemical heterogeneity (see Chaps. 10 and 12), which is important in understanding their biology and response to treatment. The ability to explore and define this heterogeneity with modern imaging methods, as well as serum and tissue-derived metrics, will enable “personalized cancer medicine.”
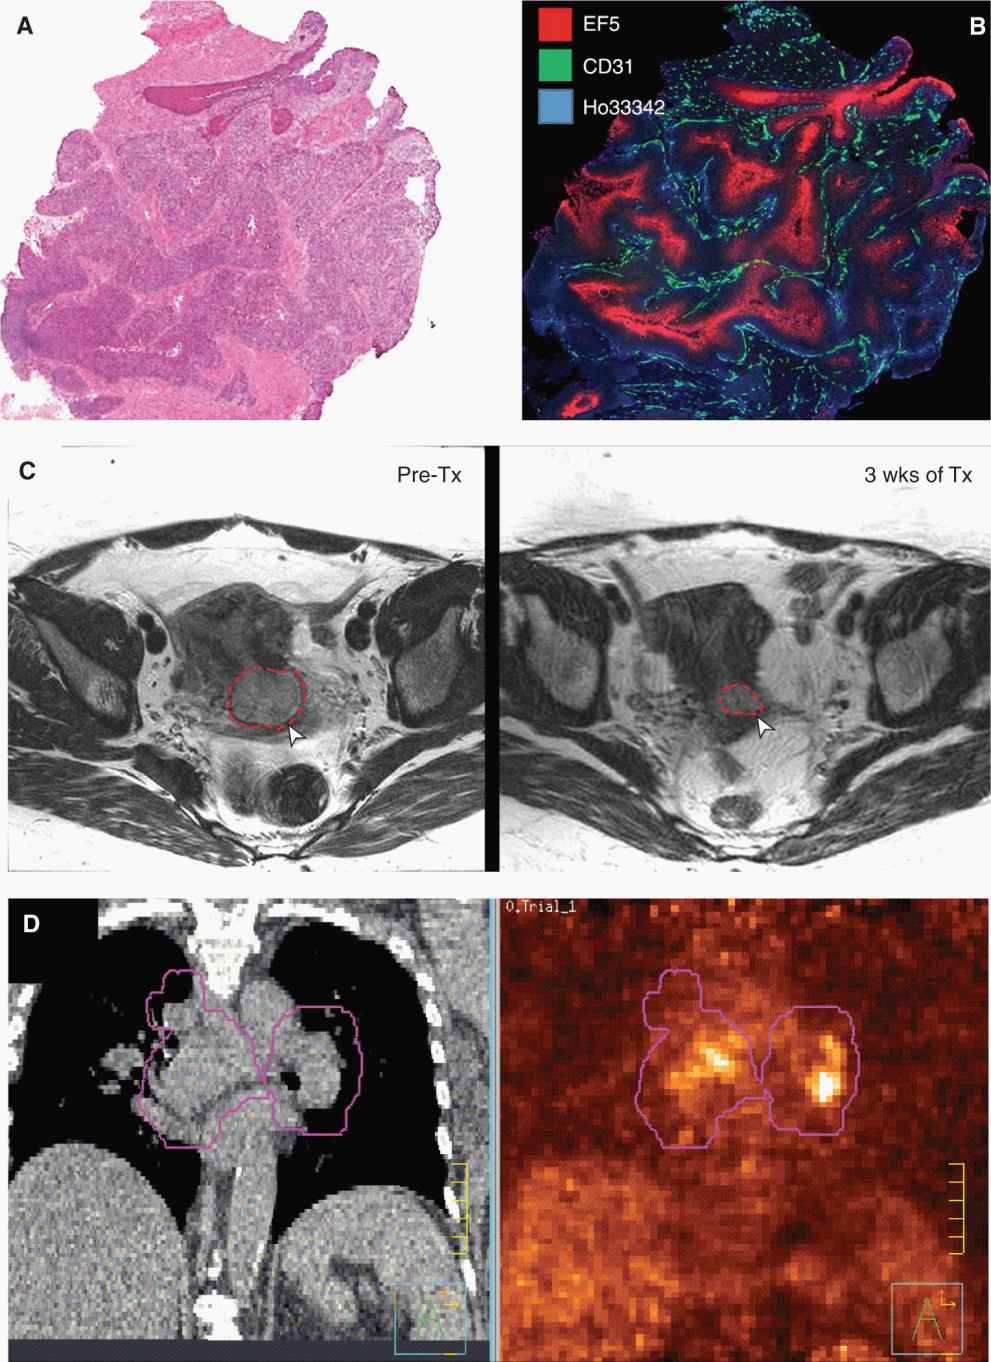
Imaging is diverse in that it offers an “anatomical image” of a mass on a computed tomography (CT) or a magnetic resonance (MR) image, a “functional image” of disease status in positron emission tomography (PET) images of glucose metabolism, and a “microscopic image” used during classification of histological type and grade. Imaging is applied at these multiple levels to help characterize, understand, and treat cancer (Fig. 14–1) and there is general acceptance that advances in imaging are central in the fight against cancer. This chapter provides a brief introduction to the rapidly evolving field of oncological imaging by presenting both the physical principles underlying the most common imaging modalities and their clinical and research applications in oncology.
FIGURE 14–1 Different visual representations of cancer at different spatial scales and time points. A) Traditional hematoxylin and eosin (H&E) staining of a cervix cancer xenograft. These stains highlight the cellular architecture and are used to assess histological type and grade of cancer. B) More advanced immunohistochemical staining of the same tumor demonstrating the complex microenvironment with the tumor. Substantial variation in microvasculature (CD31, green) and oxygen tension (EF5, red) are seen despite the evidence that the tumor is perfused (indicated by the injected Hoechst 33342 dye, blue). C) T2-weighted MR image of a cancer of the cervix before (left) and during (right) radiotherapy (after 48 Gy) showing regression of the tumor as outlined in red. D) Slice taken from a CT image of a lung cancer patient being planned for radiation therapy. The corresponding fluorodeoxyglucose (FDG)-PET image is on the right. Functional and anatomical information are often complementary in describing the extent and nature of the cancer. The purple outlines demonstrate the volume to be irradiated as part of the radiation treatment.
14.2 GENERAL CONCEPTS RELATING TO CANCER IMAGING
Imaging is a broad science that encompasses the design, development, evaluation, and application of technologies that allow spatial and temporal characterization of an object; ideally, with a minimum of invasion. When using imaging, it is important to understand what signal is being detected and how this signal relates to the underlying biological processes or structural elements. Imaging signals can be broadly classified as endogenous or exogenous. Endogenous signals are those associated with the intrinsic characteristics of the body and how these characteristics affect the imaging modality. For example, a chest x-ray detects a lung lesion because of the intrinsic difference in the x-ray attenuation coefficient of the lung and the tissue of the tumor. Similarly in the MR image of a brain tumor, increased swelling (edema) alters the environment of the protons in water and results in an altered MR signal around the tumor. Exogenous signals are those that arise from the introduction of an imaging agent (eg, injecting an iodinated x-ray-absorbing contrast agent for CT scanning or injecting a radiolabeled sugar analog for PET imaging of metabolism) that alters or generates the image signal in a manner that can be distinguished from normal, endogenous signals.
Advances in molecular biology have stimulated the development of a variety of targeted molecular imaging agents whose distribution in the body reflects the regional differences in biological avidity or expression of the targets to which they bind. This field is referred to as molecular imaging. Multimodal imaging procedures, hybrid imaging devices, and probes that allow the use of many different imaging (endogenous and exogenous) signals to be acquired and coregistered may also be used to provide a more complete characterization of the cancer. The development of combination PET and CT scanners highlights the value of combining 2 modalities wherein the specificity of disease detection was improved through the combination of anatomical and functional information in a single representation. The complexity of biological, structural, and microenvironmental factors (eg, stroma, blood vessels, hypoxia, interstitial fluid pressure) within solid cancers (see Chaps. 10, 11 and 12) is likely to require the use of many imaging modalities to fully characterize the multiple biological states of an individual’s cancer (see Fig. 14–1).
Modern imaging systems are largely digital and allow separation of the image signals into many adjacent spatial compartments called pixels or voxels (see PET image in Fig. 14–1D for a “pixelated” image). Systems capable of generating images with smaller pixels or voxels do not necessarily have higher resolution. The ability of an imaging system to resolve the spatial detail of the underlying image signal is referred to as its limiting spatial resolution, and this is determined by the physics of signal formation. For example, a large x-ray focal spot in a chest radiography machine causes a blur in the image as a result of x-rays emanating from different positions in the focal spot creating an image of the same anatomical structure at slightly different, overlapping positions. This limits the spatial resolution or detail contained in the resulting chest radiograph. Similarly in the case of a PET image, the range (a few mm) travelled by the positrons, emitted by the radiolabeled molecule in the tissue, before they annihilate with an electron and create the parallel-opposed 511 keV γ-rays that are detected by the scanner (see Sec. 14.3.3), limits the PET scanner’s ability to resolve fine detail in the heterogeneity in uptake within a tumor.
In addition to spatial resolution, the underlying signal needs to be detected in each voxel with a sufficient level of precision to make the image of value. The ratio of the signal in a voxel to the variation in signal found in its neighbors (or to itself over time) is a metric referred to as the signal-to-noise ratio (SNR). This is an important metric in characterizing the performance of an imaging system under specific conditions. Although it is almost always desirable to increase the SNR, this typically comes at a cost through either increased imaging time, increased radiation exposure, a loss in resolution, or, in the context of exogenous imaging agents, toxicity associated with a larger quantity of the imaging agent injected.
14.3 IMAGING TECHNOLOGIES
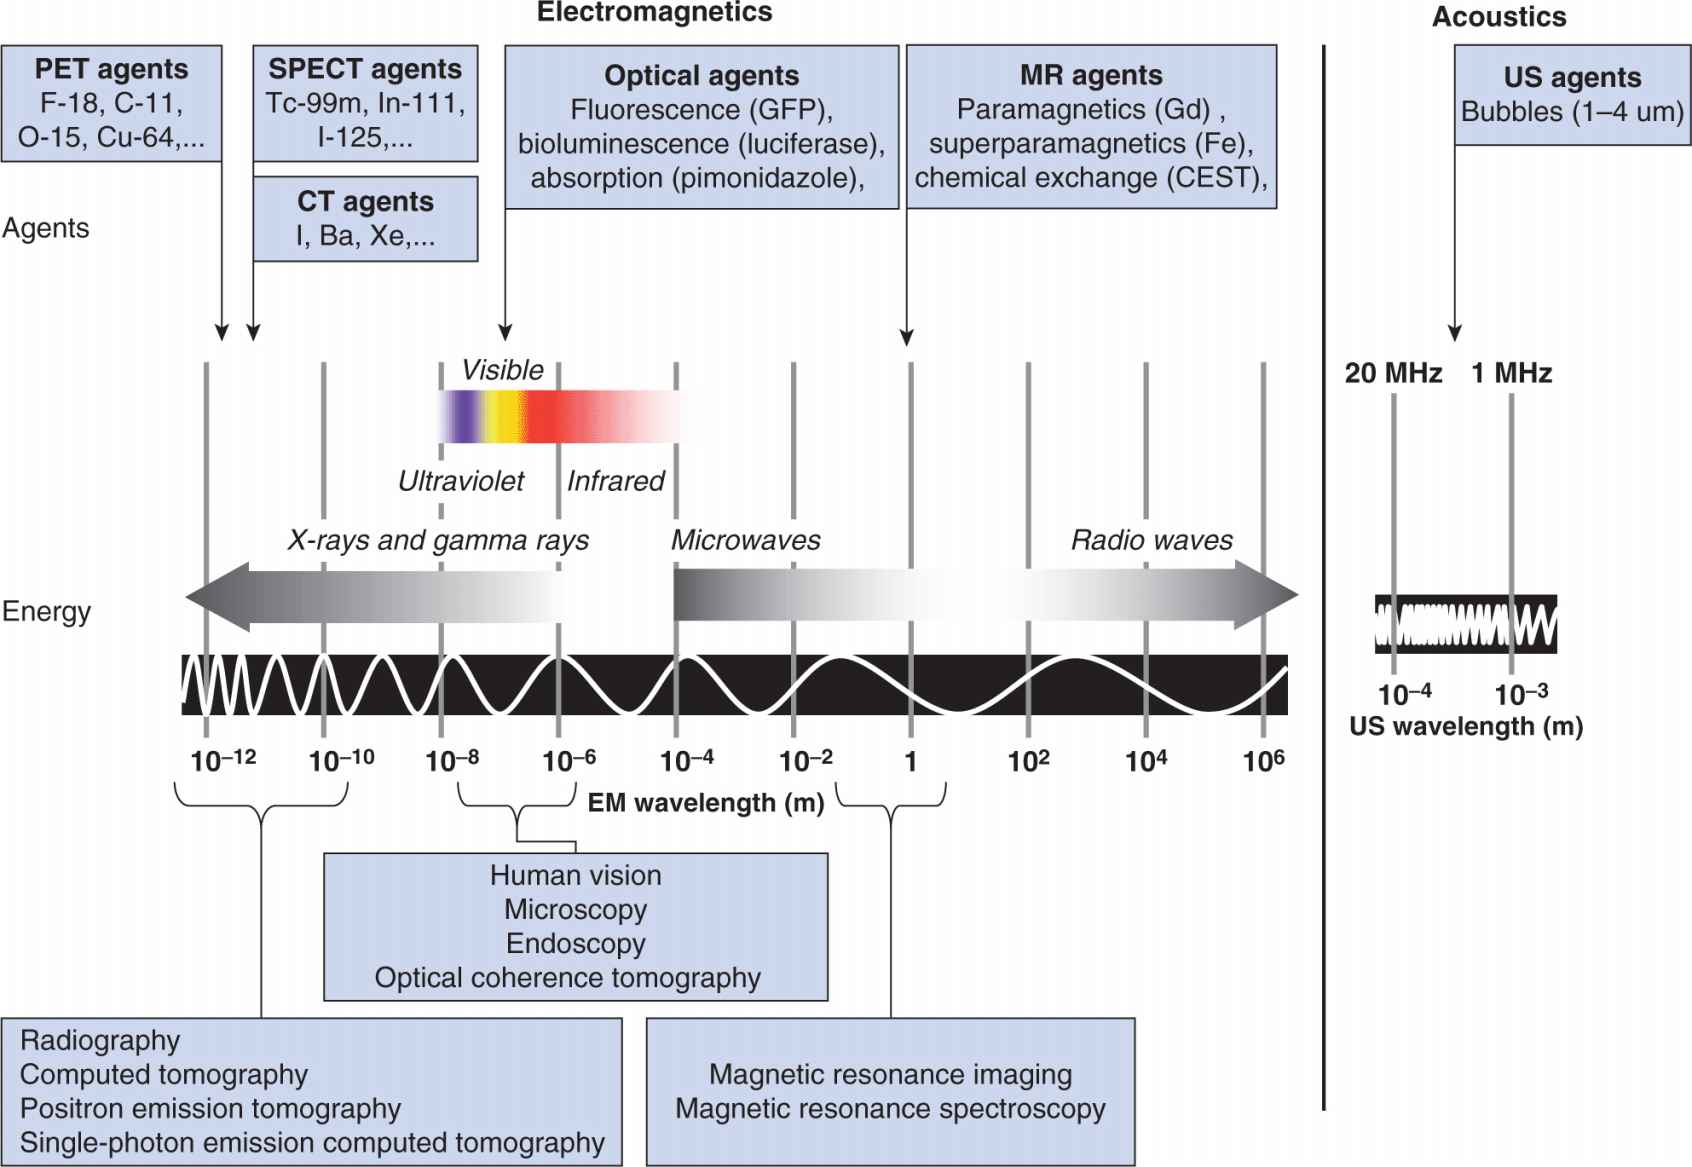
Imaging methods employ different forms of energy to probe and detect anatomy and biological processes. Figure 14–2 presents these energy forms together with an overlay of exogenous imaging agents. In the following sections, the dominant imaging modalities used in cancer are reviewed in terms of the process of signal formation, as well as a synopsis of their more interesting applications in oncology.
FIGURE 14–2 Images can be developed from endogenous signals or from exogenous signals induced by the introduction of contrast agents or molecular probes. The detection of these signals is through either electromagnetic or acoustic energy transfer. Imaging agents are designed to either produce the detected signal (eg, radiolabeled PET/single-photon emission computed tomography [SPECT]) or to alter the interaction between the object and the applied energy (eg, high atomic number materials such as iodine, barium, or xenon in radiography and CT, paramagnetic agents in MR, bubbles in ultrasound). Optical imaging operates at energies corresponding to biological processes and can therefore provide insight into active biological processes (eg, detection of bioluminescent signals). Similarly, MR offers insight into the chemical activity in the body by exploiting effects related to the impact of chemical milieu on nuclear magnetic resonance to create image-like maps of these effects. This is referred to as MR spectroscopy imaging (MRSI). Chemical milieu can also be probed through the exchange of protons between specific chemical species (CEST).
14.3.1 X-ray–Based Systems: Radiography and Computed Tomography
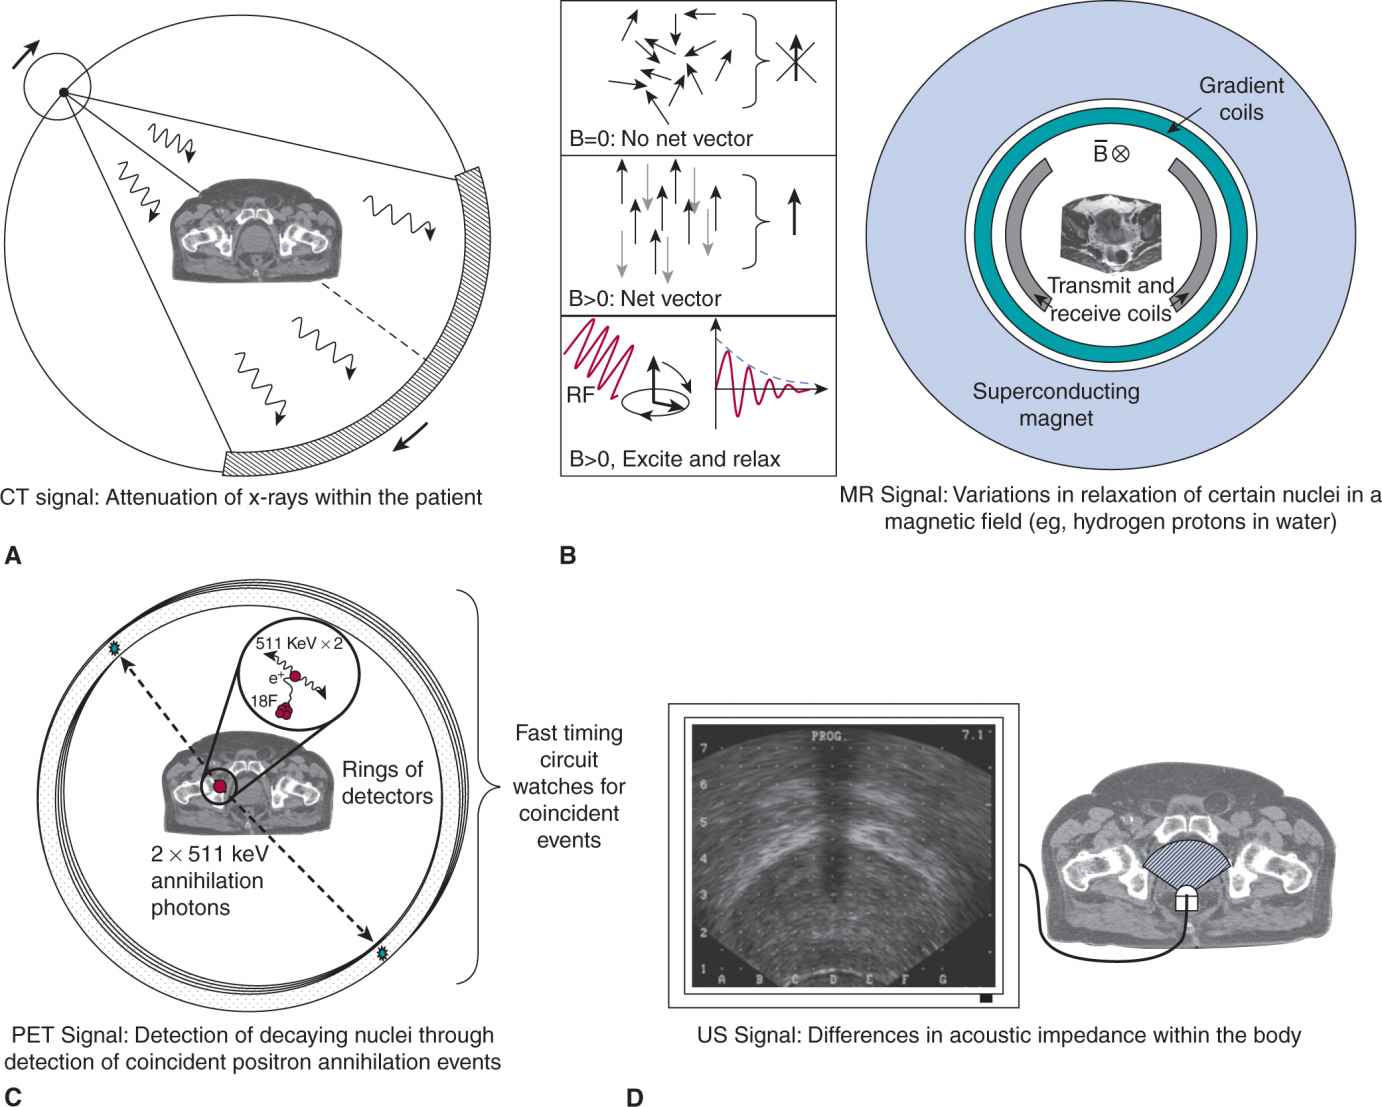
X-ray imaging is based upon the differential attenuation of x-rays within different tissues in the body. The discovery of x-rays by Roentgen in 1895 revealed the value of noninvasive imaging and its clinical applications were immediate. Despite 100 years in advancing this technology, the main methods of x-ray generation and detection have not changed substantially: a vacuum x-ray tube and a 2-dimensional (2D) detector on either side of the subject have remained the central elements. Although the chest x-ray is still a useful tool, x-ray–based CT has become a standard technology to detect and stage cancer since its invention in the 1960s by Hounsfield and Cormack (for which they shared the 1979 Nobel Prize in Physiology or Medicine). The basic process for image generation is shown in Figure 14–3A. Briefly, a highly efficient 2D array of x-ray detectors is located opposite a powerful x-ray tube operating in excess of one hundred thousand volts (~120 kVp). The gantry rotates through 360 degrees over a period of less than 0.5 seconds while acquiring hundreds of digital radiographs of the patient. A computerized process of digital filtering and back-projection allows an estimate of the x-ray attenuation coefficient of each voxel in a “slice” (1 to 5 mm thick) through the patient to be estimated (Kak et al, 1988). Modern CT scanners can acquire multiple slices simultaneously and images of the entire body can be acquired by moving the patient through the CT scanner during rotation. Computerized postprocessing of the individual voxels then allows reconstruction of an image in any plane desired.
FIGURE 14–3 Imaging technologies used in oncology. A) In a modern CT imaging system, a multirow detector and high-power x-ray source rotate about the patient at high speed (>2 revolutions per second). Thousands of “projections” are collected as the patient advances through the scanner and computers are used to “reconstruct” multiple imaged slices representing the attenuation characteristics of the patient. This is presented in grayscale form as the CT image. B) An MR image signal has many forms, but relies largely on the excitation and relaxation of a population of field-aligned magnetic dipoles associated with protons (hydrogen nuclei) in water. MR imaging systems consist of a large superconducting magnet that maintains the static field (typically 1.5 Tesla), that causes the field alignment of the magnetic dipoles of hydrogen nuclei of the water molecules, and a set of gradient-inducing coils that manipulate the magnetic field throughout the volume. The radiofrequency transmit and receive coils are responsible for perturbing the hydrogen nuclei and then recording their relaxation back to the ground state in the presence of the magnetic field. C) PET imaging is often used in conjunction with a CT system (called a PET-CT scanner). PET image formation is achieved through detection of positron-emitting decay events that ultimately produce pairs of 511 keV photons at approximately 180 degrees from each other. This image is then superimposed on the CT image generated at the same time by the dual-purpose scanner. D) Ultrasound (US) imaging systems exploit variations in acoustic impedance within the body to generate images. Ultrasound waves are reflected at boundaries between tissues of differential impedance (eg, fat, muscle, bladder wall). In this figure, an axial ultrasound image of the prostate is shown as generated by a transrectal ultrasound probe (see illustration).
The CT image signal is measured in Hounsfield units (HU), a linear measure of the attenuation coefficient of the tissue relative to water (water is 0 HU and air is-1000 HU). Images formed at typical imaging doses would have approximately 1% noise (10 HU) and percent differences in HU between tissues such as fat and muscle are only approximately 5% (corresponding to a differential of ~50 HU). It was originally hoped that quantifying the CT signal could be used to classify normal tissue and disease, but the lack of specificity of the CT signal has resulted in little progress on this front. However, the recent development of dual-energy CT imaging systems provides a much higher fidelity in characterizing tissues, and these systems will revitalize the concept of tissue classification (Gupta et al, 2010). High-atomic-number contrast agents (eg, iodinated molecules) are used routinely in CT imaging to increase the contrast-to-noise ratio of various structures and are used in bolus studies with fast (2 to 3 images per second) repetitive scanning to study the permeability of tissues perfusion (Miles, 1991). Xenon gas has also been explored as an agent that is inhaled to assess lung ventilation and as an agent to measure tissue blood flow in hepatocellular carcinoma (Murakami et al, 2004).
CT has the advantage that it achieves high spatial resolution (<1 mm), soft-tissue discrimination, is highly reproducible, and can be employed quantitatively for measuring tumor size and detecting response. However, the image quality in terms of SNR is related to the applied dose of ionizing radiation—typical CT imaging doses range from 1 to 10 cGy (see Chap. 15, Sec. 15.2.2 for definition of radiation dose). As the first soft-tissue volumetric imaging modality, CT transformed oncological imaging and is used routinely for detection and diagnosis of cancer, as well as for monitoring patients that have undergone therapy. The clinical impact is seen in the management of the patient through noninvasive cancer staging (see Chap. 10, Sec. 10.3.1 for brief description of TNM staging), which has led to a reduction in the frequency of exploratory laparoscopic surgery. Characterization of regional extent of disease is undertaken using pretreatment, posttreatment, and follow-up CT imaging. CT also has a major role in directing therapy, including its use in directing radiofrequency ablation of liver metastases by interventional radiologists, assisting surgeons in head and neck surgery, and delineating lung tumors for image-guided stereotactic radiotherapy. There is widespread use of CT-guidance in interventional radiology and radiation therapy.
CT is used to screen for lung cancer in higher risk populations (see Chap. 22, Sec. 22.3.3) and randomized clinical trials have demonstrated its ability to improve outcome for people with lung cancer (Aberle et al, 2011). The value of CT screening for cancer in other sites has not been established and there are concerns about potential health effects and secondary malignancies relating to the use of CT scanning for screening the general public (Brenner et al, 2007; see Chap. 16, Sec. 16.8).
Recent interest in characterizing the vascularity of tumors has spurred the use of dynamic CT imaging (multiple slices/volumes per second) in which CT scanning is undertaken with a bolus intravenous (IV) injection of a low-molecular-weight-iodinated agent to characterize the vascularity and permeability of cancer lesions as it passes through the patient’s tissues. This is referred to as perfusion CT, functional CT, or, more recently, dynamic contrast-enhanced computed tomography (DCE-CT). One application of these methods is to detect response of hepatocellular carcinoma to antiangiogenic therapies. DCE-CT is sensitive to vascular changes that occur before conventional size-related measures of tumor response (Jiang et al, 2011).
14.3.2 Magnetic Resonance Imaging
The MR image signal arises from the following 5 concepts (see Fig. 14–3B): (a) a large ensemble of nuclear magnetic moments or “tiny bar magnets” (eg, hydrogen nuclei in water) are contained within the human body; (b) an applied, static magnetic field (eg, 1.5 Tesla [T]) sets a slight bias in their orientation—the higher the field, the larger the bias; (c) the application of an external radiofrequency field to perturb the moments from this bias; (d) the surrounding chemical and physical microenvironment impacts the time required (T1) to return to alignment (relax) with the static field; and (e) the ability of the ensemble to induce a measureable current in a detecting antenna (conducting loop) exterior to the object. Protons (and other atomic nuclei possessing a magnetic moment) within tissues oscillate, or precess, in this magnetic field (B) at a frequency (w) given by w = γB where the proportionality constant γ is called the gyromagnetic ratio; γ is specific for each nucleus and depends on the magnetic moment of the nucleus.
Damadian (1971) first proposed that the rate of relaxation of protons in water could distinguish normal from tumor tissue and demonstrated that tumors (sarcomas and hepatomas) had differing T1 relaxation times that were 1.5 to 2 times longer than in normal tissues in the same animal. These differences in relaxation times are a reflection of the different environments in which the protons relax to alignment with the static field—the presence of cancer alters this environment compared to that found in normal tissue.
The development of methods to generate images of nominal relaxation times followed from the work of Lauterbur (1973) and Mansfield (Mansfield and Maudsley, 1977) for which they received the Nobel Prize in Medicine in 2003. MR imaging (MRI) systems are now widely used in cancer detection and diagnosis. Figure 14–3B demonstrates the central components: A static magnetic field (typically 1.5 Tesla or 15,000 times the earth’s field) is generated by a superconducting magnet; the patient is placed within the magnet; gradient coils are used to create slight differences in magnetic field across the patient to encode for location; and, finally, a pair of antennae is responsible for exciting the nuclei and detecting the electromagnetic signal that they induce as they return to their ground states. Spatial information that allows the formation of images is obtained by slightly varying the applied magnetic field across the body in 3 orthogonal directions using the gradient coils.
In a 1.5-Tesla magnetic field, the precession frequency of water protons is 64 MHz. Radiofrequency (RF) pulses of energy applied at this frequency alter the angle at which the protons are precessing around the magnetic field lines. Once a 90-degree pulse is switched off, the protons gradually return to alignment with the static field. The time taken for the return to alignment (the T1 signal, also called the spin-lattice relaxation time) is one metric of the local chemical and physiological environment of the protons and can provide contrast between tissues. Similarly, the phase of their precession can be synchronized within the transverse plane (through a 180-degree pulse). When the RF is switched off, dephasing gradually occurs and the time to reduce the transverse magnetization is referred to as T2. This dephasing is associated with both molecular effects and inhomogeneity in the magnetic field; T2 is used commonly to distinguish soft tissues and is called the spin-spin relaxation time.
Because complete isolation of T1 and T2 signals is challenging, images are typically T1 or T2 “weighted” depending on the RF pulse sequence applied. Specifically, by varying the repetition time (TR) between RF pulse cycles and the time to sample the resulting signal or the echo time (TE), it is possible to “weight” the image. There are 3 basic weightings used in clinical practice: T1, T2, and proton-density weighting. In general, T1 weighting provides anatomical detail, while T2-weighted images give elevated signal for tissues with a higher content of free unbound water and are essential in imaging inflammation or “neoplastic” tissue. Proton density simply reflects the density of water protons available for signal production in the voxel.
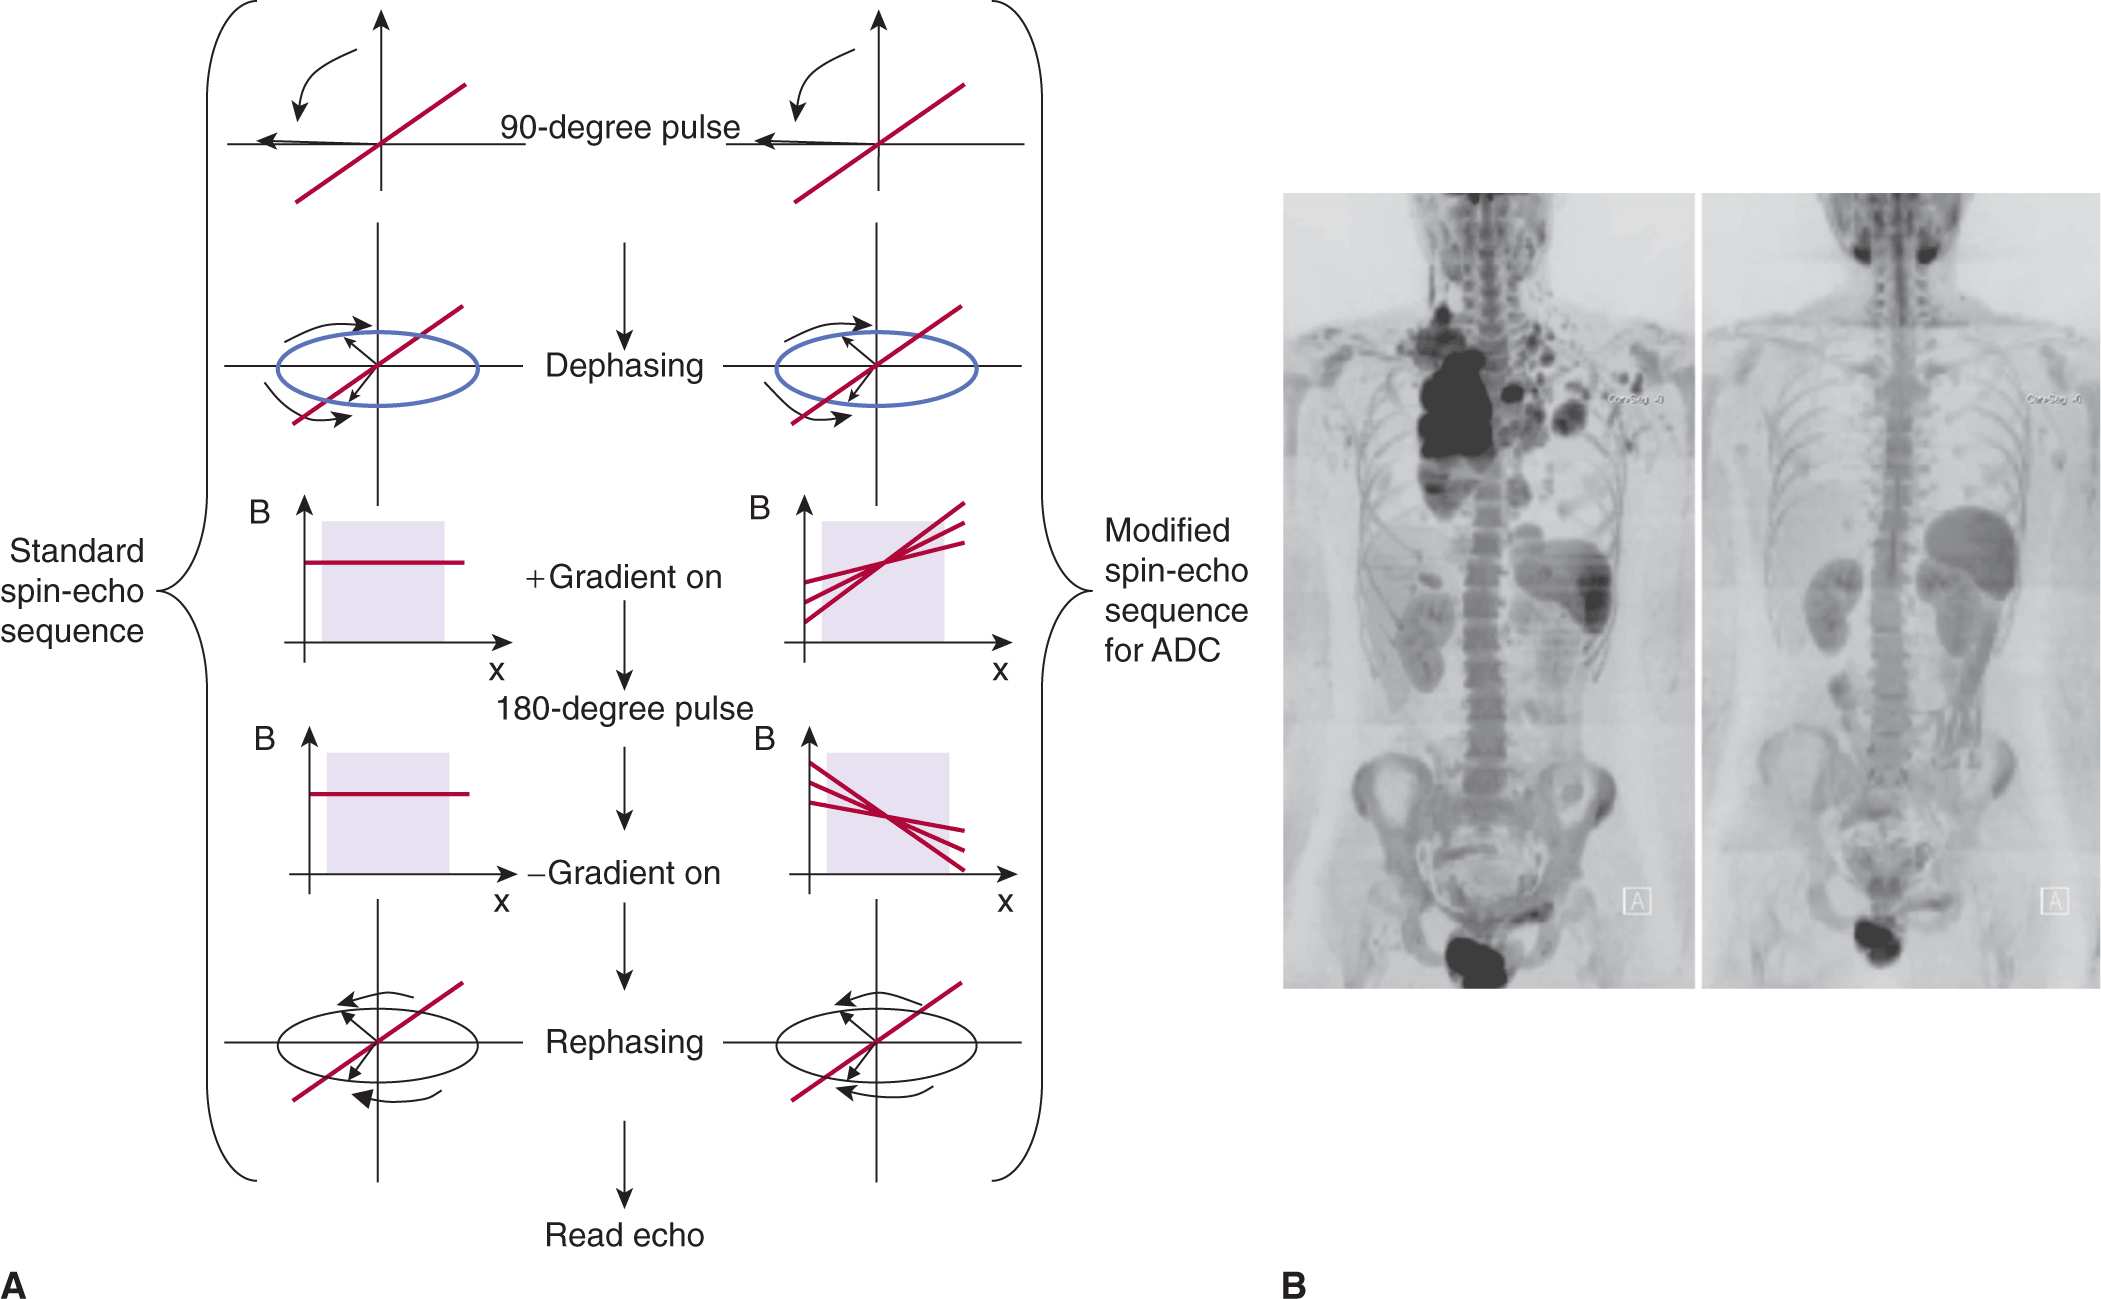
MR can be used to explore other tissue parameters, such as changes in local transport of water in tissue that may reflect cellular sensitivity to treatment. This can be characterized by exposing excited nuclei in tissue to variations in a magnetic field and examining the rate of signal loss; this is referred to as apparent diffusion coefficient (ADC) imaging (Le Bihan et al, 1986). Figure 14–4A illustrates the process used in MR to estimate the diffusion of water within a voxel (Hagmann et al, 2006). In brief, a conventional spin-echo sequence is modified by applying 2 gradient pulses before and after the 180-degree pulse to encode the degree of proton mobility (ie, diffusion) into a loss in recovered signal as a result of transport-induced imperfections in rephasing of the spins. Figure 14–4B presents diffusion-weighted images of a patient before and after treatment for lymphoma.
FIGURE 14–4 A) The ADC (or diffusion-weighted imaging [DWI]) imaging technique seeks to measure the diffusion of water within a voxel by exposing the excited water protons to a spatial gradient during their dephasing to encode for their diffusive transport. This exposure is done before and after a 180-degree spin-echo pulse. Voxels that contain spins exposed to differential fields because of diffusive transport will have a reduced echo following the 180-degree rephasing pulse. Those that are stationary will be refocused to within normal T2 losses. B) DWI is also of interest in assessing total cancer burden, as these techniques can also be used to image the entire body. In their review of DWI in oncology, Padhani et al (2011) demonstrate DWI in the assessment of pretreatment disease burden and its response to chemotherapy in a patient with Hodgkin lymphoma. The 2 panels show pre- and posttreatment DWI images. (Reproduced with permission from Padhani et al, 2011.)
Exogenous agents can be applied to alter the MR signal. Spin-lattice relaxation time (T1) and spin-spin relaxation time (T2) may be shortened considerably in the presence of paramagnetic species (eg, gadolinium), which have unpaired electrons. Stable agents that contain gadolinium are used in the clinical setting (eg, gadopentate dimeglumine or gadolinium-diethylenetriamine pentaacetic acid [Gd-DPTA]; gadoteridol [Gd-HP-D03A]), and there is growing interest in iron oxides, for detection and characterization of nodal disease (Harisinghani et al, 2006) or for use in cell “tracking” studies in animal research (Heyn et al, 2006). New MR contrast agents are being developed, including some that rely on the rapid exchange of protons between molecular environments to describe the chemical milieu (Sherry and Woods, 2008) and some that can increase the polarization of specific nuclei to enhance the MR signal by several orders of magnitude (Golman, Ardenkjaer-Larsen et al, 2003).
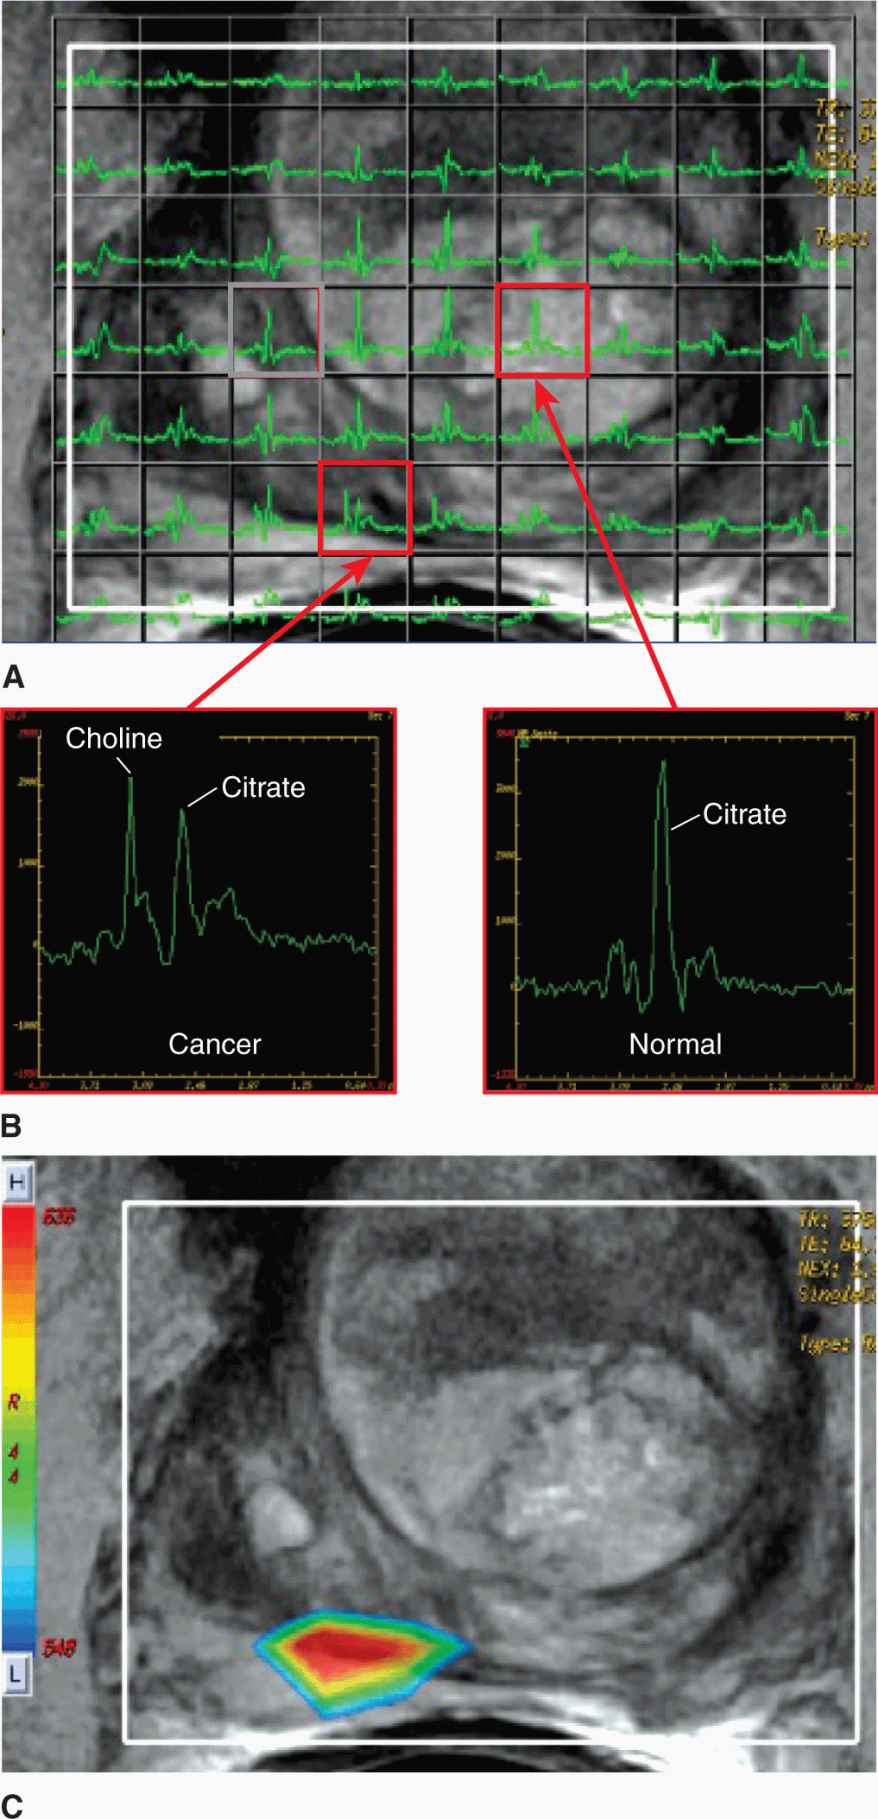
Magnetic resonance spectroscopy imaging (MRSI) involves the extension of nuclear magnetic resonance (NMR) techniques employed in chemistry to the concepts of imaging. Spectra associated with the chemical shift in resonance peaks for various biomolecules in small regions of interest can be acquired on MRI systems. Collecting a number of spectra in adjacent regions in a rectilinear array (Fig. 14–5A) and generating a coarse image is referred to as MRSI or chemical shift imaging (CSI). MRSI can be applied to protons in water or other nuclei with a magnetic moment such as 31P, 13C, and 19F. Figure 14–5B illustrates the nature of the spectra produced on a clinical 1.5-Tesla MR scanner when imaging the prostate; the poorly resolved spectra are reduced to ratios of peaks to form a color-coded image of disease burden. Adoption of higher field (3 Tesla) MR scanners will enable greater spectral separation of the peaks and may lead to accelerated adoption of these techniques (Glunde et al, 2011).
FIGURE 14–5 Magnetic resonance spectroscopy (MRS) offers the potential for metabolic imaging by detecting molecular environment-induced frequency shifts in the resonance of nuclei. A) A set of MR spectra acquired in a rectilinear array and overlaid on the conventional MR image of the prostate (1.5 Tesla with endorectal coil). The spectra contain a citrate peak present in normal and disease tissues, while the elevated choline peak corresponds to disease (B). C) Spectral analysis in these studies consists of calculating ratios of signal over specific frequency intervals or peak heights estimated from peak-fitting algorithms (eg, Cho/Cit ratios). These ratios are then converted to a color-coded pattern and overlaid on the MR image to identify regions of elevated disease burden.
The excellent soft-tissue discrimination of MR makes it well-suited to oncology and MRI has a role in the diagnosis, staging, and management of many solid cancer. For example, MR has become the dominant imaging method for cancers of the central nervous system where the high T1 contrast and sensitivity of T2 to changes in edema delineate the extent of disease and allow understanding of the patterns of spread. Its role in evaluating metastatic lesions in the spinal column, including those requiring urgent treatment because of spinal cord compression is definitive. MRSI is also employed in neurooncology as an additional classifier of disease prior to surgical intervention (Hollingworth et al, 2006). Although use of MR in breast screening or directing surgery is controversial, it is useful as a screening method for women at high risk (~20% probability) of developing breast cancer (Lehman et al, 2009). Dynamic contrast-enhanced magnetic resonance (DCE-MR) (conceptually equivalent to DCE-CT) is emerging as a bio-marker of drug activity in breast cancer (Moon et al, 2009) and is being used in clinical trials that assess response of disease to antivascular agents (Yankeelov and Gore, 2009) and to radiation therapy (Cao, 2011). There is a growing interest in the development of dedicated MRI systems to guide cancer therapy; this includes the direction of high-intensity focused ultrasound (HIFU), neurosurgery, and MR-guided radiotherapy (Lagendijk et al, 2008). Until recently, the relatively slow acquisition times have limited the use of MRI in sites influenced by motion (eg, chest), but this is changing rapidly with the development of faster imaging techniques that employ multiple channels. The progression to higher field strength (3 Tesla) offers increases in SNR and spatial resolution, and MR is attractive in that there is no exposure of subjects to ionizing radiation and hence to risk of second (radiation-induced) malignancies (see Chap. 16, Sec. 16.8).
14.3.3 Single-Photon and Positron Emission Tomography
Unstable nuclei that emit high-energy gamma-rays or positrons provide a powerful tool in probing the nature of cancer and contribute to its management. Molecules containing such nuclei can be injected into the body and accumulate through a variety of processes that reflect different metabolic aspects of the disease state. Single-photon emission computed tomography (SPECT) imaging operates on the principle of emission of gamma-rays in the range of 100 keV that are detected by a collimated crystal (gamma camera) that encodes for direction and location in the field of view. The gamma camera images are then used to reconstruct an estimate of the distribution of the gamma-ray emitters in the body. SPECT is heavily utilized in cancer for the staging and assessment of cancer progression in the form of a “bone scan.” In this technique, the patient is injected with a small amount of radioactive material such as technetium-99m (99mTc)-labeled medronic acid (a bisphosphonate) and then scanned with a gamma or 3-dimensional (3D) SPECT camera. The accumulation of the medronic acid in regions of bone remodeling is a sensitive detector of metastasis to bone.
In contrast to SPECT, PET employs radioisotopes that emit a positron upon decay. For example, a radioactive isotope of fluorine (18F) emits a positron that annihilates through interaction with an electron to produce a pair of annihilation photons (511 keV each), which are emitted at approximately 180 degrees to each other. Figure 14–3C illustrates the coincident detection of the event in detectors distributed on multiple rings around the patient. Large numbers of these coincident events are then used to generate (or reconstruct) an image of the spatial distribution of the annihilation events, which represents the distribution of the 18F-labelled agent. The most widely used PET agent is a radiolabeled sugar that becomes trapped within cells that have active glucose metabolism, as is the case for malignant tumors (see Chap. 12, Sec. 12.3.1). 18F-Fluorodeoxyglucose (FDG) is injected intravenously into the body and allowed to circulate and metabolize for approximately 45 minutes. The patient is then positioned in the PET scanner and images are collected to image the whole body for regions of elevated uptake.
There are advantages and disadvantages to the SPECT and PET approaches. The ability to integrate radioisotopes directly into a molecule of interest minimizes impact on the pharmacokinetics of the agent itself. Moreover agents can be designed to target many aspects of tumor cell metabolism and the tumor microenvironment. However, the half-life of the probe needs to be selected for the specific objective: the radioactive half-life needs to be longer than the half-life of the physical process that one is interested in characterizing, but it shouldn’t be much longer, or the radiation dose delivered would be excessive. Some positron-emitting radioisotopes (15O, 11C) can be readily integrated into various molecules but have very short half-lives and require production in a cyclotron that is adjacent to the radiochemistry laboratory and the imaging suite. 18F, the most commonly used positron-emitting radioisotope, has a half-life of 110 minutes and therefore can be shipped from remote sources within a few hours with sufficient activity for imaging purposes. 99mTc is the most commonly used SPECT isotope and is a daughter product of a molybdenum generator that can be located within the local SPECT laboratory.
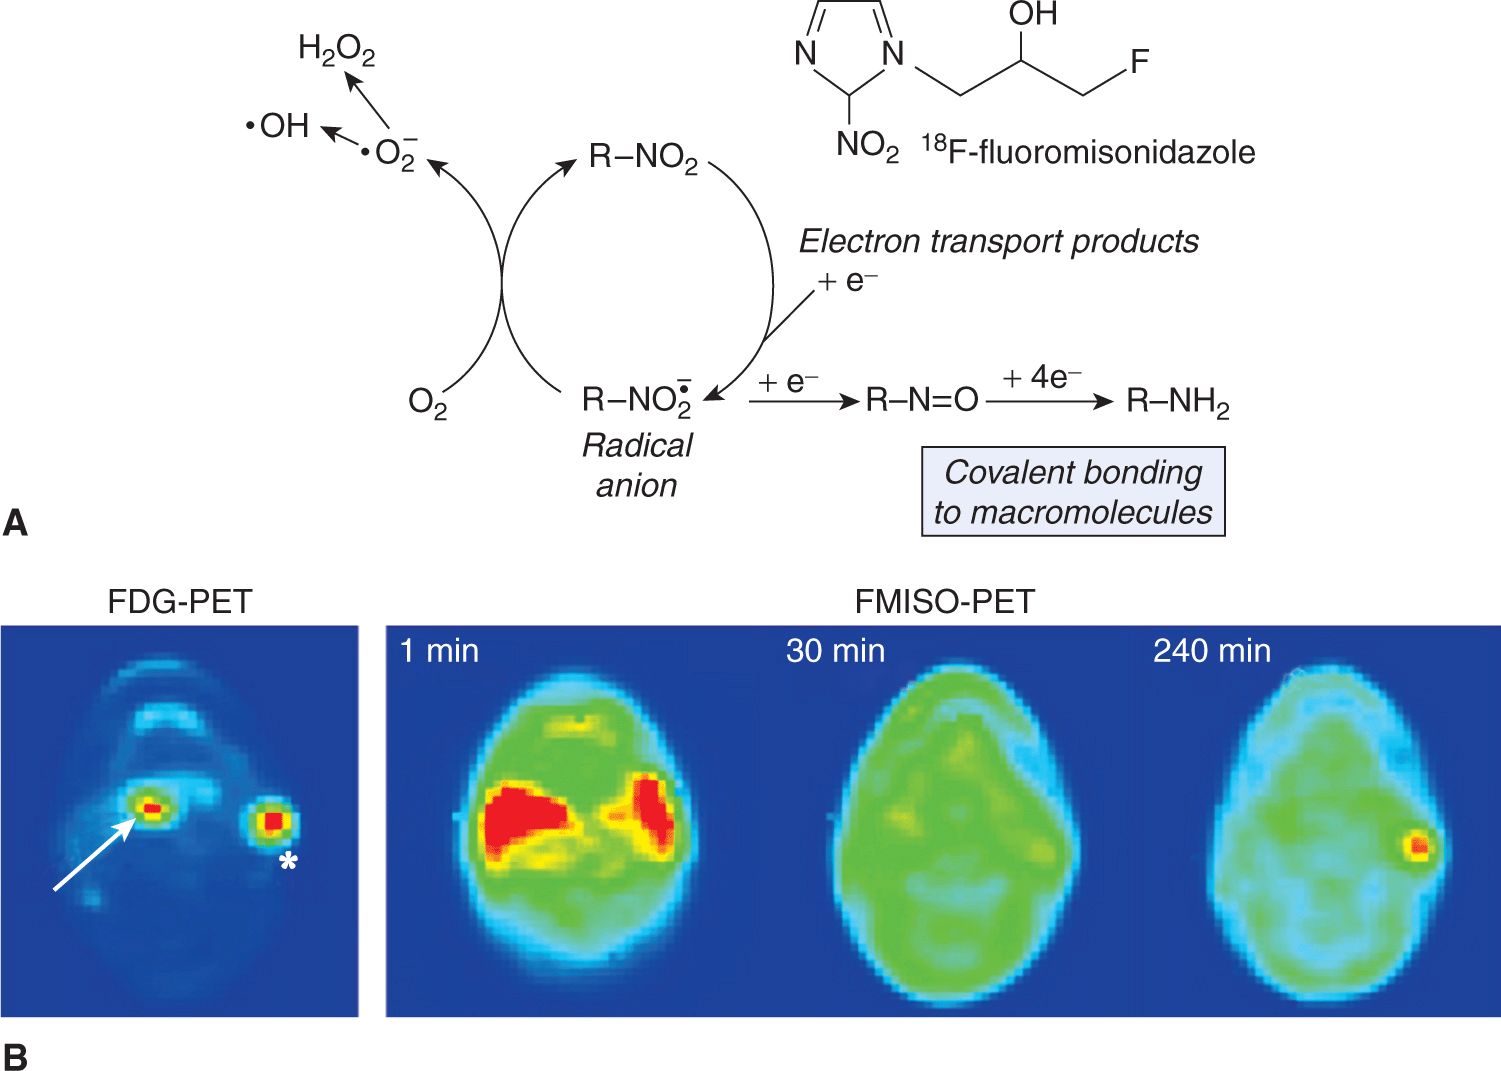
The development of combined PET-CT and SPECT-CT systems was motivated by the advantages of using CT to correct for attenuation by the patient’s anatomy in reconstruction of the image (Townsend et al, 2003), but it is now recognized that the additional imaging information provided from the CT is also beneficial. FDG-PET is employed in detecting regional disease and metastatic lesions in people with cancer; it increases the accuracy of staging and thereby promises to lead to better outcomes (Al-Ibraheem et al, 2009). The role of FDG-PET images for target delineation in radiotherapy is a topic of intense research with its value varying with disease site (Gregoire et al, 2007). In addition to imaging metabolism, PET has been employed to characterize the degree of hypoxia in solid cancers (see Chap. 12, Sec. 12.2.1 and Chap. 16, Sec. 16.4). F-misonidazole (FMISO)-PET and 18F-fluoroazomycin arabinoside (FAZA)-PET are hypoxia localizing agents that become trapped in cells as a result of reduction in the absence of oxygen, so that accumulation occurs only in cells that have low oxygen concentration (Padhani et al, 2007; Krohn et al, 2008). Figure 14–6A illustrates the process of trapping of FMISO in the cell under conditions of hypoxia. The dynamics of agent delivery can also be used to examine perfusion of the tissues (Fig. 14–6B; Thorwarth et al, 2005). Numerous cancer-related PET agents are in development, but FDG remains the only one in routine use: Challenges to bringing additional agents to the clinical domain include cost, the requirement for validation studies, regulatory constraints, and difficulty integrating the new image-based information into clinical use.
FIGURE 14–6 A) Hypoxia results in the accumulation of FMISO in the cell through a process that is dependent on reduction of the nitro (NO2) group by 1 e– nitroreductases. If O2 is not present, the tracer is sequentially further reduced to an alkylating agent and is bound in the cell. In the presence of oxygen, the initial reduction step is back-oxidized to recreate the original molecule, which can diffuse out of the cell again (Mason et al, 2010). B) This illustrative figure adapted from Padhani et al (2007), with permission, shows an FDG-PET image (bottom left) with increased uptake in both the oropharyngeal tumor (arrow) and in the left neck nodal metastasis (asterisk). The FMISO-PET images (bottom right series) were selected from the dynamic acquisition after 1 minute, 30 minutes, and 240 minutes. The early distribution (1 minute) shows hyperperfusion in the region of the primary tumor and metastasis. However, only the left neck nodal metastasis is shown to retain FMISO (and hence is suspected of containing hypoxic cells) after 240 minutes.
14.3.4 Ultrasound Imaging
Ultrasound imaging utilizes the variations in acoustic impedance in the different tissues of the body to generate anatomic images. Figure 14–3D illustrates a modern ultrasound probe configuration for transrectal ultrasound of the prostate. Piezoelectric crystals are capable of generating very high-frequency acoustic waves (ultrasonic) in the range of 1 to 20 MHz and correspond to short wavelengths given the speed of sound in tissue (~1500 m/s). The ultrasound image is formed through careful manipulation of the acoustic source and detection of the reflected acoustic pressure wave. Although ultrasound is limited in its depth of penetration (1 to 15 cm), it has many useful advantages including low cost, adaptability to small probes for directing minimally invasive biopsy procedures (eg, endobronchial ultrasound, prostate biopsy) and use in tissues that are relatively homogenous (eg, liver imaging). In addition to structural information, ultrasound also offers accurate assessment of flow rates in large vessels using the Doppler phenomenon, in which, the relative motion of the blood induces frequency shifts in the reflected sound waves. Ultrasound can also be applied with contrast agents, such as, microbubbles (Wilson and Burns, 2001) that reflect the sound waves producing very-high-contrast signals. This technique has been used to study tissue perfusion in organs and neoplastic lesions (Delorme et al, 2006). Researchers are also applying molecular imaging approaches to specifically target the bubbles to endothelial cell surface receptors to allowing imaging of the density of such receptors in normal tissue or tumor blood vessels (Caskey et al, 2011).
In the clinic, ultrasound is used widely in the detection, diagnosis, clinical staging, and treatment of cancer. Ultrasound has proven useful in the characterization of lesions in the breast, liver, and kidney, and recent use of ultrasonic contrast agents such as bubbles has improved this performance substantially (Quaia et al, 2006). In addition to diagnosis, ultrasound is used for directing biopsies, providing information in the surgical management of prostate or pancreatic lesions, and is also employed for localizing structures during radiation therapy. For example, transabdominal ultrasound imaging is used in daily radiation treatments to localize the prostate and adjust the patient position just prior to treatment. In the context of brachytherapy of prostate cancer using permanent radioactive seed implants, transrectal ultrasound is used to localize both the gland and the seeds as they are placed in the gland by the oncologist.
14.3.5 Optical Imaging
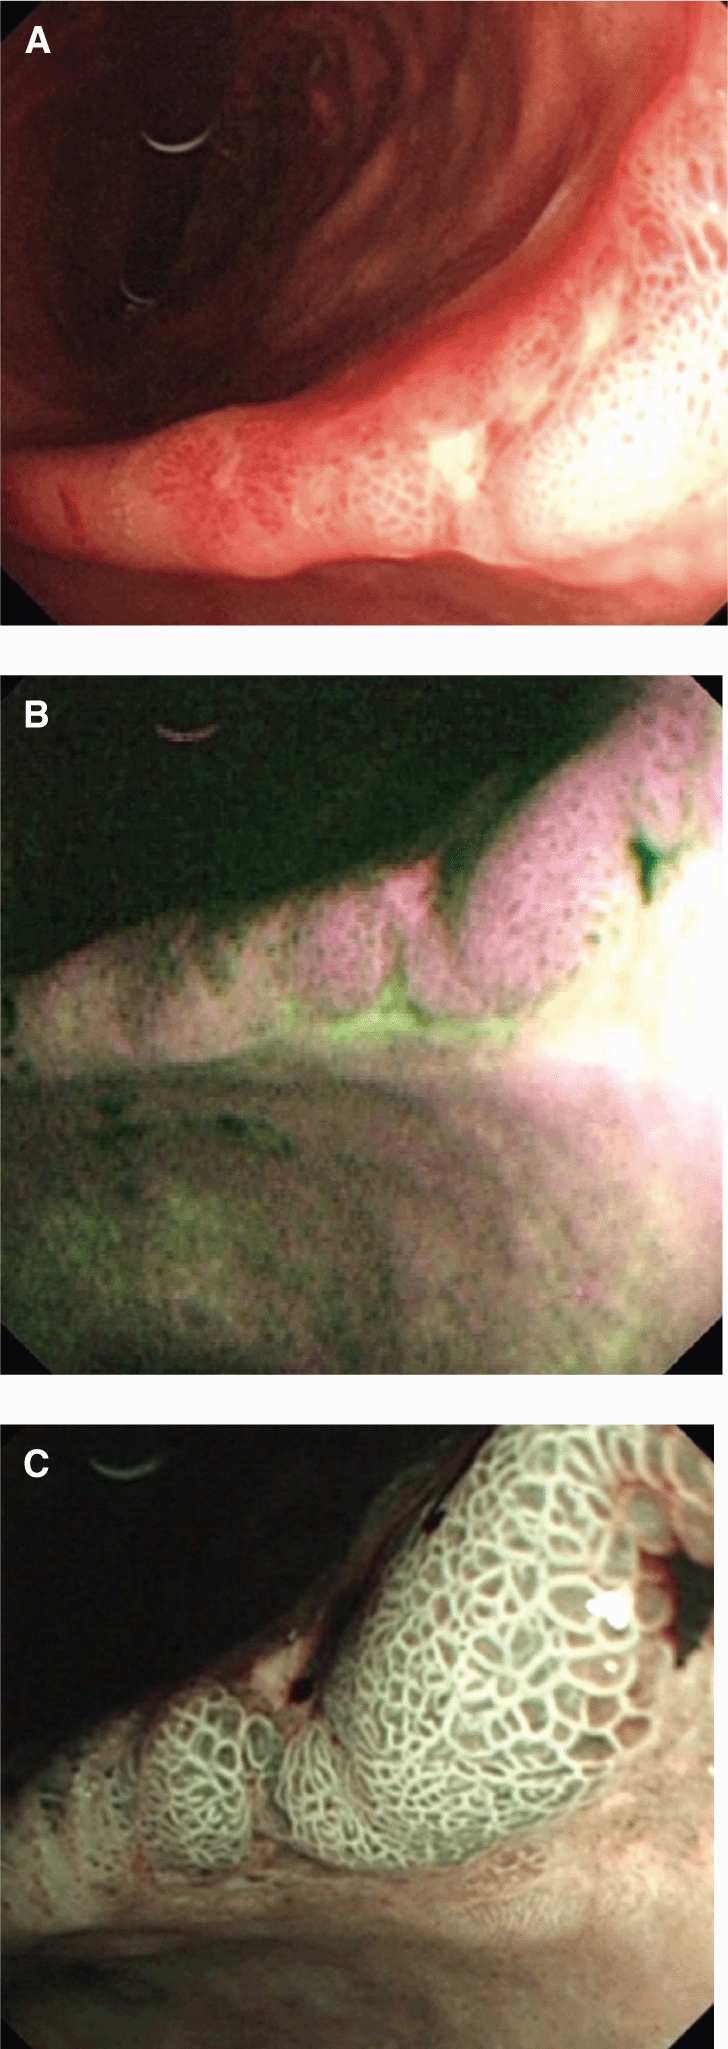
Optical imaging continues to play an expanding role in characterization and management of cancer. The development of endoscopic systems has been accelerated by advances in fiberoptic and camera technologies that permit high-quality optical imaging to be applied within the body’s orifices and luminal structures (eg, colonoscopy, bronchoscopy, and cystoscopy). High-definition video capture, integration of channels for biopsy/resection, and the development of navigation technologies is increasing the application of these systems. These systems can collect light over a wide spectrum from near infrared to blue or operate on a narrow band. In addition, they can be used with different light sources ranging from white light to higher-frequency stimulating sources to generate fluorescence. The endogenous absorption of light in tissue provides significant signal for the detection and characterization of disease by these methods. Although optical imaging suffers from scattering and absorption within the body, it has several advantages, including the high detection efficiency of optical detectors, the abundance of light photons that can be generated and interact without harm to tissue, and the potential to support molecular imaging. The potential for optical imaging to increase the sensitivity of detecting lesions on luminal structures (eg, colon, glottis, esophagus) has resulted in substantial research in this area. The detection of autofluorescence demonstrating increased sensitivity to cancer lesions in the oral cavity is a very promising example (Poh et al, 2006). This is illustrated in Figure 14–7 where (a) white light, (b) autofluorescence, and (c) narrowband imaging each provide increasing detail in the characterization of a gastric adenocarcinoma.
FIGURE 14–7 Endoscopic techniques continue to evolve as demonstrated in this series of images from Filip et al (2011). Endoscopy of an early gastric adenocarcinoma at the level of the gastric angle reveals (A) an irregular ulcer visualized in white-light endoscopy and (B) autofluorescence images showing in magenta the neoplastic margins and a larger lesion extension, as compared with white-light endoscopy. Further advances in resolution and selection of a narrow wavelength band (C) shows a modified pit pattern, with irregular and distorted vascular pattern in the center suggesting high-grade dysplasia/early cancer.
Endoscopic imaging is a heavily used imaging modality in cancer detection and in the context of colon cancer, colonos-copy is now a recommended procedure for patients over the age of 50 years as part of a broader screening program. The same tools are used to direct the biopsy and remove suspicious lesions. Challenges persist in the characterization of flat lesions and the introduction of optical imaging techniques beyond that of white light is a current area of research. Endoscopy is also a routine part of cancer management of many other sites including cancer of the head and neck, lung, and esophagus. The low cost and adaptability of endoscopes has resulted in other uses, including the design of radiation therapy treatments (Weersink et al, 2011) and the assessment of the response of tissue to cancer therapeutics. Georg et al (2009) have correlated rectal endoscopy scores with the volume of rectal tissue receiving elevated doses during radiation therapy of the cervix. The continued advances in endoscope technology and advances in optical imaging probes make this a particularly promising area of development for cancer imaging.
14.4 IMAGING OF ANIMAL MODELS IN ONCOLOGY
With the growing use of small animal models of disease in cancer research, there has been a corresponding growth in the use of small animal imaging systems to characterize the disease with the aim of understanding cancer in these animal models and its response to novel therapies. Imaging is forming an effective bridge between the clinical and preclinical domains as investigators relate image-based observations from the clinic to the biological basis of the disease in pertinent genetically engineered animals or human tumor xenografts (see Chap. 2, Sec. 2.4.5). Preclinical models of cancer typically include human tumor xenografts (primary or serially transplanted) and genetically engineered murine or rat models. The use of imaging technologies (micro-MRI, -PET, -CT, -SPECT, and optical imaging) can interrogate local tumor growth, meta-static progression, tumor metabolism, and treatment response to allow for the design and testing of novel clinical regimens (Weissleder et al, 2008). The use of multiple preclinical, noninvasive imaging techniques also allows the choice of the best way to address a particular oncology question, something that cannot be easily done in the clinic because of cost and patient inconvenience.
The scaling of CT systems from man to mouse was made possible by the creation of high-resolution digital detectors (~0.1 mm resolution) for radiography and fluoroscopy, as conventional CT detectors (~1 mm resolution) would be of limited use in a mouse model. In addition to the challenges of achieving higher resolution, there is concern associated with the radiation dose necessary to maintain a good signal to noise ratio (SNR) at the required resolution. In CT, the SNR in a cubic voxel depends on the square of the voxel dimension. Thus, achieving 50-μm images with a SNR comparable to that found in human CT imaging (500-μm images) would require the imaging dose to be increased 100-fold. Although this has been a concern, this technology has been applied with a compromise between noise and acceptable imaging doses (~5 to 30 cGy), and preclinical CT systems with spatial resolution as low as 18 μm are available (Marxen et al, 2004). These preclinical CT systems have been applied for purposes similar to those used for human imaging—measuring tumor growth, assessing bone injury in metastatic models of disease, and even mimicking the DCE-CT techniques used in clinical oncology. For example, rat brain CT perfusion studies with a resolution of approximately 150 μm have been achieved with these systems (Greschus et al, 2005). As with clinical CT, the excellent geometric integrity can be used to guide microenvironmental probes to specific locations within the imaged subject, and to direct biopsies (Waspe et al, 2010). Robotic systems directed under preclinical CT can achieve targeted biopsies with mean errors of less than 100 μm. Similarly, cone-beam CT systems have been integrated with irradiation systems to direct small radiation beams (<2 mm in diameter) to treat xenograft tumor models in mice (Clarke et al, 2009).
The powerful soft-tissue imaging capabilities of MR has driven the development of high-field MR scanners to enable high-resolution, low-noise imaging of small animals. For example, DCE-MR methods have been adapted to these platforms for quantitative, multiparametric evaluation of treatment response. This has been of particular interest to those examining the optimization of treatment protocols that employ antivascular agents. The creation of a “preclinical mimic” of clinical imaging techniques is an attractive development to allow preclinical evaluation of therapies that would benefit from an image-based biomarker of response.
The ability to monitor noninvasively chemical interactions within the body would reveal a great deal about cancer biology. Concentrations of highly polarized 13C nuclei (105 times higher signal than water-based MR) produce sufficient signal to map molecular distributions of injected 13C within organs for several seconds after injection (Golman, Olsson et al, 2003). Through frequency selection and careful design of pulse sequences, different metabolic species (eg, 13C pyruvate) can be monitored as the 13C is transported through metabolic processes. Figure 14–8 demonstrates the capabilities of MRI techniques when combined with high-contrast metabolically active agents (Kurhanewicz et al, 2008). These techniques bring a powerful new perspective for understanding cancer metabolism and are being advanced into the clinical setting.
FIGURE 14–8 The development of 3D MRSI with hyperpolarized 13C is an exciting development for oncology imaging. Postinjection rapid MR spectroscopy (14 seconds/spectrum over a 0.135 cm3 region within the tumor) can be used to monitor the signal from injected 13C-pyruvate and its metabolic derivatives, including lactate and alanine. In this transgenic model of prostate cancer (TRAMP), Kurhanewicz et al (2008) demonstrate high levels of lactate were produced from hyperpolarized 13C-pyruvate and that lactate production (relative to the pyruvate signal) in the tumor increased as the tumor progressed from the 24th to the 27th and 28th week postimplantation.
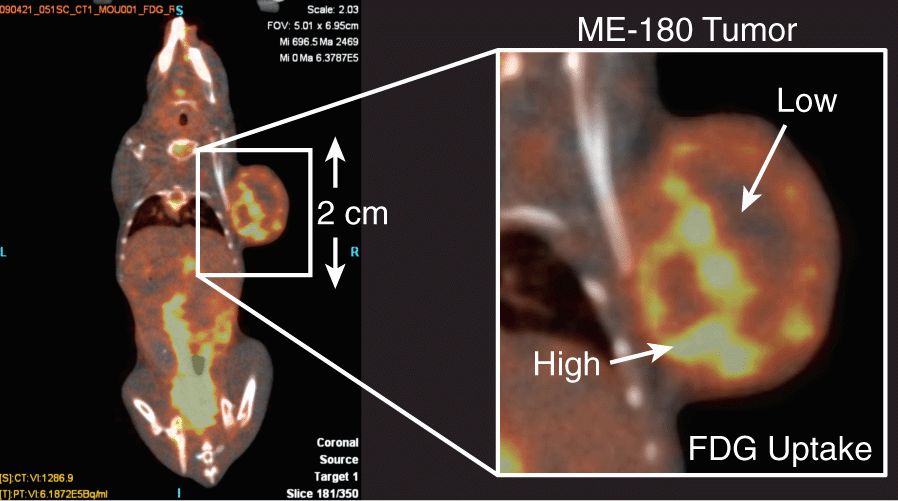
Preclinical SPECT and PET imaging systems are routinely employed in preclinical oncological research. Figure 14–9 illustrates the result of an FDG-PET imaging study in a mouse tumor model. The close proximity of the detectors to the animal permits higher resolution imaging than achieved in clinical systems and illustrates heterogeneity in FDG uptake across the tumor. The preclinical systems are used to evaluate novel PET probes, such as hypoxia agents, which need to be cross-calibrated against other measures of the partial pressure of oxygen (pO2) (Busk, Horsman, Jakobsen et al, 2008). PET and SPECT systems are also very useful in evaluating the performance of novel targeted therapies by tracking accumulation of radiolabeled therapeutics (Pinchuk et al, 2006), probing molecular markers of cancer during therapy (McLarty et al, 2009), and for assessment of drug or vehicle delivery (Harrington et al, 2001).
FIGURE 14–9 PET imaging can also be applied in the preclinical setting to increase our understanding of the underlying biology, as well as inform the design of clinical imaging studies. In this example, an FDG-PET image is acquired of a subcutaneous tumor (ME-180, cancer cervix model). The accumulation of FDG is seen to be quite heterogeneous within the mass. The generation of such a high-resolution image would be challenging on a clinical PET scanner because of the detector geometry. The use of a preclinical system helps to inform our understanding of a clinical FDG image and how it relates to the very-high-resolution microscopy demonstrated in Figure 14–1A. (Image courtesy of STTARR Facility, Toronto, Canada.)
Ultrasound systems have also been adapted to support very-high-frequency probes for preclinical studies and ultrasound microscopy (Foster et al, 2009; Knspik et al, 2000). Ultrasound is being employed to characterize growth delay in tumor models following therapy, assess the impact of antivascular therapies (Cheung et al, 2007), and measure cellular responses to treatment, such as apoptosis (Czarnota et al, 2002). Preclinical ultrasound is used to evaluate the development of novel ultrasound contrast agents that are actively targeted or can be used in synergy with other therapeutic agents.
Development of optical imaging technologies in the preclinical domain include flat-field bioluminescent and fluorescent imaging systems, as well as the development of 3D systems to allow more quantitative measures (Graves et al, 2004). These systems rely on high-performance cameras that incorporate charge-coupled devices and multichannel plate technology to achieve low-noise images of the emitted optical signal. The development of bioluminescent technologies, such as transfection of fluorescent proteins or luciferase into cells, has enhanced the usefulness of these devices. Endoscopic confocal microscopes with resolutions of approximately 5 μm now allow visualization of biological processes in real-time (Lin et al, 2008). The creation of these preclinical tools has spurred the initiation of research in optical tracers and probes that is likely to have a profound impact on the role of optical imaging in the clinic.
14.5 NEW DIRECTIONS IN ONCOLOGY IMAGING
14.5.1 Quantitative Methods and Quality Assurance
The promise of using imaging for noninvasive characterization of disease requires that the measurement systems are accurate and provide fidelity of the spatial distribution. For example, it is well-known that the resolution of the FDG-PET imaging system can reduce the accuracy of the specific uptake value (SUV) estimation (Erdi et al, 1997), but this knowledge is not routinely applied in assessing clinical response. Similar issues are found in MRI, wherein, changes to an imaging sequence or modification of the MR scanner can introduce spurious results into longitudinal imaging studies designed to monitor response. The National Institutes of Health in the United States has embarked on an effort to increase the quantitative performance of clinical imaging (Clarke et al, 2009). The Quantitative Imaging Network (QIN) aims to “promote research and development of quantitative imaging methods for the measurement of tumor response to therapies in clinical trial settings, with the overall goal of facilitating clinical decision making” (NCI/NIH, 2009). This program for coordinated imaging in clinical trials is also establishing a qualification program that includes standardized operating procedures for quality assurance, patient preparation, imaging, and image analysis. In conjunction with these efforts, there has been an increased use of test phantoms for evaluating both static and dynamic imaging sequences, as well as evaluating the dose delivered during CT imaging studies. These efforts will help transform clinical CT, MR, and PET scanners from simply being “imaging systems” to become quantitative measurement tools that can be used to make certified measurements to direct cancer care.
14.5.2 Automated Analysis Methods: Improving on RECIST Criteria
Although the generation of the image is often the focus of imaging research, the extraction of relevant information for use in directing therapy or correlative studies is of equivalent importance. For example, the Response Evaluation Criteria in Solid Tumors (RECIST) was published in 2000 as a consensus among European, American, and Canadian cancer research groups (Therasse et al, 2000). The fundamental measure in RECIST is the longest diameter of the target lesion(s) and its change during therapy (ie, 30% decrease for response, 20% increase for progressive disease). Given the wealth of information collected by imaging methods described in this chapter, the RECIST measure is a remarkable reduction of information. RECIST criteria are heavily used in current clinical trials despite their known weaknesses (Therasse et al, 2006). The development of quantitative imaging metrics beyond tumor size should allow more advanced analysis of tumor response to treatment. The introduction of functional measures such as FDG-PET, the use of contrast agents, and the broader use of MRI in assessment of response (eg, DCE-MR) is raising concerns about the relevance of the RECIST criteria (Tuma, 2006). While it is recognized that RECIST needs to evolve, it should be done with appropriate levels of standardization and validation, and there has been substantial effort put toward automated segmentation algorithms with the objective of developing efficient 3D measurements (Marten et al, 2007; Farmaki et al, 2010) and voxel-based measures of response using MR (Moffat et al, 2005). The continued growth of uniand multimodal image sets will require automated algorithms to assist in observer-independent interpretation and efficient reporting if the impact of imaging on cancer is going to reach its full potential.
14.5.3 Images and Biological Information Combined for Discovery
There has been a substantial shift in the past decade toward using multiple modalities for the characterization of cancer. The combination of molecular and anatomical imaging, such as PET and CT, allows 3D quantitative analysis of a molecular imaging signal. While PET-CT was motivated by the advantages of using CT for correction of attenuation, it has proven to be even more valuable as a result of improvements in specificity achieved when both images, perfectly registered, are presented to the nuclear medicine physician. Research groups are developing combined MR-PET imaging systems with the expectation of further gains, but these remain to be proven (Schlemmer et al, 2009). There are ongoing efforts to integrate optical and CT systems in the preclinical domain to allow optical systems to be more quantitative (da Silva et al, 2007). Challenges for multimodal imaging in the clinical domain have stimulated development of software to allow images collected at various time points and by various modalities to be integrated, and corrected for variations in anatomical position (Brock, 2007). This remains an area of significant research and development.
There is an ongoing challenge of quantifying and relating image signals to the underlying cellular and biological properties of tissue, as traditionally characterized by morphological or molecular pathology (Busk, Horsman, Overgaard et al, 2008). There has been an increased focus on histopathological validation of image signals; for example, Daisne et al (2004) studied the extent of disease in head and neck patients by examining clinical images and pathology sections. They were able to compare the relative performance of CT, MR, and FDG-PET in delineating tumor extent. The development of large field-of-view microscopes, registration/deformation software algorithms, and standardized tissue-handling protocols for these activities are slowly advancing the field. In addition to comparison with resected whole-mount specimens, targeted biopsy of tissue within MR and ultrasound images has been undertaken as a means of generating histopathological validation of the complexity of information achieved with multimodality imaging (Bax et al, 2008; Susil et al, 2006).
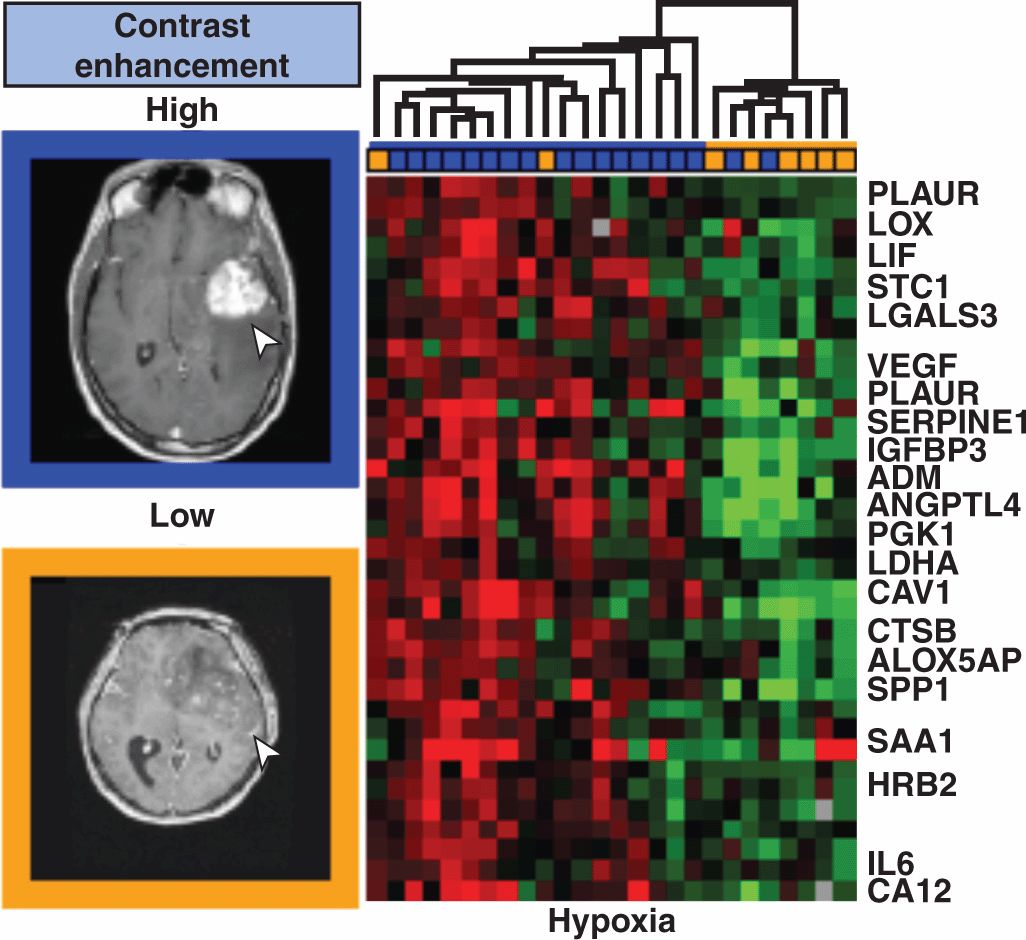
Most recently, the fusion of imaging information with genomic information has developed as an area of cancer research. In these studies, the image signals are employed in the bioinformatics framework to identify correlations between specific imaging signals/textures and the gene expression profiles of the associated tissues collected through surgery or biopsy. This is referred to as “radiogenomics” or “radiomics” (Lambin et al, 2012). Figure 14–10 demonstrates such an analysis linking radiologist classification of MR images of brain tumors with various tissue-derived microarray signatures. More recently, morphologically relevant MRI signatures have been correlated with specific genes and microRNAs that are associated with mesenchymal transformation and invasion (Zinn et al, 2011). This type of research will help bridge the molecular–clinical gap of translational cancer medicine, with imaging being a powerful research tool with a subsequent role in clinical applications of image-based personalized cancer medicine.
FIGURE 14–10 Radiomics or radiogenomics involves the integration of imaging signals or “image-based biomarkers” into the bioinformatics framework being developed for genetic profiling and correlations with outcome. Imaging also brings distinct spatial information, such as size and invasiveness, and can be remeasured during the course of therapy. Diehn et al (2008) examined the gene-expression surrogates for traits in MR images as shown. MR image signal phenotypes (10 types defined by expert radiologists) were defined and hierarchical clustering of the gene expression profiles of 32 samples, including glioblastoma multiforme and norma l brain specimens, was performed and tested for statistical significance. The results specific to contrast accumulation in the brain and hypoxia have been selected for presentation shown here.
Stay updated, free articles. Join our Telegram channel

Full access? Get Clinical Tree


