Imaging Analysis: Mammography
Mark A. Helvie
Stephanie K. Patterson
Mammography is widely practiced in the United States and internationally for screening and diagnostic indications. High-quality examinations and interpretations are necessary for successful practice. Mammography refers to the process of obtaining images of the breast utilizing low energy x-rays. Breast imaging is a more general term that encompasses mammography, breast sonography, breast MRI, breast PET scanning, and other emerging technologies. Although it is convenient to discuss mammography independent of other breast imaging modalities, modern practice stresses an integrated approach of various imaging modalities, in particular, mammography, sonography, and more recently MRI.
This chapter will describe the basics of mammographic interpretation and usage in screening and common diagnostic situations. Efficacy of screening mammography, breast sonography, and MRI are covered in Chapters 11, 13, and 14.
Radiography of the breast has been performed for over 95 years. Although palpable breast cancer was often found to have characteristic mammographic findings, the application of mammography into practice was slow. The potential of mammography to detect clinically occult cancer led to international efforts to refine mammographic technique and eventually led to screening trials, primarily in northern European countries and North America. These showed mortality reduction in screened women which formed the basis for the current recommendation for mammographic screening (1). While some controversy exists regarding frequency and age to begin screening, most organizations recommend regular screening mammography. The explosive increase in mammographic screening in the United States in the 1980s and 1990s was associated with extensive public scrutiny and regulation. Breast imaging was first among imaging specialties to develop a standard lexicon and assessment categories to improve quality and communication between radiologist, referring physicians, and patients. Federal law (the Mammography Quality Standards Act [MQSA]) regulates mammographic equipment, quality operations, technologists, and interpreting physicians (2). Direct communication of mammographic results via written reports to patients is required. The Food and Drug Administration (FDA) performs annual on-site regulatory inspections. All sites, equipment, technologists, and reading physicians in the United States require FDA approval to perform and interpret mammograms. Individual states may have additional regulations.
TECHNIQUE
Basic understanding of radiologic physics is necessary for mammographic interpretation. A typical mammographic machine generates low energy (25-32 kVp) x-rays utilizing a small (0.3-mm) focal spot source, such as molybdenum, rhodium, or tungsten. The breast is compressed between an image receptor (film or digital detector) and a transparent plastic compression plate. Compression is used to minimize thickness and motion and is necessary to limit the radiation dose and improve image quality. X-rays are differentially absorbed by different types breast tissue. X-rays that are not absorbed pass through the breast and are detected by an image receptor. There are now two types of FDA approved receptors, film/screen and digital. In film/screen systems, the energy is eventually received by film, which is developed to produce a mammographic image similar to a photographic negative. In contrast, a digital detector receives the x-rays and electronically converts the energy into an electronic data set, which can be projected on a video monitor or printed as a film or stored and manipulated electronically similar to digital photography. Since 2005, there has been a marked trend toward digital mammography. Currently, over 85% of mammography units in the United States are digital. The mammographic appearance of cancer such as calcifications or masses is not different, although each system may offer some theoretical advantages at displaying these findings (3). Dark areas on a mammogram represent areas with minimal absorption (fat) while white areas represent moderate absorption by fibroglandular tissue or extensive absorption by calcium.
Image quality is affected by a host of factors including breast tissue “density,” compressed thickness, positioning, motion, focal spot size, detector performance, and radiation dose. Manufacturers attempt to maximize multiple factors to achieve optimum image quality at the lowest possible radiation dose. The FDA limits dose to 3 mGy (300 mrad) for an average thickness breast per exposure. Mammographic technical requirements are mandated by the MQSA. Passing a yearly facility on site inspection by an FDA-approved agent is necessary to maintain operational accreditation. The mammographic technologists play a critical role in insuring quality screening program by optimizing mammographic positioning. The radiologist can interpret only the parts of the breast that have been included in the imaged field, so the skill of the technologist in maximizing positioning is essential for a quality mammogram. The American College of Radiology (ACR) reviews facility mammograms to assess positioning and technique prior to required certification.
SCREENING VERSUS DIAGNOSTIC MAMMOGRAPHY
Screening mammography refers to obtaining routine mammographic images of asymptomatic women in order to detect cancer at a preclinical stage. This is the primary role of mammography. The goal of screening is high sensitivity for early cancer detection. Diagnostic mammography refers to mammography used to evaluate abnormal clinical findings such as a breast mass, thickening, or nipple discharge. Diagnostic mammography also refers to obtaining incremental mammographic images (such as magnification views or spot views) for characterization of possible abnormalities detected by screening mammography at time of recall or call back. “Magnification” views employ smaller focal spots (0.1 mm) and larger subject to receptor distances and produce a 2× magnified image. “Spot” compression utilizes smaller compression paddles that focally decrease breast thickness in an area of concern. Unfortunately, the distinctions between screening and diagnostic mammography have been confused by definitions utilized for insurance billing purposes. An insurer may consider a woman with a prior biopsy of “fibrocystic disease” as “diagnostic” mammography for billing even though that individual may have no current abnormal palpable findings. For our purposes, screening mammography refers to the mammographic evaluation of an asymptomatic individual. In the United States, a screening study consists of two views of each breast, craniocaudal (CC) and mediolateral oblique (MLO). Usually screening mammography is performed without the presence of the physician with mammographic interpretation occurring later in a batch reading situation, which improves efficiency and allows for low-cost screening.
Not infrequently, findings noted on screening mammography require additional diagnostic imaging to resolve. Only a small portion of women recalled for diagnostic imaging will have cancer. A simplified U.S. screening pyramid (Fig. 11-1) provides an overview of the screening process. Assuming a cancer incidence of 3 per 1,000 of annually screened women and a recall rate of 8%, the following outcome is expected for 1,000 normal risk women undergoing annual screening mammography: 920 per 1,000 (92%) will be normal and 80 per 1,000 (8%) will be recalled for diagnostic mammography or ultrasound. Of the 80 women who are recalled, 70 per 1,000 (7%) will be normal or probably benign at diagnostic imaging and returned to mammographic screening and 10 per 1,000 (1%) will require tissue diagnosis for a mammographic abnormality. Of the 10 undergoing biopsy, 3 per 1,000 (0.3%) will be found to have cancer (4). These numbers are illustrative but will vary with incidence, screening frequency, recall rate, and biopsy rate.
Digital Breast Tomosynthesis
The major weakness of mammography is the detection of cancer in women with radiographic dense breasts. While nearly all cancers will be apparent in fatty breasts, many fewer will be visible in extremely dense breast. This is due to masking of noncalcified cancers by surrounding dense tissue. Digital breast tomosynthesis (DBT) mammography is a new technology derived from digital mammography that was approved by the FDA in 2011 to improve detection and
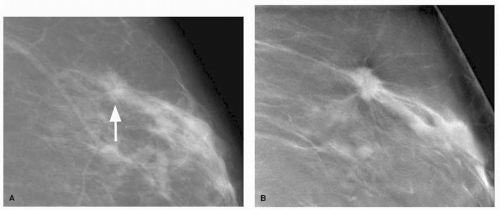
characterization of breast lesions especially in women with nonfatty breasts (5). In DBT, the source x-ray tube is moved through a limited arc angle while the breast is compressed and a series of exposures are obtained (6). To a patient, DBT will be very similar to conventional digital mammography except there will be some movement of the x-ray tube head during exposures. These individual exposures are only a fraction of the total dose used during conventional digital mammography. The image data sets are reconstructed and the clinical reader is presented with a series of images (slices) through the entire breast that are read at a workstation analogous to CT or MRI study. Because each reconstructed slice may be as thin as 0.5 mm, masses and mass margins that may otherwise be superimposed with out-of-plane structures may be more visible in the reconstructed slice (Fig. 11-2). This should allow better visualization and characterization of noncalcified lesions. While the basic image interpretation will be similar to conventional mammography, new recall thresholds and probably benign thresholds will be established for DBT specific findings. In early studies, DBT has shown the ability to increase both sensitivity and specificity and has the potential to dramatically change not only how routine “mammography” is performed but also improve the clinical outcome of mammographic screening (5).
characterization of breast lesions especially in women with nonfatty breasts (5). In DBT, the source x-ray tube is moved through a limited arc angle while the breast is compressed and a series of exposures are obtained (6). To a patient, DBT will be very similar to conventional digital mammography except there will be some movement of the x-ray tube head during exposures. These individual exposures are only a fraction of the total dose used during conventional digital mammography. The image data sets are reconstructed and the clinical reader is presented with a series of images (slices) through the entire breast that are read at a workstation analogous to CT or MRI study. Because each reconstructed slice may be as thin as 0.5 mm, masses and mass margins that may otherwise be superimposed with out-of-plane structures may be more visible in the reconstructed slice (Fig. 11-2). This should allow better visualization and characterization of noncalcified lesions. While the basic image interpretation will be similar to conventional mammography, new recall thresholds and probably benign thresholds will be established for DBT specific findings. In early studies, DBT has shown the ability to increase both sensitivity and specificity and has the potential to dramatically change not only how routine “mammography” is performed but also improve the clinical outcome of mammographic screening (5).
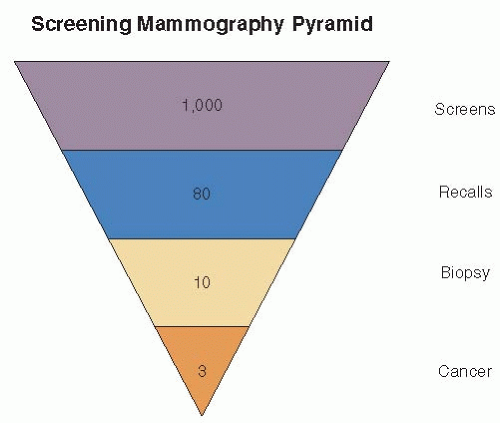 FIGURE 11-1 Simplified screening pyramid showing typical outcomes of 1,000 annually screened women of normal risk. |
MAMMOGRAPHIC INTERPRETATION
Mammographic interpretation is a difficult task that can be dichotomized into two basic processes: detection (perception, visualization) of a possible abnormality and characterization (classification, analysis) of a potential abnormality. The goal of image interpretation by screening is high-detection sensitivity which requires the generation of false positives due to the nonspecific appearance of most small cancers. High sensitivity involves the ability to perceive potential abnormalities, only a fraction of which will prove to be cancer. Careful analysis of recalled patients by additional diagnostic imaging is necessary to evaluate a suspected lesion. With additional diagnostic mammography and ultrasound, a group of abnormalities of sufficient probability for malignancy will be recommended for biopsy. The commonly used U.S. threshold for biopsy is a probability of malignancy greater than or equal to 2% which corresponds to a BI-RADS classification of “suspicious finding” or BI-RADS 4 (7). Experienced readers can assign a reasonable probability of malignancy to a finding recommended for biopsy, but tissue diagnosis is necessary to confirm diagnosis even for lesions of very high probability. Mammographic appearances are seldom tissue specific.
Radiologists’ Performance
Interpretation of mammographic images involves the art and science of medicine. While the recognition and characterization of classic large tumors is often straightforward, the detection of the small, subtle lesions can challenge the most expert reader. Interpretive variability exists for screening and diagnostic mammography. Key factors that influence overall performance include physician expertise, recall rates, observation time, biopsy rates, double reading, and CAD. The relationships among these parameters are complex.
Similar to other areas of human endeavor and medicine, differences have been found among radiologists interpreting mammograms (8, 9, 10, 11, 12, 13 and 14). Beam et al., using an experimental model, found variation among practicing American radiologists with overall sensitivity ranging from 59% to 100% and specificity 35% to 98% (11). Sickles and colleagues reported higher cancer detection rates for specialists than generalists (6.0 per 1,000 vs. 3.4 per 1,000) within a single academic center in a retrospective clinical study (10). Specialists had higher volumes, more frequently participated in CME programs and fellowship training, and more often participated in radiologic-pathologic correlation conferences than generalists. The influence of reading volume on performance has not been consistent. Beam et al. tested 100 radiologists with an enriched study set of 148 mammograms with a 43% cancer incidence (11). They found reading volume not to be tightly associated with improved sensitivity. Rather complex multifactorial processes were found to be associated with expertise. Miglioretti and colleagues reported better performance for readers of diagnostic mammography at academic centers, those concentrating their time in breast imaging, and those performing breast biopsies (14). Volume was not
associated with performance. To date, no definite set of parameters completely predict reader expertise. Common associations with favorable interpretive skills and expertise include concentration in breast imaging, academic practice, continuing education, association with a multidisciplinary breast center, and practice audits (10, 12, 14). Reading a minimum of 480 mammographic cases per year is required by the FDA to maintain certification.
associated with performance. To date, no definite set of parameters completely predict reader expertise. Common associations with favorable interpretive skills and expertise include concentration in breast imaging, academic practice, continuing education, association with a multidisciplinary breast center, and practice audits (10, 12, 14). Reading a minimum of 480 mammographic cases per year is required by the FDA to maintain certification.
Sensitivity and specificity are inversely related for any particular reader due to nonspecific appearance of early breast cancer. Sensitivity increases with recall rate over a range of recall rates. High sensitivity can be achieved only when a sufficient number of women are recalled from screening for additional diagnostic mammography and ultrasonography (9, 13, 15, 17). The ideal balance between sensitivity and recall rate is controversial and reflects philosophy, cost, cultural issues, and medical-legal issues. Yankaskas and colleagues demonstrated sensitivity increased from 65% at recall rates of 1.9% to 4.4% and to 80% sensitivity at recall rates of 8.9% to 13.4% in a study of practicing North Carolina radiologists (15). Karssemeijer et al., in an enriched study population, found sensitivity for masses improved from approximately 35% at a 3% callback rate to 59% at a 20% callback rate (9). Gur and colleagues noted improvements in sensitivity with increasing recall over a wide range (7.7% to 17.2%, p < .05) at a large clinical practice (17). On average, a 0.22 per 1,000 cancer detection rate improvement occurred for every 1% absolute increase in recall rate. Otten et al., in an experimental situation, found 47% sensitivity improvement when FP rate increased from 1% to 4% (16). In the United States, callback rates of 5% to 15% are common. Rosenberg et al. reported the middle 50% recall rate for practicing U.S. radiologists to be 6.4% to 13.3% (mean 9.8%) for 2.5 million screening studies (13). European callback rates are frequently lower. Dutch breast cancer screening program has reported callback rates as low as 1.1% (9, 16). Emphasis on specificity and low cost will limit recall rate. Emphasis on high sensitivity will increase callback rates.
Mammographic sensitivity increases with reader observation time. Nodine and colleagues noted experienced mammographers made 71% of detections in the first 25 seconds but had continued true positive detections for approximately 80 seconds, albeit at a slower rate (18). Krupinski observed the detection of subtle findings occurred later in observation cycle than obvious masses which required longer visual dwell times (19). The threshold to initiate biopsy will influence cancer detection similar to recall rate thresholds. Higher thresholds for biopsy may be associated with higher false-negative (FN) rates and lower sensitivity (14).
Double Reading
Double reading (DR) has been advocated as a method to detect abnormalities overlooked by a single reader. Most independent DR studies have demonstrated improvement in sensitivity at a cost of lowered specificity. A review of clinical independent DR studies shows detection rate improvements of 4% to 15% (20). However, recall rates (FP) increased by 11% to 45%. These divergent trends for DR between sensitivity and specificity tend to balance accuracy. Taplin et al. showed independent DR improved sensitivity by 8.9% and decreased specificity by 13.6% similar to clinical trials (21). Accuracy, as determined by ROC methods, did not change suggesting that independent DR acted to shift the decision threshold towards sensitivity at the expense of specificity. DR with expert or consensus readers as the second reader appears to retain most improvements in sensitivity without large declines in specificity but this outcome may reflect in part the expertise of the second reader.
Computer-Aided Detection (CAD)
CAD systems, commercially available, use artificial computer intelligence in an attempt to act as a second reader. Like DR, most clinical CAD trials have shown improvement in sensitivity but declines in specificity. A CAD system functions as a second reader by placing “marks” on a mammographic site deemed suspicious. The radiologists then characterize these CAD detections. CAD can correctly identify approximately 60% to 80% of cancers with highest performance for microcalcifications. Unfortunately, CAD systems are very nonspecific with 2 to 4 marks placed per every exam. It has been estimated that only 1 in 5,000 CAD marks will reflect a true-positive finding representing a unique cancer missed by the radiologist (20). The interactions between radiologist and CAD are complex but tend to mirror DR studies. Clinical studies with CAD show sensitivity improvements varying from 1.7% to 19.5%, with declines in specificity as noted by increased recall rate of 0.1% to 26% (20). CAD effect on accuracy has often been incompletely reported so the determination whether CAD is increasing accuracy or shifting the threshold toward sensitivity has been questioned. Fenton et al. showed reader accuracy as measured by ROC methods declined with incremental use of CAD in a retrospective clinical study of 684,956 women (22). They showed a nonsignificant 6% improved sensitivity but a 13% significant loss of specificity. Sensitivity improvement for CAD was for DCIS. The reason for this negative result is uncertain but may result from overrelying on CAD, changing radiologists reading patterns, spending less overall time in observation, and radiologists being overwhelmed with the large number of false-positive CAD marks. While CAD remains controversial, CAD is in its infancy and the future of CAD is robust for detection and characterization tasks as a second reader. More effort will be required to improve the human interaction with CAD to reap the theoretical advantages of CAD. Current CAD systems are best viewed as a second reader with moderate sensitivity and poor specificity. Overreliance on CAD should be avoided and may actually degrade overall reader performance if used incorrectly. CAD should never be used to discount a finding deemed by the radiologist to be suspicious.
CHARACTERIZATION OF MAMMOGRAPHIC FINDINGS
Characterization is the process to determine if a suspected mammographic finding represents normal tissue, a benign finding, or potentially breast cancer. The goal of characterization is to establish a probability of malignancy and threshold the finding to determine if tissue sampling is required. This assessment is based on morphologic appearance of a finding and stability or change over time.
Mammography is not tissue specific. Some very lowprobability-appearing abnormalities will prove to be malignant and conversely, some high-probability findings will be benign. Distinguishing between what lesions require biopsy and which can be followed involves thresholds. Most U.S. radiologists recommend biopsy for probability of cancer greater or equal to 2% (7). Individual radiologists assess their thresholds by auditing their practice by reviewing the frequency of malignancy for lesions recommended for biopsy (positive predictive value), their false-negative rate for lesions recommended for follow-up, tumor size, and stage. The U.S. Department of Health and Human Services has suggested the following as desirable goals for screening mammography which have been attained by highly skilled
experts: Positive predictive value for biopsy 25% to 40%, recall rate 5% to 10%, incident cancer detection 2 to 4 per 1,000, minimal cancer detection >30%, stage 0, 1 >50%, sensitivity >85%, and specificity >90% (4). Different patient populations will significantly impact on the ability of a screening population to attain these goals.
experts: Positive predictive value for biopsy 25% to 40%, recall rate 5% to 10%, incident cancer detection 2 to 4 per 1,000, minimal cancer detection >30%, stage 0, 1 >50%, sensitivity >85%, and specificity >90% (4). Different patient populations will significantly impact on the ability of a screening population to attain these goals.
FDA/BI-RADS FINAL ASSESSMENT CATEGORIES
To provide national uniformity for reporting and assessment of mammographic findings, the American College of Radiology developed a lexicon for final assessment classifications (“BI-RADS”) (7). After analyzing a mammogram, radiologists classify their findings into one of five final assessment categories (2, 7). MQSA requires the use of final assessment categories paralleling those of the American College of Radiology (2). This lexicon is now used internationally. The final assessment categories are presented in Table 11-1. The categories are as follows:
Stay updated, free articles. Join our Telegram channel

Full access? Get Clinical Tree


