Imaging Analysis: Magnetic Resonance Imaging
Susan P. Weinstein
Susan Orel Roth
Major advances have been made in the field of MR imaging of the breast since the first report of the use of gadolinium in 1989 to detect breast cancer (1). Technology has kept pace resulting in faster scanning times with greater spatial resolution. The use of gadolinium remains the cornerstone of cancer detection in breast MRI. The formation of neovascularity by malignant lesions results in more rapid uptake and washout of contrast than the surrounding parenchyma. Unlike mammography, which evaluates lesions based on morphology alone, MRI evaluates lesions using both morphologic as well as functional kinetic information with the sensitivity of MRI for invasive breast cancer approaching 100%. Similar to mammography, uniformity in image quality is being promulgated by the American College of Radiology (ACR). Technical requirements for optimal breast imaging including the requirement for a breast MRI biopsy system are now being defined as part of a ACR breast MRI accreditation program. Also, similar to mammography, the ACR BI-RADS (Breast Imaging Reporting and Data System) lexicon for breast MRI has brought uniformity to the interpretation and reporting of breast MRI examinations. With advances in imaging technique, interpretation guidelines, and increasing availability of MRI breast biopsy systems, MR imaging of the breast is now an integral component of breast imaging in clinical practice in both the diagnostic and the screening settings. The clinical indications for MR imaging of the breast have evolved over time, and although controversy exists, MR imaging is currently performed in the clinical settings of high-risk breast cancer screening, response to neoadjuvant chemotherapy, evaluation of equivocal mammographic findings, clinically concerning nipple discharge, and recently diagnosed breast cancer for staging of the ipsilateral breast and screening of the contralateral breast. The roles of breast MRI will continue to evolve as more data become available.
TECHNICAL CONSIDERATIONS
In contrast to mammography, where the techniques for optimal imaging have been well defined for years under the regulation of the Mammography Quality Standards Act (MQSA), overseen by the Food and Drug Administration (FDA) (2), the image quality of breast MRI studies has varied widely until recently. There are many variables that can affect image quality. In an effort to bring uniformity to the quality of breast MRI studies in the United States, the American College of Radiology currently runs a Breast MRI Accreditation program providing guidelines for quality assurance and control, equipment and image quality, as well as staff and radiologist qualifications (3). Initially, this accreditation program was voluntary. Starting in 2012, the MRI accreditation program became mandatory for non-hospital-based imaging centers receiving Medicare reimbursement. This hopefully will bring greater uniformity to breast MRI quality.
MRI Field Strength
Breast MRI studies should be performed on 1.5T magnets or higher. The high field strength allows for rapid acquisition with high-resolution imaging. There is a linear relationship between magnetic field strength and signal-to-noise ratio (SNR). With greater field strength, the SNR is higher, and higher spatial resolution images can be obtained with shorter acquisition times. The high field strength also makes homogeneous fat suppression possible enabling detection of subtle enhancing lesions. Although 1.5T magnets remain the standard in breast MRI imaging, 3T magnets are commercially available. The higher field strength allows for higher SNR, with more rapid imaging speed and resolution. However, there is no definitive evidence that 3T magnets are superior to 1.5T for clinical breast imaging.
Dedicated Breast Coils
A dedicated breast surface coil must be used when performing breast MRI. Many different types of surface coils are commercially available. The coils contain depressions where the breasts lie during the examination. Within each depression, there are receiver coils that detect signal from the breast and transmit information to generate the images. Coils with greater number of receiver coils will have higher SNR. At the Hospital of the University of Pennsylvania, we utilize a bilateral breast multicoil. This type of coil allows for parallel imaging techniques, which can halve the image acquisition time through imaging both breasts simultaneously. The patient is examined in the prone position, which decreases the effects of respiration as well as reducing artifacts from respiration and cardiac motion. The breasts are gently compressed between two plates, which are placed along the medial and lateral sides of the breast. The compression further minimizes patient motion and reduces the number of sagittal slices required to image the breasts and, thereby, reducing imaging time. This configuration also ensures that all of the breast tissue is close to one of the elements of the array, resulting in enhanced SNR. The compression should be applied gently, as firm compression can delay contrast uptake.
Intravenous Contrast
The cornerstone of breast MRI is imaging following the intravenous injection of a paramagnetic contrast agent (gadolinium chelate). Gadolinium is a T1-shortening agent and was first used in breast MR imaging to detect cancer in 1989 (1). Following intravenous injection, accumulation of gadolinium in tissue reflects alterations in vascular density and/or vascular permeability. The neovascularity recruited by cancer cells results in rapid uptake of contrast followed by rapid washout of contrast, and this is the basic premise of MRI cancer detection. Breast cancers will enhance more rapidly and avidly than the normal surrounding tissues, hence the importance of rapid scanning times. The contrast is injected intravenously as a bolus at the dose of 0.1 mmol/kg, followed by a saline flush.
To minimize patient movement during the exam, the IV should be placed and connected prior to positioning the patient in the magnet. Images should be acquired 1 to 2 minutes after administration of contrast with sequential images acquired immediately after. To gather information about lesion kinetics, at least three postcontrast sequences should be acquired. The pre- and postcontrast images are often obtained with fat suppression to increase the conspicuity of the enhancing lesions.
In addition to dynamic gadolinium-enhanced sequences, T2-weighted images and nonfat saturated T1-weighted images should be obtained. Both of these sequences help characterize lesions that may enhance with gadolinium. The images may be acquired in the sagittal or the axial planes, based on preference. At our institution, the images are acquired in the sagittal plane. Subsequently, delayed postcontrast sequences are obtained to better visualize the lateral tissue and the axilla.
The current maximum recommended dose of gadolinium is 0.1 mmol/kg. It was felt for a long time that gadolinium was a very safe contrast agent with fewer contrast reactions than iodinated contrast agents. While gadolinium is still considered a safe intravenous contrast agent, in 2007 the FDA issued a warning regarding the use of gadolinium contrast agents in people with decreased glomerular filtration rate (GFR) due to reported cases of nephrogenic fibrosing sclerosis (NSF) (4). The association with decreased GFR, gadolinium, and NSF was first reported in 1997. Patients with impaired renal function are at increased risk for NSF, a condition that leads to fibrosis of the skin and internal organs (4). Although the condition is rare, to avoid this potential complication it is recommended that patients with GFR ≤30mL/min/1.73m2 not be administered gadolinium.
Fat Suppression
In contrast to mammography where lesion detectabilility is increased in a fatty background, on MRI an enhancing lesion maybe difficult to detect in a background of fat. Therefore, fat suppression will improve the conspicuity of small enhancing lesions. This can be accomplished with either active or passive fat suppression. We prefer using “active” fat suppression where the signal from fat is removed prior to the injection of intravenous contrast. There are a variety of available fat suppression techniques (5). Alternatively, passive fat suppression can be accomplishing with postprocessing image subtraction (subtracting the precontrast from the postcontrast image). This requires that there be no patient motion between the pre- and the postcontrast sequences. Both methods of fat suppression (chemical fat suppression and image postprocessing image subtraction) can be used together, and in our experience does aid in the detection of small enhancing lesions.
High Spatial and Temporal Resolution
Historically, investigators studying the differentiation of malignant from benign breast lesions were divided into two “camps,” the first being the “high temporal resolution camp” where lesion characterization was based on contrast enhancement kinetics which required high temporal resolution, and the “high spatial resolution camp,” where lesion morphology was critical and required high spatial resolution. Unfortunately, high temporal and high spatial resolution are competing strategies, and choosing one was at the sacrifice of the other. Sensitivity for the detection of small enhancing foci improves with increasing spatial resolution, but this requires longer imaging times. On the other hand, the high temporal resolution needed for dynamic contrast enhancement is obtained at the cost of a loss of spatial resolution, signal to noise, and/or volume of the breast imaged. For optimal spatial resolution, a pixel size of less than 1.0 mm in each in-plane direction is necessary with 3-mm or less slice thickness. For optimal temporal resolution, the first postcontrast images should be obtained in less than 2 minutes following contrast injection, with subsequent scans obtained over the following 5 to 7 minutes to evaluate the shape of the enhancement curve. Different methods may be utilized to optimize these two competing factors. One is using a higher field strength magnet. 3T magnets are available for commercial use. Theoretically, compared to 1.5T magnet, a 3T magnet should provide double the SNR and therefore allowing for faster image acquisition. However, there is no conclusive clinical evidence that 3T is superior to 1.5T in terms of diagnostic performance. Image acquisition time may also be reduced while preserving spatial resolution by using parallel imaging. Parallel imaging allows for simultaneous acquisition of spatial information from both coils, thus reducing the time to acquire the spatial information. Combination of imaging methods may be used as well. Parallel imaging techniques may be further optimized on a 3T magnet.
Diffusion-Weighted Imaging
In addition to evaluating lesion morphology and kinetic information, diffusion-weighted imaging (DWI) may be used to increase the specificity of MRI. Although DWI should not
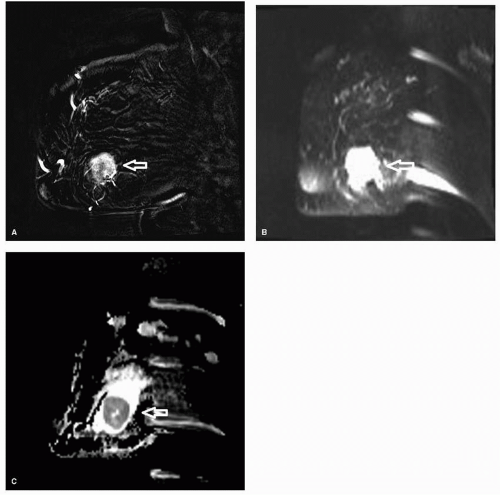
be the primary method used for lesion analysis, it can be helpful when the other imaging parameters such as lesion morphology and kinetic information are equivocal. The concept of diffusion is based on random and thermal motion of water in tissue, also known as Brownian motion. Tissues with high cellularity restrict the motion of water whereas tissues with low cellularity allow for more free movement of the water molecules. Tumors tend to have higher cellularity and hence have restricted motion. On DWI, the restricted motion results in a higher signal intensity (Fig. 13-1). The technique that is most commonly used to generate DWI imaging is T2-weighted echo planar imaging. Due to the higher cellularity of carcinomas, there is restricted diffusion in invasive cancers relative to benign lesions and normal parenchyma, resulting in relatively brightness of malignant lesions compared to benign lesions. Different diffusion gradients, b, are applied. The signal loss from the different gradients is exponentially proportional to the amount of diffusion of the water molecules. The apparent diffusion coefficient (ADC) can be calculated from at least two diffusion weighted image sets at different b values. Restricted diffusion and high cellularity results in lower ADC values.
be the primary method used for lesion analysis, it can be helpful when the other imaging parameters such as lesion morphology and kinetic information are equivocal. The concept of diffusion is based on random and thermal motion of water in tissue, also known as Brownian motion. Tissues with high cellularity restrict the motion of water whereas tissues with low cellularity allow for more free movement of the water molecules. Tumors tend to have higher cellularity and hence have restricted motion. On DWI, the restricted motion results in a higher signal intensity (Fig. 13-1). The technique that is most commonly used to generate DWI imaging is T2-weighted echo planar imaging. Due to the higher cellularity of carcinomas, there is restricted diffusion in invasive cancers relative to benign lesions and normal parenchyma, resulting in relatively brightness of malignant lesions compared to benign lesions. Different diffusion gradients, b, are applied. The signal loss from the different gradients is exponentially proportional to the amount of diffusion of the water molecules. The apparent diffusion coefficient (ADC) can be calculated from at least two diffusion weighted image sets at different b values. Restricted diffusion and high cellularity results in lower ADC values.
Various studies have shown that using an ADC cutoff value can aid in discriminating between benign and malignant lesions (6, 7). However, there is no standardization of diffusion techniques. Different ADC cutoff values and diffusion gradients are used from institution to institution. In addition, although most carcinomas have high cellularity and low ADC values, some benign lesions can exhibit these characteristics. Likewise, some malignant lesions can
also demonstrate benign features on DWI such as necrotic tumors, tumors with cystic components, and mucinous tumors. At this time, given these limitations and overlap with benign and malignant features, one cannot reliably use DWI alone to differentiate benign from malignant lesions but rather use this information in combination with morphologic features and kinetic information.
also demonstrate benign features on DWI such as necrotic tumors, tumors with cystic components, and mucinous tumors. At this time, given these limitations and overlap with benign and malignant features, one cannot reliably use DWI alone to differentiate benign from malignant lesions but rather use this information in combination with morphologic features and kinetic information.
MRI-Guided Localization or Biopsy Capability
The ability to perform MRI-guided interventional procedures is an integral part of MRI imaging. A requirement of the ACR breast MRI accreditation program, the facility performing breast MRI must either have the capacity to perform MRI-guided breast interventional procedures or to create a referral arrangement with a cooperating facility that will provide these services (3). There will be malignant lesions detected on MRI that will be occult on mammography, sonography, and clinical examination, hence the need to perform MRI-guided biopsies. With a technique that is highly sensitive but not highly specific, a needle localization or core needle biopsy system is needed to differentiate true positive enhancing malignant lesions from false positive benign enhancing lesions. The two available options are MRI-guided core needle biopsy and MRI-guided needle localization.
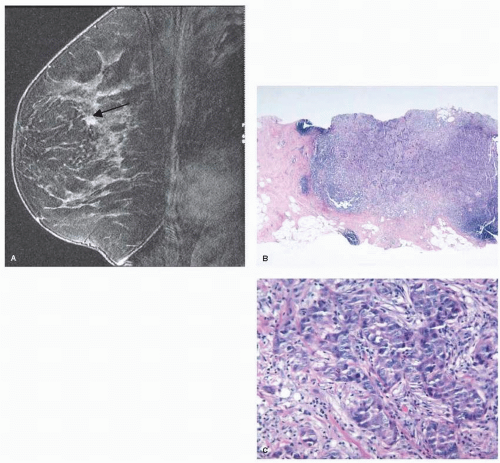
Historically, MRI-guided intervention was limited to needle localization followed by excisional biopsy. Currently, many different MRI-compatible core biopsy systems are commercially available. MRI-guided core needle biopsy is a safe and accurate way to biopsy MRI detected lesions (Fig. 13-2). Similar to ultrasound-guided core needle biopsy, the advantages of MRI-guided core biopsy over excisional biopsy are the less invasive nature of the procedure, minimizing the number of surgical procedures in patients diagnosed with breast cancer, and reduced costs.
A major limitation of MRI-guided needle localization and core biopsy remains the inability to verify successful lesion removal or lesion sampling. In the case of needle localization,
the lesion localized with MRI guidance is usually not visible with mammographic specimen radiography. In the case of core biopsy, the ability to document successful sampling can be impossible due to the washout of contrast during the procedure. While a clip is placed following most MRI core biopsies, documentation of accurate clip placement can be difficult if the lesion is not visible at the end of the procedure. In such situations where there is washout of contrast, correlation with anatomic landmarks is recommended to confirm appropriate biopsy site and clip placement. Careful radiologic-pathologic correlation is needed to determine if the pathology findings are concordant with the imaging findings. In any case where the MRI finding is highly suspicious but the pathology is benign, immediate repeat MRI is required. Repeat MRI shortly after the biopsy is needed to confirm that the lesion has been adequately been sampled. If the targeted lesion is still present on the follow-up MRI, repeat MRI percutaneous biopsy or excisional biopsy would be necessary. However, when there is concordant benign histology, the management can vary from routine follow-up to a 6-month follow-up MRI. Whether short interval MRI follow-up should be performed in all cases with a nonspecific benign pathology result (i.e., fibrocystic changes or benign breast tissue) remains to be defined.
the lesion localized with MRI guidance is usually not visible with mammographic specimen radiography. In the case of core biopsy, the ability to document successful sampling can be impossible due to the washout of contrast during the procedure. While a clip is placed following most MRI core biopsies, documentation of accurate clip placement can be difficult if the lesion is not visible at the end of the procedure. In such situations where there is washout of contrast, correlation with anatomic landmarks is recommended to confirm appropriate biopsy site and clip placement. Careful radiologic-pathologic correlation is needed to determine if the pathology findings are concordant with the imaging findings. In any case where the MRI finding is highly suspicious but the pathology is benign, immediate repeat MRI is required. Repeat MRI shortly after the biopsy is needed to confirm that the lesion has been adequately been sampled. If the targeted lesion is still present on the follow-up MRI, repeat MRI percutaneous biopsy or excisional biopsy would be necessary. However, when there is concordant benign histology, the management can vary from routine follow-up to a 6-month follow-up MRI. Whether short interval MRI follow-up should be performed in all cases with a nonspecific benign pathology result (i.e., fibrocystic changes or benign breast tissue) remains to be defined.
For a MRI-detected lesion, a targeted ultrasound examination or second-look ultrasound may be done in correlation with the MRI findings. The likelihood of visualizing the MRI-detected lesion on sonography is dependent on lesion morphology, size, and pathology (8, 9). Greater success will be had with enhancing masses than nonmass enhancement. In addition, malignant lesions were more likely to be visible than benign lesions. Also, the larger the lesion size, the more likely it will be visible on targeted sonography. The success rate of targeted second-look ultrasound has been reported to be 23% to 89%.
If the MRI-detected lesion is sonographically visible, ultrasound-guided biopsy is the preferred method of biopsy. It is cheaper, faster, and more readily available when compared to MRI, with greater patient comfort. However, intermodality correlation is essential to confirm the sonographic lesion correlates with the MRI lesion. This involves correlation of the lesion size, depth in the breast, and location relative to other anatomic structures. Due to differences in patient positioning, supine for breast ultrasound and prone for breast MRI, occasionally this can be challenging. Meissnitzer et al. found on follow-up of 80 histologically benign cases that were biopsied under ultrasound and felt to be concordant to the MRI lesions, the sonographic mass did not correlate with the MRI lesion 12% of the time (10). Careful correlation is needed and follow-up imaging should be considered.
Image Interpretation
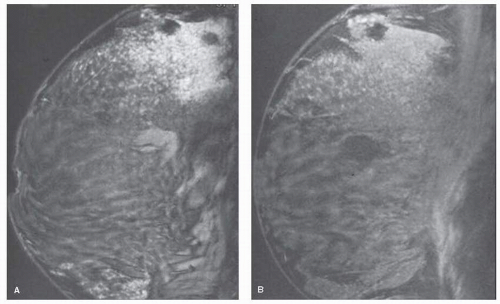
MRI has emerged as an important imaging technique for the detection, diagnosis, and staging of breast cancer. The value of MRI in this setting is derived primarily due to high sensitivity for the detection of breast cancer, with reported sensitivities ranging from 88% to 95% (11). However, high reported sensitivities have been tempered by relative low specificity, with reported specificities reports rates widely ranging from 37% to 97% (12). The low specificity is due to the overlap in morphologic appearances and enhancement behavior of benign and malignant lesions. Contrast enhancement has been seen not only in cancer, but also in fibroadenoma, fibrocystic changes including sclerosing adenosis, fat necrosis, radial scar, mastitis, atypical ductal hyperplasia, and lobular neoplasia (Fig. 13-3). In addition, presumably normal breast tissue may enhance following contrast enhancement. This enhancement has been shown to vary with different phases of the menstrual cycle, being greatest in weeks 1 and 4, lowest in week 2 (13) (Fig. 13-4). When using enhancement kinetics alone, it was shown in one study that up to three-fourths of enhancing lesions with suspicious enhancement kinetics were no longer visible when the study was repeated at a more optimum time in the menstrual cycle (13).
The characterization of enhancement as normal, benign, or concerning for malignancy remains a challenge. Historically, image interpretation was complicated by two fundamentally different methods for performing breast MRI; one utilizing three-dimensional high spatial resolution scans to assess lesion morphology, and the other utilizing rapid, dynamic imaging to assess enhancement kinetics. As discussed earlier, advances in both software and hardware now permit imaging with high spatial resolution and high temporal resolution so that both morphology and enhancement kinetics can be evaluated in the same study. While it has become increasing apparent that both architectural features and enhancement characteristics may yield greater accuracy than using either alone, characterization of morphologic features appears to be more predictive of malignancy than is characterization of the enhancement kinetic cure (14, 15 and 16).
Numerous morphologic and dynamic enhancement curve criteria for classifying an enhancing lesion as benign or suspicious for malignancy have been described in the literature. In an effort to bring uniformity to breast MRI reports, an MRI breast imaging lexicon (BI-RADS) has been created through the efforts of the Susan Komen Foundation, the Public Health Service Office on Women’s Health, and the American College of Radiology (ACR) (17). The first version of the MRI breast lexicon was published by the ACR in 2003, with the second edition due out in 2013. Results from many studies that evaluated the positive predictive value of morphologic and kinetic feature were incorporated into the first edition of the lexicon, and findings from more recent studies will be added to the second edition. One addition to the second BI-RADS MR imaging lexicon will be the description of background parenchymal enhancement (BPE), which refers to the presumably normal enhancement of the fibroglandular tissue identified on the first contrast-enhanced series. BPE is thought to be related to endogenous hormone status and fluctuates with the menstrual cycle, highest during weeks 1 and 4 and lowest during week 2 as noted above. It has been found to increase in postmenopausal women undergoing hormone replacement therapy, and to decrease in women treated with tamoxifen or aromatase inhibitors (18). Currently the degree of BPE is subjective, and is reported as minimal (less than 25%); mild (26% to 50%); moderate (51% to 75%); and marked (greater than 75%) (Fig. 13-5). It has been postulated that the degree of BPE may decrease the sensitivity of breast MRI by obscuring enhancing malignancies. Investigators evaluating BPE and impact of the diagnostic performance of MRI have reported that increasing background enhancement is associated with younger patient and age and higher abnormal interpretation rate (BI-RADS Category 3, 4, or 5), but found no significant difference in positive biopsy rate or cancer detection rate among the BPE categories (19, 20).
Following the description of BPE, an area (or areas) of abnormal enhancement is then described using lesion descriptors (morphology and enhancement kinetics). Enhancing lesions are divided into three main categories: focus or foci, mass, and nonmasslike enhancement (NMLE) (Fig. 13-6). A focus (foci) is defined as enhancement measuring less than or equal to 5 mm that cannot be otherwise characterized due to size. A mass is a 3-D lesion that occupies a
space in the breast, and is described in terms of shape, margin, and internal enhancement. NMLE is an area of enhancement without an associated mass (space occupying lesion) and is characterized by distribution, internal enhancement, and symmetry. Enhancement curve assessment includes the initial enhancement phase in first 2 minutes (slow, medium, or rapid), and the delayed phase (persistent increasing, plateau, or washout) (Fig. 13-7).
space in the breast, and is described in terms of shape, margin, and internal enhancement. NMLE is an area of enhancement without an associated mass (space occupying lesion) and is characterized by distribution, internal enhancement, and symmetry. Enhancement curve assessment includes the initial enhancement phase in first 2 minutes (slow, medium, or rapid), and the delayed phase (persistent increasing, plateau, or washout) (Fig. 13-7).
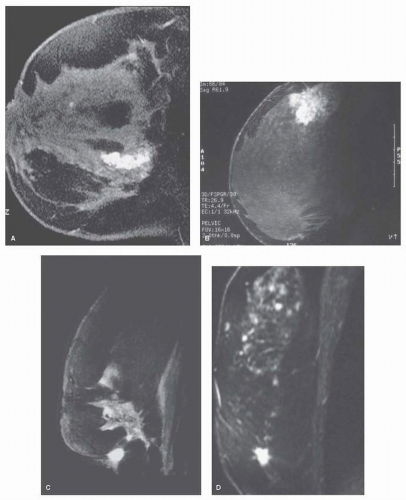 FIGURE 13-3 False-positive enhancing lesions. Contrast enhancement is demonstrated in (A) sclerosing adenosis, (B) chronic mastitis, (C) fat necrosis, and (D) radial scar. |
Architectural features reported to be highly predictive of benign disease include masses with smooth or lobulated
borders, the absence of mass enhancement, and a circumscribed mass with nonenhancing internal septations, which in some reports was specific for the diagnosis of a fibroadenoma (14, 21). While circumscribed borders on mammography are associated with a 2% likelihood of cancers (22), it has been suggested that this morphologic feature may not be a reliable indicator of benignity on MRI for several reasons including the circumscribed borders of some cancers in high-risk patients, and the perception of margin smoothness which is dependent on spatial resolution and window and level settings (16, 23, 24). This can be especially problematic in masses smaller than 1 cm in size. In a study of positive predictive value of various morphologic and kinetic features, Liberman et al. reported that 17% of smoothly marinated masses in their series were malignant (16). In contrast, Gutierrez et al. reported that masses of 1 cm or greater with smooth margins and homogeneous enhancement in their series had the lowest predicted probability of malignancy of 3% (24). However, this was not the case with smaller masses, where the likelihood of malignancy for small masses (less than 1 cm in size) with smooth margins and homogeneous enhancement was 16%. Histologic subtypes that may have smooth margins include mucinous cancer, intracystic papillary cancer, and some high-grade tumors, such as triple-negative cancer (25). Despite smooth margins, these malignant lesions often display other concerning morphologic features including heterogeneous enhancement, rim enhancement, and/or an enhancement kinetic curve showing contrast washout over time.
borders, the absence of mass enhancement, and a circumscribed mass with nonenhancing internal septations, which in some reports was specific for the diagnosis of a fibroadenoma (14, 21). While circumscribed borders on mammography are associated with a 2% likelihood of cancers (22), it has been suggested that this morphologic feature may not be a reliable indicator of benignity on MRI for several reasons including the circumscribed borders of some cancers in high-risk patients, and the perception of margin smoothness which is dependent on spatial resolution and window and level settings (16, 23, 24). This can be especially problematic in masses smaller than 1 cm in size. In a study of positive predictive value of various morphologic and kinetic features, Liberman et al. reported that 17% of smoothly marinated masses in their series were malignant (16). In contrast, Gutierrez et al. reported that masses of 1 cm or greater with smooth margins and homogeneous enhancement in their series had the lowest predicted probability of malignancy of 3% (24). However, this was not the case with smaller masses, where the likelihood of malignancy for small masses (less than 1 cm in size) with smooth margins and homogeneous enhancement was 16%. Histologic subtypes that may have smooth margins include mucinous cancer, intracystic papillary cancer, and some high-grade tumors, such as triple-negative cancer (25). Despite smooth margins, these malignant lesions often display other concerning morphologic features including heterogeneous enhancement, rim enhancement, and/or an enhancement kinetic curve showing contrast washout over time.
Architectural features with highest PPV for malignancy include a mass with spiculated or irregular margins, irregular shape, marked internal enhancement, and/or rim enhancement (11, 12, 14, 15 and 16). These findings suggest the presence of an invasive cancer. For NMLE, the features with highest PPV for malignancy include segmental or clumped linear enhancement (11, 12, 14, 15 and 16, 24) and suggest the diagnosis of DCIS. The enhancement kinetics with the highest PPV is rapid initial enhancement with delayed phase showing plateau or washout (11, 12, 14, 15 and 16). However, as noted previously, kinetic information is less predictive of malignancy than is morphologic characterization. This is especially true with NMLE, where DCIS not uncommonly displays suspicious ductal or segmental morphology, but with benign kinetic curves (24).
Stay updated, free articles. Join our Telegram channel

Full access? Get Clinical Tree


