| Chapter 6 | Illustrative Cases with 3-Dimensional Stereoscopic Histological Images |
A 56-year-old asymptomatic woman, screening examination.
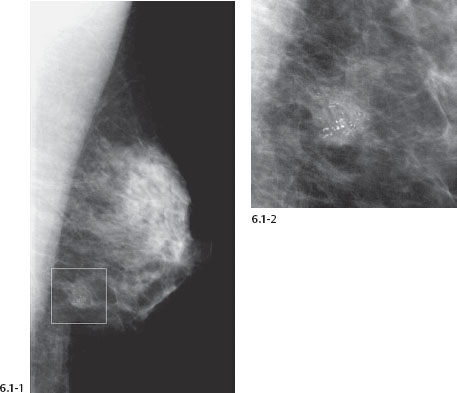
Figs. 6.1-1 & 2 Left breast, MLO (1) and microfocus magnification (2) views show a combination of casting type and crushed stone–like calcifications surrounded by an ill-defined density.
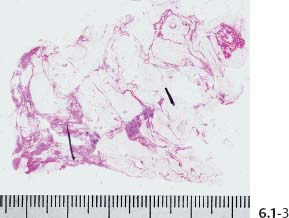
Fig. 6.1-3 Large-section histology (H&E). The cancerous area has been marked by the pathologist.
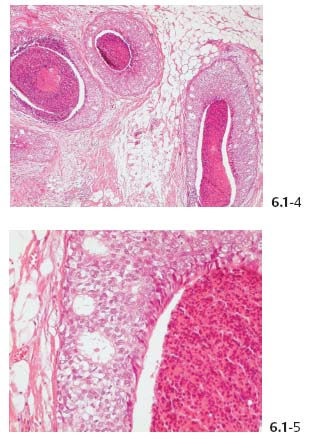
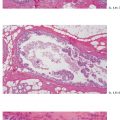
Figs. 6.1-4 & 5 Histology (H&E): in-situ carcinoma with central necrosis. No signs of invasion.
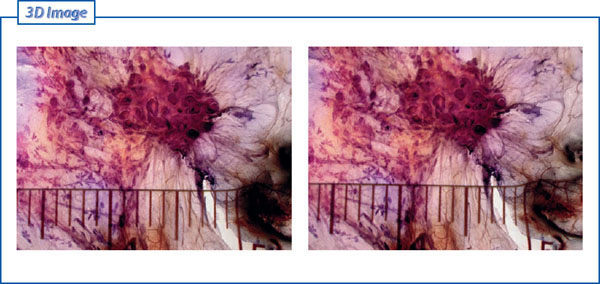
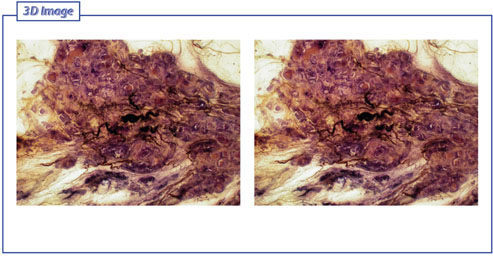
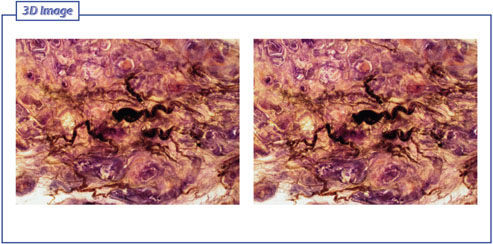
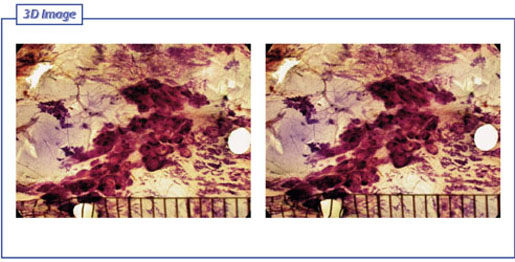
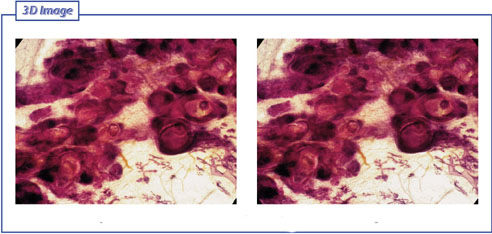
Figs. 6.1-6 & 7 Subgross, thick-section (3D) histological images of this in-situ carcinoma.
At age 64 years, recurrence was detected beside the surgical scar.
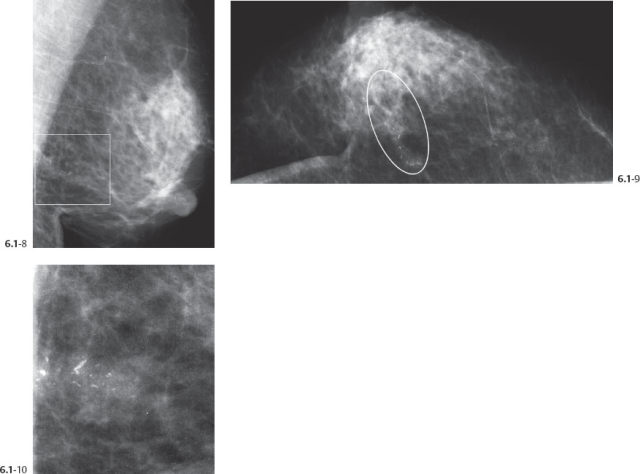
Figs. 6.1-8 to 10 Left breast MLO (8), CC projections (9) and microfocus magnification view (10): malignant type calcifications are seen (recurrence) at the site of the surgical excision. The calcifications have a similar appearance to those seen eight years earlier, before treatment.
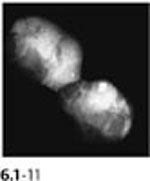
Fig. 6.1-11 14G core biopsy specimen containing calcifications.
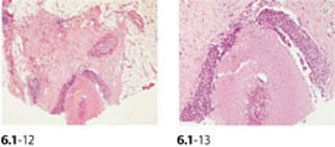
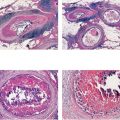
Figs. 6.1-12 & 13 Medium-power (12) and higher-power histology (13; H&E) of the 14G core biopsy: cancer in situ with solid cell proliferation and central necrosis (12). The recurrent carcinoma is a combination of in situ and invasive ductal carcinoma.
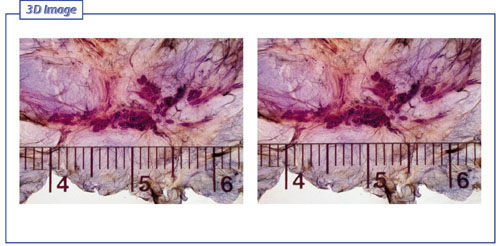
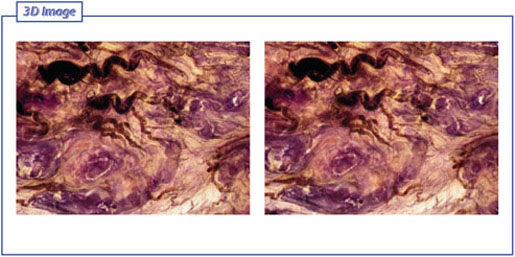
Figs. 6.1-14 & 15 Subgross, thick-section (3D) histology. The contorted, distended ducts filled with carcinoma are spread over a region measuring 22 mm × 10 mm.
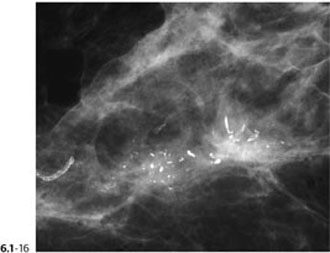
Fig. 6.1-16 Microfocus magnification of one of the specimen slices showing the casting type calcifications surrounded by an illdefined density.
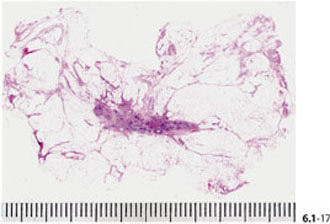
Fig. 6.1-17 Large-section histology (H&E): the pathological ducts and the surrounding density have been removed with a good margin.
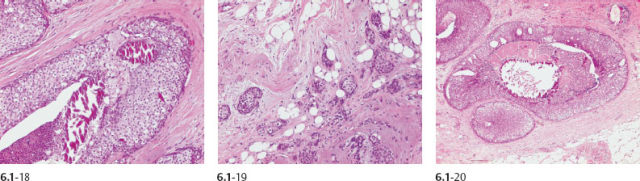
Figs. 6.1-18 to 20 Histology (H&E): in-situ carcinoma (18, 20) associated with Grade 2 invasive cancer (19).
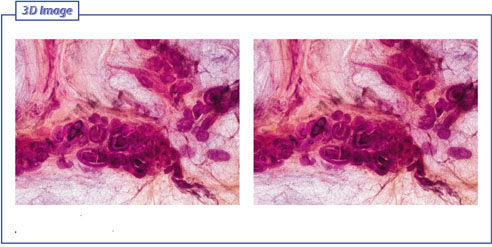
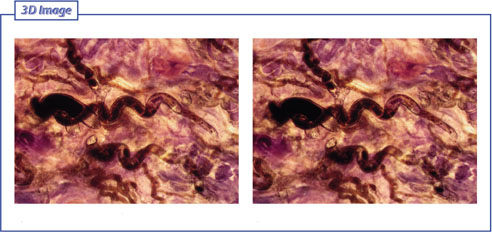
Fig. 6.1-21 & 22 Subgross, thick-section (3D) histology: the distended ducts containing cancer cells, central necrosis and amorphous calcifications are closely spaced.
A 66-year-old woman, operated for cancer in her left breast four years before this examination. Her treatment included surgery, postoperative irradiation and treatment with tamoxifen. At her fourth annual follow-up examination a cancer was detected in the lower-inner quadrant of her right breast.
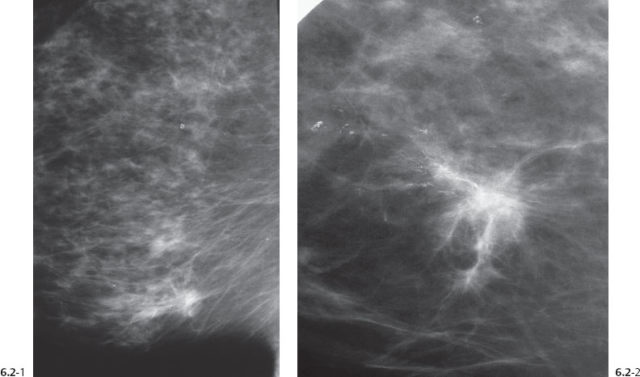
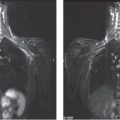
Figs. 6.2-1 & 2 Right breast, MLO projection (1) and microfocus magnification (2). There is a stellate tumor with associated casting type calcifications within and surroundings of the mammographically malignant tumor.
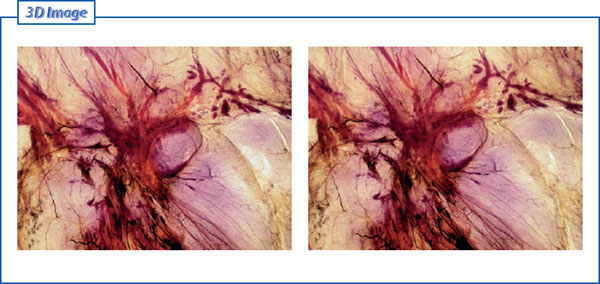
Figs. 6.2-3 & 4 Subgross, thick-section (3D) histology shows an overview of both the invasive and intraductal carcinoma.
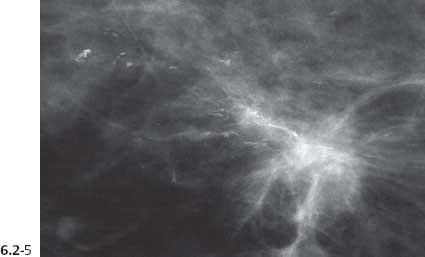
Fig. 6.2-5 Further magnification of the malignant tumor associated with casting type calcifications.
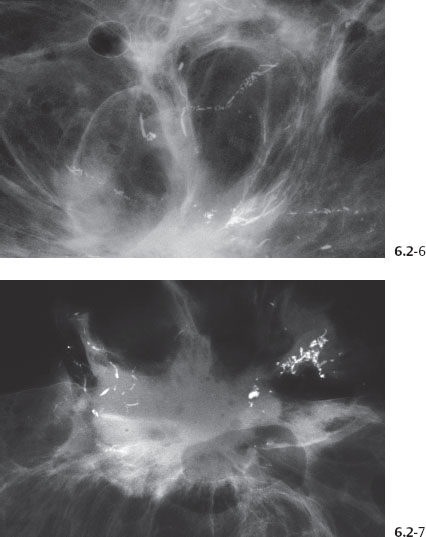
Figs. 6.2-6 & 7 Microfocus magnification of two surgical specimen slices.
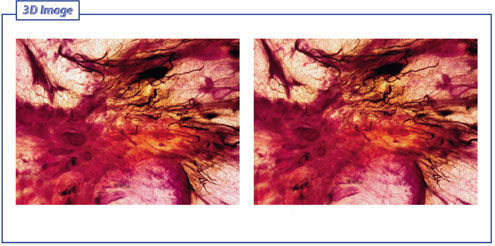
Fig. 6.2-8 & 9 Subgross, thick-section (3D) histology. The invasive tumor also has in-situ components and a rich net of tumor vessels.
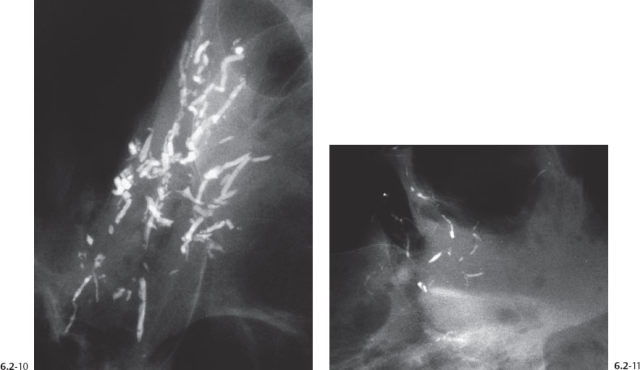
Figs. 6.2-10 & 11 Microfocus magnification images of two surgical specimen slices containing the casting type calcifications.
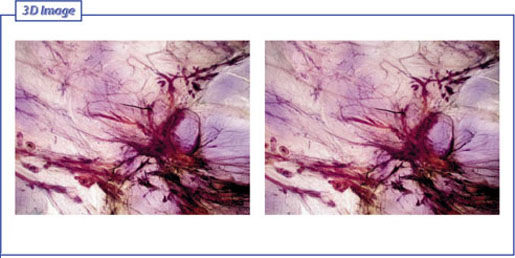
Figs. 6.2-12 & 13 Subgross, thick-section (3D) histology. On this lower-magnification image the invasive tumor and the surrounding in-situ components are seen.
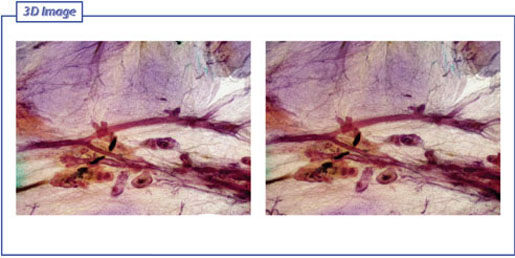
Figs. 6.2-14 & 15 Subgross, thick-section (3D) histology. The long ducts are filled with cancer cells and lack TDLUs. Occasional amorphous calcifications are seen.
Figs. 6.2-16 & 17 Subgross, thick-section (3D) histology. Higher magnification of the cancerous ducts also shows central necrosis and casting type calcifications.
Figs. 6.2-18 & 19 Subgross, thick-section (3D) histology. These abnormal, cancer-filled ducts and their branches do not contain calcifications.
Figs. 6.2-20 & 21 Subgross, thick-section (3D) histology. The lower magnification makes it possible to compare the discrepancy in size and shape between the atrophic ducts and the cancer-filled ducts.
Figs. 6.2-22 & 23 Subgross, thick-section (3D) histology. Closer view of the abnormal, cancerous ducts which have no associated TDLUs.
The patient died from disseminated breast cancer two years after diagnosis and treatment.
A 36-year-old woman with bloody discharge from the right nipple. There is no palpable tumor at physical examination.
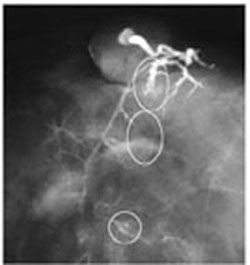
Fig. 6.3-1 Right breast, CC projection, detail of galactogram. The slightly dilated duct and its branches drain an area with multiple cluster calcifications. No tumor mass is demonstrable.
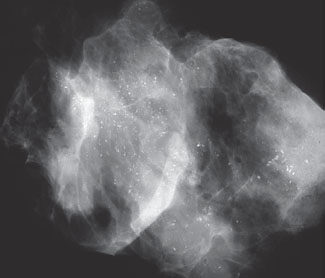
Fig. 6.3-2 Specimen radiograph showing innumerable crushed stone–like and a few casting type calcifications.
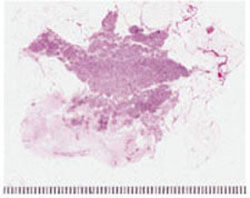
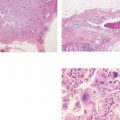
Fig. 6.3-3 Large-section histology (H&E): there is an abnormal concentration of the cancerous ducts over a large area, corresponding to the region with the malignant type calcifications.
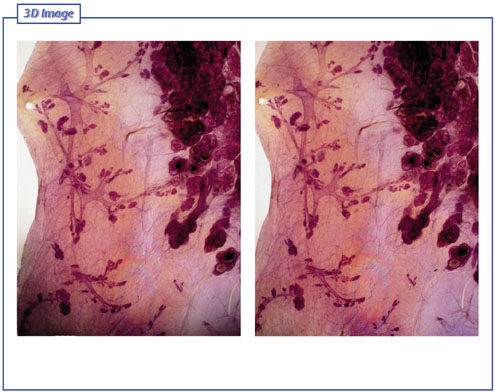
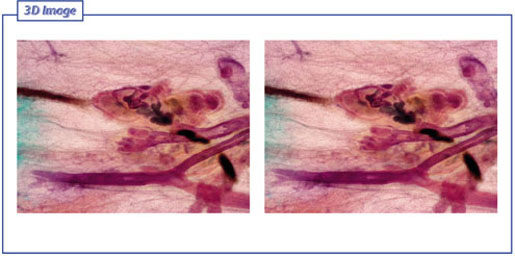
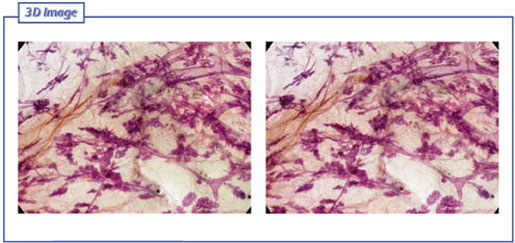
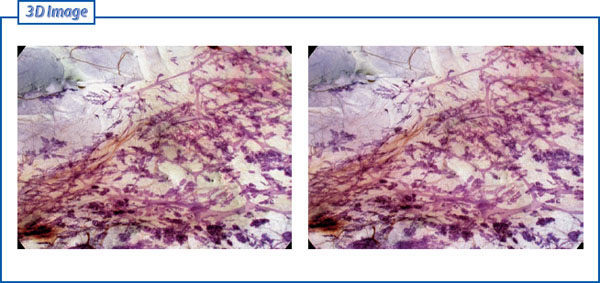
Figs. 6.3-4 & 5 Subgross, thick-section (3D) histology: direct comparison of the distribution and architecture of normal ducts and associated TDLUs (on the left-hand side of the image pair) with the cancerous, ductlike structures, which we consider to be the product of neoductgenesis (on the right-hand side of the image pair). These pathological structures do not resemble preexisting ducts in terms of orientation, size, shape, or architecture.
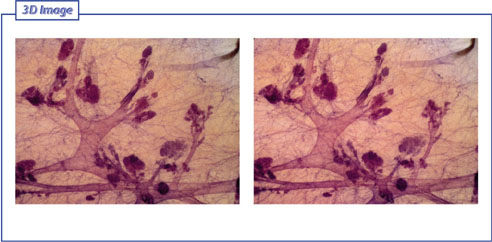
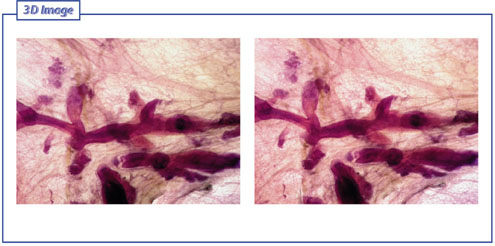
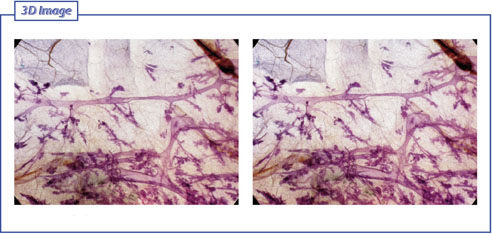
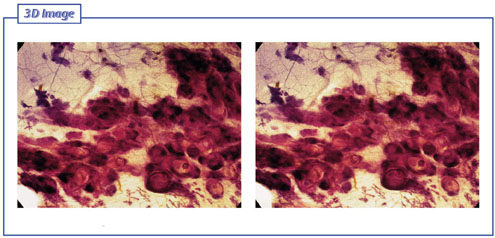
Figs. 6.3-6 & 7 Subgross, thick-section (3D) histology: The architecture of the normal breast is demonstrated here, showing the subsegmental ducts and the associated TDLUs.
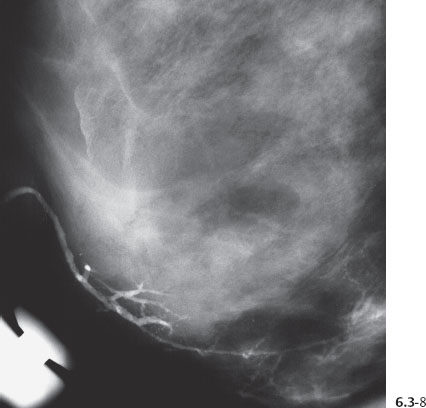
Fig. 6.3-8 Galactogram, detail of the MLO projection. The bloody nipple discharge originated from the region containing the malignant type calcifications.
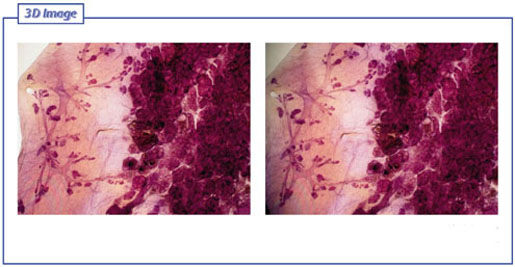
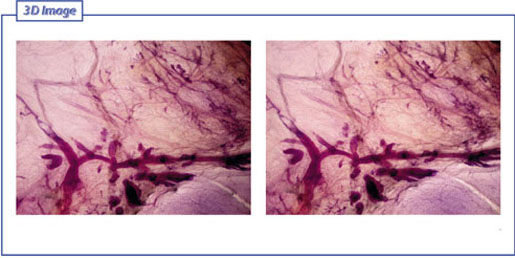
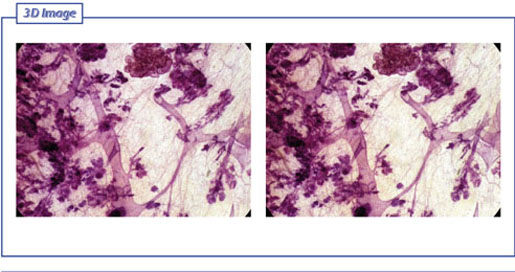
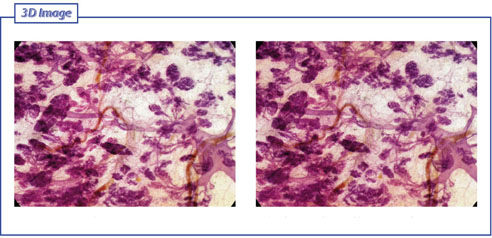
Figs. 6.3-9 & 10 Subgross, thick-section (3D) histological image of the area with calcifications: Dilated, cancer-filled ductlike structures are densely packed into a region several centimeters in size. Note the normal distribution of the atrophic ducts and TDLUs in the vicinity of the cancer.
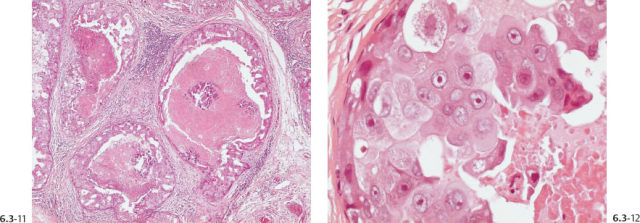
Figs. 6.3-11 & 12 Histology (H&E): the ducts are distended by Grade 3 cancer cells, central necrosis and amorphous calcifications.
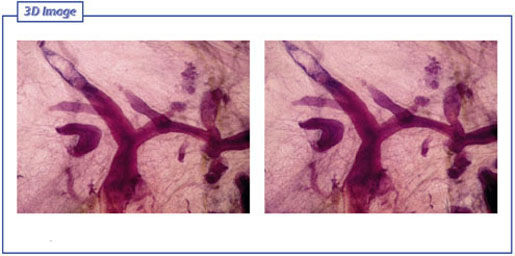
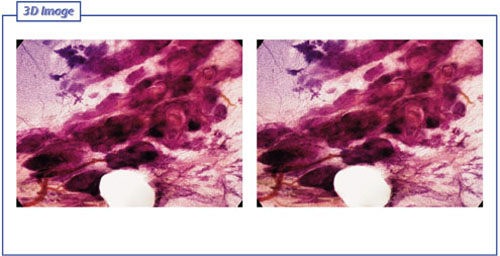
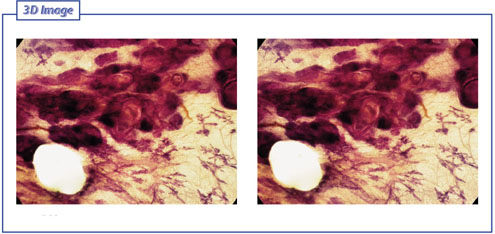
Figs. 6.3-13 & 14 Subgross, thick-section (3D) histological image of the area with calcifications: The distended, cancer-filled ductlike structures are tightly packed together.
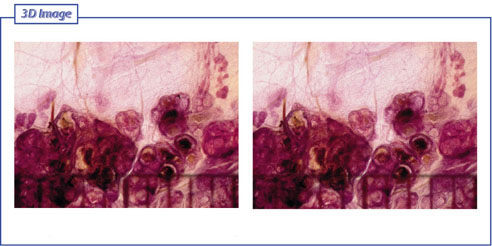
Fig. 6.3-15 & 16 Subgross, thick-section (3D) histological image: The cancer-filled ductlike structures are extremely distended, measuring 1.0 mm or more in diameter. The normal, resting duct has a diameter of about 0.1 mm.
A 59-year-old asymptomatic woman, screening examination. Her mother died from breast cancer.
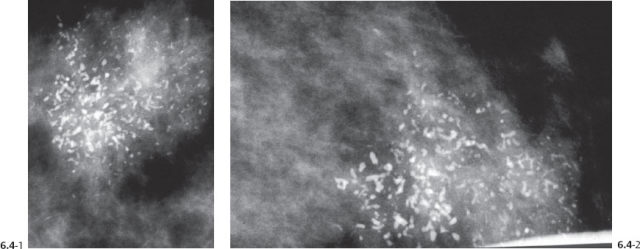
Figs. 6.4-1 & 2 Details of the MLO (1) and CC (2) projections, microfocus magnification views, showing a mixture of crushed stone–like and casting type calcifications. These are mammographically malignant type calcifications.
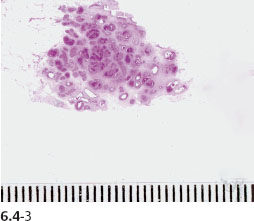
Fig. 6.4-3 Large-section histology shows an abnormal accumulation of the ductlike, cancerous structures within a confined area.
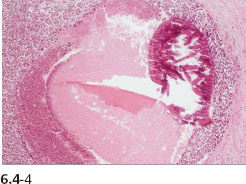
Fig. 6.4-4 Medium-power magnification histological image (H&E). Cross section of a duct distended by cancer cells with solid cell architecture, central necrosis, and amorphous calcification. No signs of invasion.
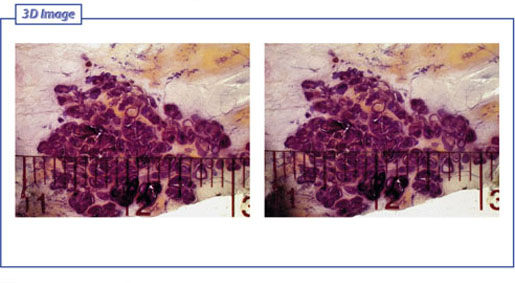
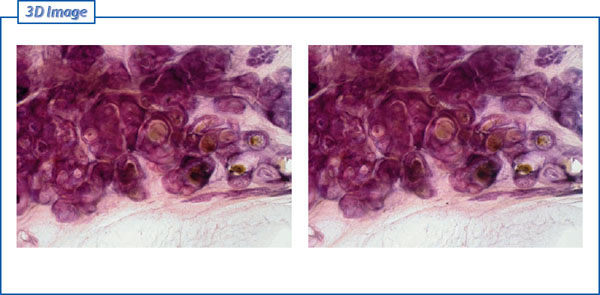
Figs. 6.4-5 & 6 Subgross, thick-section (3D) image of the area with calcifications. The dilated, cancer-filled ducts have diameters that are 10–15 times that of normal ducts. The ductlike structures are densely packed into a confined region several centimeters in diameter.
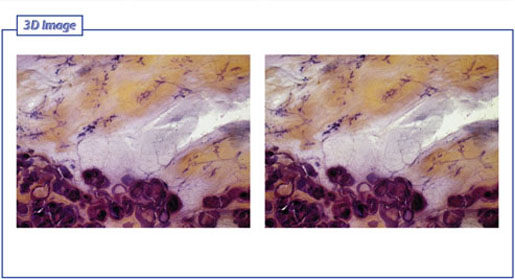
Figs. 6.4-7 & 8 Subgross, thick-section (3D) histology demonstrates the normal distribution and spatial arrangement of atrophic, normal ducts and TDLUs surrounded by fibrous tissue in contrast to the distended, cancerous ductlike structures, which are tightly packed with little intervening connective tissue.
Figs. 6.4-9 & 10 Subgross, thick-section (3D) histology: the atrophic, normal ducts and TDLUs and the extremely distended, cancer-filled ducts are seen side by side.
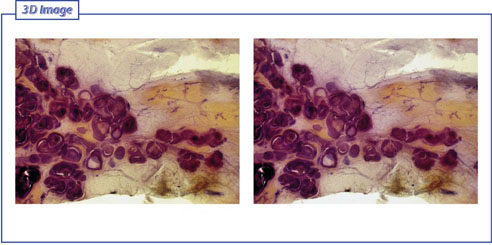
Figs. 6.4-11 & 12 Subgross, thick-section (3D) of the area with calcifications. The pathological ducts can be compared with the normal ducts in close proximity.
Figs. 6.4-13 & 14 Subgross, thick-section (3D) of the area with calcifications: higher magnification of the pathological ducts.
Figs. 6.4-15 & 16 Subgross, thick-section (3D) histology demonstrates the individual ducts with solid cell proliferation, central necrosis, and amorphous calcifications.
A 55-year-old woman felt a lump under her left areola.
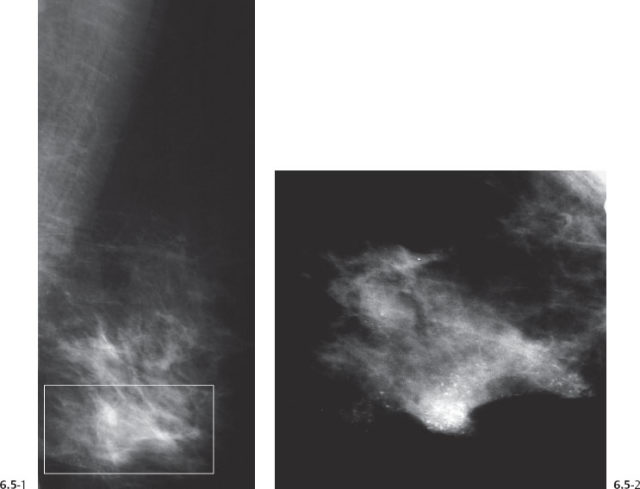
Figs. 6.5-1 & 2 Left breast, MLO projection (1) and microfocus magnification (2) of the lower half of the left breast show a large number of malignant type calcifications surrounded by a nonspecific density.
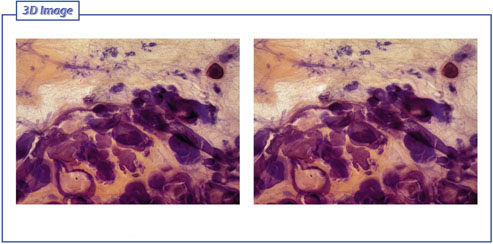
Figs. 6.5-3 & 4 Subgross, thick-section (3D) histology demonstrates an unnaturally high concentration of ductlike structures filled with malignant cells and central necrosis. A large number of tumor vessels supply this poorly differentiated conglomeration.
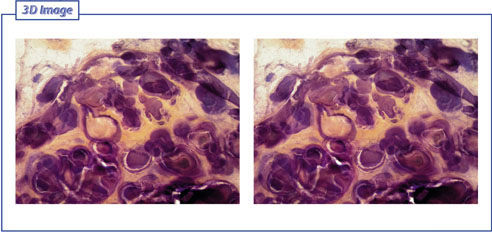
Figs. 6.5-5 & 6 Subgross, thick-section (3D) histology: at higher magnification the relationship between the distended, cancerous ducts and the tumor vessels is better appreciated.
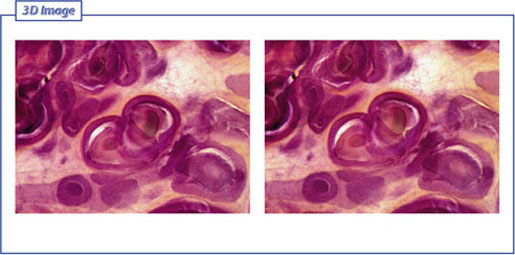
Figs. 6.5-7 & 8 Subgross, thick-section (3D) histology demonstrates the intimate relationship of the pathological ducts with the surrounding tumor vessels.
Figs. 6.5-9 & 10 Subgross, thick-section (3D) histology: high magnification of the tortuous tumor vessels.
Figs. 6.5-11 & 12 Subgross, thick-section (3D) histology shows the haphazard architecture of the tumor vessels.
Figs. 6.5-13 & 14 Subgross, thick-section (3D) histology: the pathological ducts are distended by tumor cells, necrosis, and amorphous calcifications to a size more than 10 times the diameter of normal ducts (see millimeter scale).
A 31-year-old lactating woman presented with a palpable lump in the upper outer quadrant of her right breast. Physical examination confirmed a hard tumor larger than 2.0 cm, suspicious for malignancy.
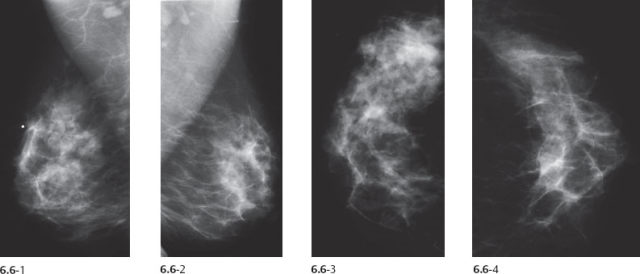
Figs. 6.6-1 to 4 Right and left breasts, MLO (1 & 2) and CC (3 & 4) projections. Corresponding to the palpable tumor, an asymmetric density with architectural distortion is seen covering a region 6 cm × 7 cm filling the upper outer quadrant. No associated calcifications are demonstrable.
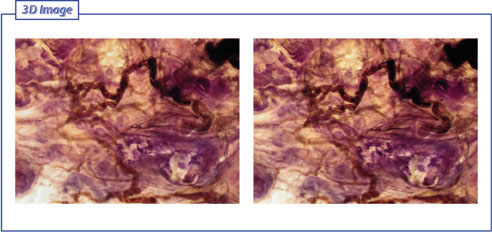
Figs. 6.6-5 & 6 Subgross, thick-section (3D) histology: normal TDLUs; some of them show changes typically seen in lactation.
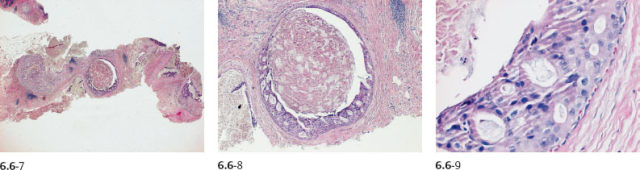
Figs. 6.6-7 to 9 14-g core biopsy: poorly differentiated in-situ carcinoma.
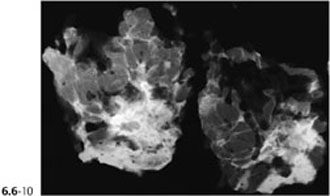
Fig. 6.6-10 Radiographs of the sliced surgical specimen.
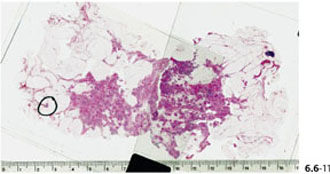
Fig. 6.6-11 Large-section histology: the in-situ process measures >10 cm.
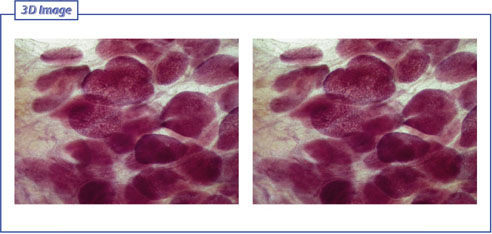
Figs. 6.6-12 & 13 Subgross, thick-section (3D) histology: There is a large number of distended, cancerous ducts on the left side of the image, while entirely normal breast parenchyma is seen on the right side of the image.
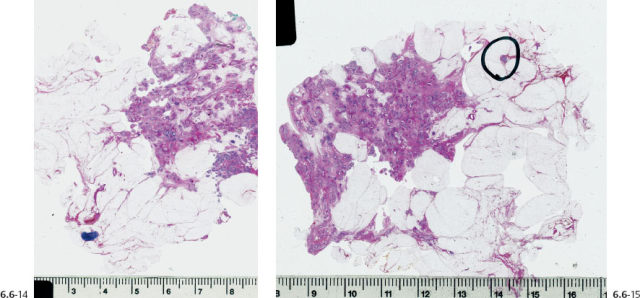
Figs. 6.6-14 & 15 Several large-section histological slices are needed to cover the area with the pathological ducts.
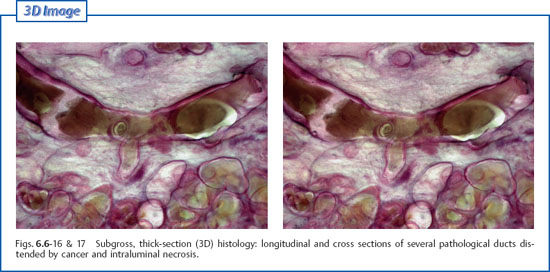
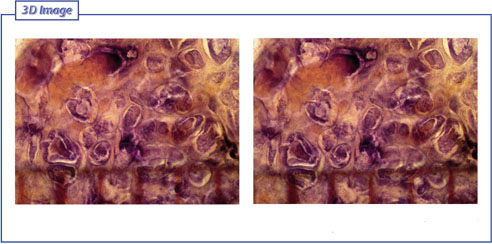
Figs. 6.6-16 & 17 Subgross, thick-section (3D) histology: longitudinal and cross sections of several pathological ducts distended by cancer and intraluminal necrosis.
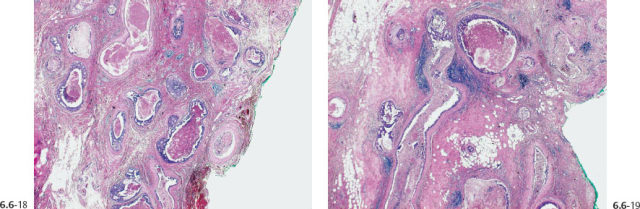
Figs. 6.6-18 & 19 Medium-power histology images of the large section (H&E). The pathological ducts are seen against a dense fibrous background. The ducts are tightly packed and are surrounded by a desmoplastic reaction and lymphocytic infiltration.
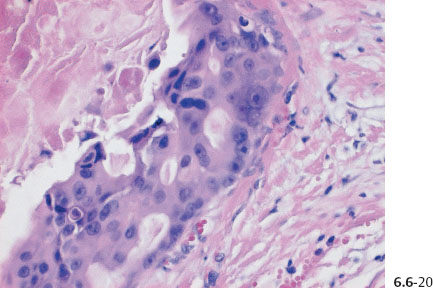
Fig. 6.6-20 Higher-magnification histological image of this poorly differentiated in-situ carcinoma.
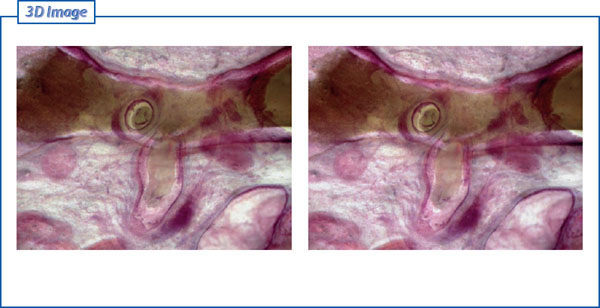
Figs. 6.6-21 & 22 Subgross, thick-section (3D) histology: higher magnification of one of the pathological ducts. Two side branches (one in cross section, the other in longitudinal section) are surrounded by a desmoplastic reaction and lymphocytic infiltration, giving the impression that this represents neoductgenesis.
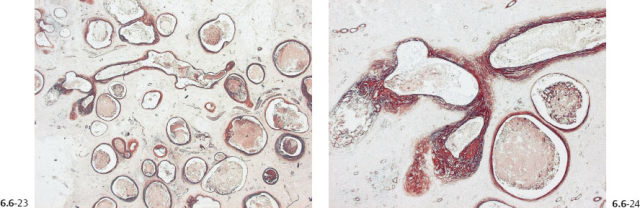
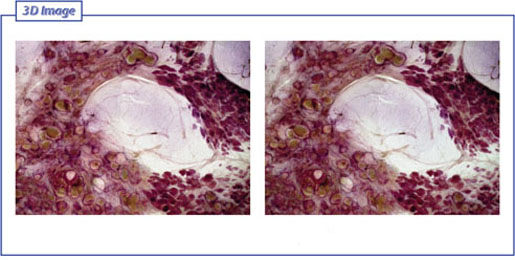
Figs. 6.6-23 & 24 Tenascin overexpression can be seen around the longitudinal duct and its branches, indicating that these are the result of neoductgenesis.
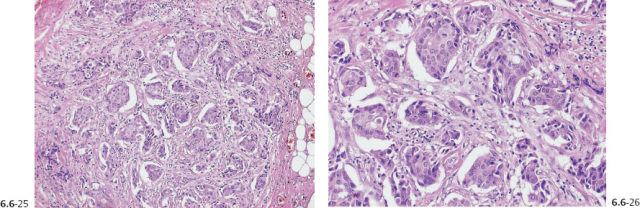
Figs. 6.6-25 & 26 Histological examination revealed an area 10 cm × 6 cm with poorly differentiated in-situ associated carcinoma with a 2 mm Grade 2 invasive cancer. These images show the invasive component.
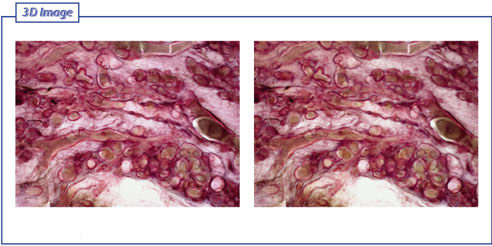
Figs. 6.6-27 & 28 Subgross, thick-section (3D) histology: Overview of the large number of contorted, cancerous ducts tightly packed over a large area.
Screening examination of a 51-year-old asymptomatic woman. She was called back for further examination because of the findings on her screening mammograms.
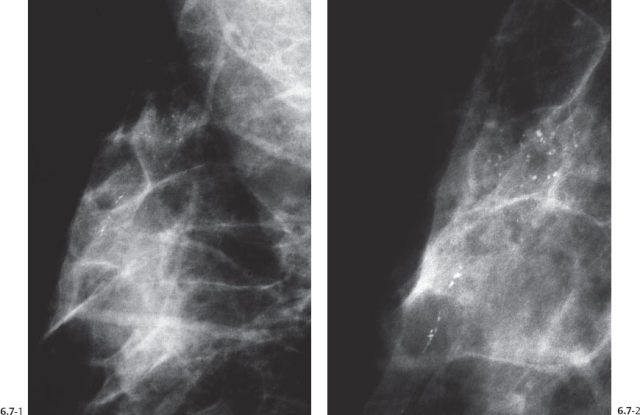
Figs. 6.7-1 & 2 Right breast, detail of MLO projection (1) and microfocus magnification (2) projection. Several groups of crushed stone–like and also casting type calcifications are seen with no associated tumor mass in the upper portion of the breast.
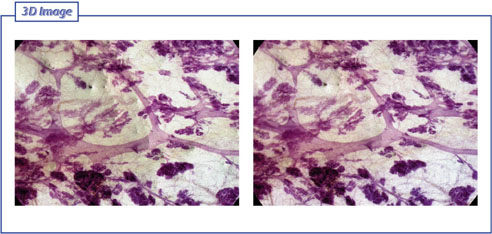
Figs. 6.7-3 & 4 Subgross, thick-section (3D) histology: normal ducts and TDLUs.
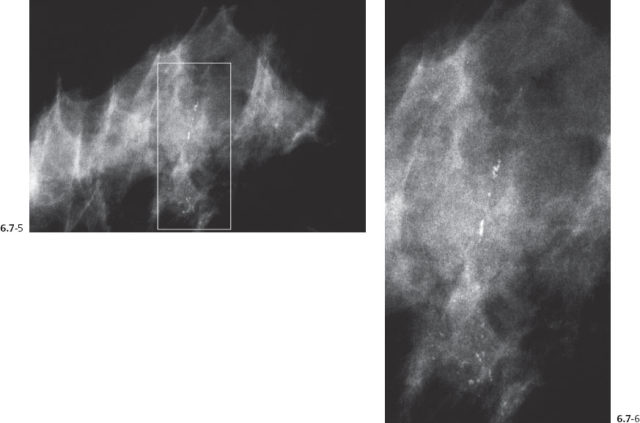
Figs. 6.7-5 & 6 Right breast, CC (5) and microfocus magnification (6) images demonstrating the malignant type calcifications.
Figs. 6.7-7 & 8 Subgross, thick-section (3D) histology: corresponding to the calcifications on the mammogram, there is an accumulation of pathological ducts (the dark area in the center of the image) surrounded by normal ducts and TDLUs, fibrosis, and adipose tissue.
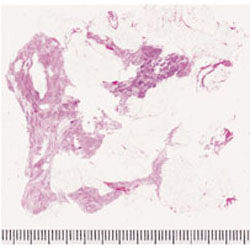
Fig. 6.7-9 Large thin-section histology (H&E): the area with the poorly differentiated DCIS measures 36 mm × 12 mm. The closest margin is 15 mm.
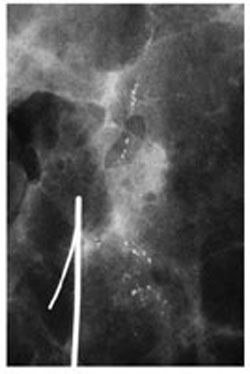
Fig. 6.7-10 Specimen radiograph. The calcifications have been surgically removed with an adequate margin.
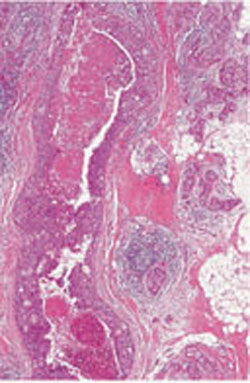
Fig. 6.7-11 Medium-power magnification of one of the cancerous ducts distended by the poorly differentiated cancer cells and central necrosis.
Figs. 6.7-12 & 13 Subgross, thick-section (3D) histology: higher magnification of the abnormal, cancerous ducts. The pathological ducts are 1–2 mm in diameter, many times the diameter of the normal ducts appearing in the background.
Figs. 6.7-14 & 15 Subgross, thick-section (3D) histology: photographs of areas with normal breast tissue, for comparison.
Figs. 6.7-16 & 17 Subgross, thick-section (3D) histology: photographs of areas with normal breast tissue and a few cystically dilated TDLUs.
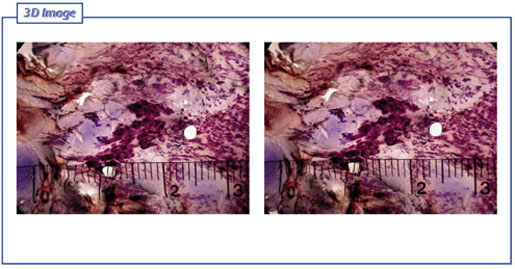
Figs. 6.7-18 & 19 Subgross, thick-section (3D) histology: higher magnification of the abnormal ducts and tumor vessels. The pathological ducts can be compared with the normal ducts in the lower right-hand corner. There is a preparation artifact (white circle).
Figs. 6.7-20 & 21 Subgross, thick-section (3D) histology: photographs of areas with normal breast tissue, for comparison.
Figs. 6.7-22 & 23 Subgross, thick-section (3D) histology: photographs of areas with normal breast tissue, for comparison.
Figs. 6.7-24 & 25 Subgross, thick-section (3D) histology: photographs of areas with the pathological ducts.
Figs. 6.7-26 & 27 Subgross, thick-section (3D) histology: photographs of areas with normal breast tissue, for comparison.
Figs. 6.7-28 & 29 Subgross, thick-section (3D) histology: photographs of areas with the pathological ducts.
Figs. 6.7-30 & 31 Subgross, thick-section (3D) histology: photographs of areas with the pathological ducts.
< div class='tao-gold-member'>
 Recognition of the Unpredictable, Often Fatal Nature of the Breast Cancer Subtype Presenting with Casting Type Calcifications on the Mammogram
 The Deviant Nature of the Breast Cancer Subtype with Castings
 The Evolution of Casting Type Calcifications
 Description of Calcifications Localized within the Ducts
 The Theory of Neoductgenesis
 Adrenal Neoplasms


