General Principles and Management


General Principles and Management


Kenneth Hu

Anthony T.C. Chan

Peter Costantino

Louis B. Harrison


EPIDEMIOLOGY

The global incidence of nasopharyngeal carcinoma (NPC) is 84,400 new cases annually with 51,600 deaths.1 It is an endemic disease in Southern China, with incidence rates of 15 to 50 per 100,000 persons, making it the third most common cancer in men.2,3,4,5 However in the West, where it is associated with risk factors that are common to other cancers of the head and neck, NPC is a rare disease.5,6 There is an intermediate incidence in populations in Alaskan Eskimos and in the Mediterranean basin.4 The incidence rate rises after age 20 years and decreases after age 60 years, with a male-female ratio of 3:1. The median age of presentation is 40 to 50 years, which is significantly younger than that of other head and neck cancers.2,4 Young adults and children comprise up to 1% of all patients. However, in non-Asian areas (e.g., Northern/Central Africa), younger patients between 10 and 20 years comprise up to 15% of cases. In the United States, there is four- to sevenfold increased risk of NPC among southern Black children compared with the Caucasian population.7,8,9,10


ETIOLOGY

Unlike squamous cell carcinomas at other sites in the head and neck, the etiology of nasopharynx carcinomas is not usually related to tobacco and alcohol use, but is multifactorial with viral, genetic, and environmental factors.3,11,12 Genetic, behavioral, and environmental cofactors are implicated as suggested from decreasing rates of cancer among successive generations of Chinese migrants to the United States and increased risk of NPC among people usually considered low risk who are born and raised in an endemic area.13,14,15 Carcinogens related to diet (salted fish high in nitrosamine), poor hygiene, poor ventilation, smoking, and use of nasal balms have been implicated.4,16 Genetic risk factors involving the HLA-A2, B-17, B246, and BW58 have been associated with increased genetic susceptibility whereas the All, B13, and B22 loci have been associated with a decreased risk.4,16 There has been a 40% drop incidence of new cases in Hong Kong from 33.1/100,000 in 1976 to 1990 to 19.5/100,000 during 1996 to 2000, pointing to the importance of environmental etiologic factors.3 For nonendemic cases, traditional risk factors such as smoking and alcohol have been identified.17,18

Viral etiology has clearly been implicated in the majority of nasopharynx cancers. For endemic undifferentiated NPC, there is a strong association with Epstein-Barr virus (EBV), a human B-lymphotropic herpesvirus that is implicated in a variety of tumors,19 and it is proposed that EBV plays a key role in NPC pathogenesis as EBV is consistently detected even in the earliest NPC lesions (severe dysplasia and CIS) with clonal viral genomes and latent-membrane-protein (LMP 1 oncoprotein) expression,20 whereas EBV infection is not detected in normal nasopharyngeal epithelium.21

EBV is more commonly associated with WHO type II/III, where as a smaller proportion of type I is EBV associated. Conversely, there is a growing recognition that type I has a greater association with HPV compared with type II/III.22 HPV-associated nasopharynx carcinoma were found to involve tumors that extended to the oropharynx and postulated to represent primary oropharynx tumors. In this study, p16 was positive in all HPV (n = 3) positive NPCs but none of the EBV-associated nasopharynx cancers (n = 34) and felt to be an important molecular tool to differentiate between an HPV- versus EBV-driven tumor.23

As early detection of NPC may be crucial to achieve better outcome of patients, serological markers have been developed taking advantage of the presence of EBV in the tumor. Tumor markers may be useful for early detection, diagnosis, prognostication and monitoring of treatment response. All serological markers of NPC have been based on the detection of antibodies to EBV24 or on the detection of EBV genetic materials.25,26 These markers may not be applicable to the patients with WHO type I well-differentiated squamous cell carcinoma. Immunoglobulin A (IgA) antibody titres to the viral capsid antigen of EBV has been widely used as a marker with a sensitivity of 80% to 90%.24,27,28


The detection of plasma tumor-associated EBV DNA using polymerase chain reaction assays has opened up new possibilities in the detection and management of nasopharynx cancer. Lo was the first to quantitate plasma levels of EBV DNA using a PCR technique and detected EBV DNA in the plasma of 96% (55/57) with nasopharynx cancer versus 7% of control patients (3/43).25 Plasma EBV DNA correlates with tumor staging, survival, and recurrence.25,29,30 It has a diagnostic sensitivity of 96% and specificity of 93%.25,31 A recent publication demonstrated that the combined interpretation of EBV DNA with UICC staging improved risk discrimination in early-stage disease.32

Pretreatment levels are associated with tumor volume33 with prognostic implications beyond anatomic staging32 and elevated posttreatment EBV DNA levels associated with higher risk for recurrence, distant metastasis, and poorer disease-free and overall survival whereas clearance of EBV DNA to undetectable or low posttreatment levels are associated with clinical remission.29,32,33,34,35 Several groups have shown that patients can be stratified by pre- and posttreatment EBV levels into distinct survival groups with posttreatment EBV plasma levels as the major factor impacting on survival. For patients with undetectable posttreatment plasma EBV, a high pretreatment level prognosed a worse overall (87% vs. 71%) and relapse-free survival (86% vs. 76%) compared with low pretreatment levels.36

Harmonization of the plasma EBV DNA assay is crucial before it is accepted for routine clinical use as there are varying sensitivities of the assay depending on the part of the EBV viral genome that is detected. Most commonly the BamHl-W assay yields the highest concentrations due to multiple copies of this in different EBV genomes compared with single copy of other genes that have been tested including EBNA01, polymerase-1, or latent membrane protein-2. Even with the same target and assay conditions, the concentration can vary significantly and there is also a high degradation rate that depends on the age of the blood specimen.36 The RTOG is attempting to standardize the assay prior to proceeding to use it as a stratification factor for adjuvant treatment.


GROSS AND MICROSCOPIC ANATOMY


Gross Anatomy

The nasopharynx is a cuboidal cavity located behind the choanae of the nasal cavity (Fig. 22-1). It is composed of two lateral walls with a roof which slopes downward toward the posterior pharyngeal wall down to the level of the uvula. The soft palate forms the floor. Behind the roof and posterior pharyngeal wall are the clivus composed of the basisphenoid, basiocciput, and anterior arch of the atlas. In the lower part of the lateral wall, the superior constrictor muscle sends its fibers posteriorly to attach to the basisphenoid. Between the upper border of the superior constrictor muscle and the skull base is the pharyngobasilar fascia with the Eustachian tube lodged between the medial pterygoid plate and the superior constrictor muscle. The posterior lip of the opening of the Eustachian tube is the torus tubarius behind which is a mucosal fold called the fossa of Rosenmüller. The cartilaginous part of the Eustachian tube enters the lateral pharyngeal wall through a muscle opening called the sinus of Morgagni. This serves as an easy source of entry/exit for nasopharynx cancer.

The nasopharyngeal lymphoid tissue or adenoid is concentrated in the nasopharyngeal roof and other lymphoid aggregates exist about the tubal openings. Adenoidal tissue in the pharyngeal bursa along the roof can result in inflammation or Thornwald cyst formation. The sensory nerve supply to the postnasal space is provided by the glossopharyngeal and the maxillary nerves. Multiple foramina are adjacent to the nasopharynx including the foramen lacerum at the roof with fibrocartilage that is a minimal barrier of entry into the middle cranial fossa for cancer, the foramens juglare, the ovale and the spinosum as well as the carotid and the hypoglossal canals.


Microscopic

The epithelial lining of the nasopharynx is composed of three basic cell types with a pseudostratified columnar epithelium predominant at birth, a squamous cell type present in adulthood as well as an intermediate pseudostratified cuboidal type which exists in the transition zones between the first two. In the adult, the squamous cell type comprises 60% of the lining of the anterior wall and 80% to 90% of the posterior wall whereas the respiratory type comprises one-third of the anterior wall, 15% to 20% of the posterior wall and about half the area of the lateral walls.4 The intermediate epithelium is most susceptible to oncogenesis as the areas of the nasopharynx where cancers originate correspond to the same areas that have the greatest amount of the intermediate type. The most common sites of origin are the lateral walls including the fossa of Rosenmüller, the posterior wall, and the anterior walls in descending order.4


PATHOLOGY


Classification and Histology of NPC

Diagnosis. Tumors arise from the nasopharyngeal epithelium and may present as frank tumor with ulceration or as occult submucosal lesions. Diagnosis is made by pathologic confirmation usually by biopsy. Biopsy may show solid sheets, irregular islands, dyscohesive sheet, and trabeculae of tumor with interspersed lymphocytes and plasmas cells.5 Undifferentiated subtype is characterized by syncitial appearing large tumor cells with scant cytoplasm and indistinct borders, round to oval vesicular nuclei, and large central nucleoli. Differentiated subtype shows cellular stratification and pavementing with plexiform growth similar to transitional cell carcinomas with less prominent nucleoli.

Immuhohistochemistry shows virtually all tumor cells staining strongly for pan-cytokeratin (AE1/AE3) and high-molecularweight cytokeratins.5 Nearly all nonkeratinizing tumors, including differentiated and undifferentiated subtypes, will show EBV viral infection, best detected by in situ hybridization for EBV encoded early RNA localized in the nuclei of tumor cells.

Fine-needle aspiration (FNA) of a neck node showing clusters of cohesive tumor cells with vesicular nuclei and prominent nucleoli that is cytokeratin positive and leukocyte common antigen (LCA) negative can detect an occult nasopharyngeal primary or residual/recurrent disease.37 Fine-needle aspiration has a diagnostic sensitivity of 70% to 90%.5 Cytologic examination of nodes shows a background of lymphocytes and plasma cells with irregular clusters of large cells with overlapping vesicular nuclei and large nucleoli. The diagnosis is confirmed by in situ hybridization for EBV and immunostaining for cytokeratins, which rules out a diagnosis of lymphoma.

Classification. According to the World Health Organization (WHO) classification of head and neck carcinomas, NPCs encompass (keratinizing) squamous cell carcinoma, nonkeratinizing carcinomas, and basaloid squamous cell carcinoma.38 Prior designations for these tumor types are no longer used and included WHO I for squamous cell carcinomas, WHO II for nonkeratinizing carcinoma (also previously referred to as transitional cell carcinoma), and WHO III for undifferentiated carcinoma; the latter also previously referred to as lymphoepithelioma, Schminke-type lymphoepithelioma, and Regaud-type lymphoepithelioma.38


FIGURE 22-1. Anatomy of head and neck region and location of the nasopharynx.

The squamous cell carcinomas include well-, moderately and poorly differentiated carcinomas. Keratinizing carcinomas comprises <0.3% in southern China and about 3% in Hong Kong2,3 but about 25% of all NPC in North America and has a conventional keratinization pattern with intercellular bridges, squamous pearls and graded as well, moderately, or poorly differentiated. It is associated with a desmoplastic response due to invasive growth.5 It rarely occurs in patient younger than 40 years. These carcinomas are not associated with EBV.38

The category of nonkeratinizing carcinomas is subdivided into differentiated and undifferentiated types. The nonkeratinizing carcinoma, differentiated type shows little to absent keratinization and typically lacks a desmoplastic response. It represents about 12% of all NPCs both in Hong Kong and in North America5,39 and has a growth pattern similar to transitional carcinoma of the bladder with stratified cells well-delineated from the surrounding stroma. Growth may be papillary or plexiform. This tumor type may show prominent cystic degeneration with associated necrosis, and such lesions may metastasize to the cervical neck as cystic metastatic carcinoma. The nonkeratinizing carcinoma, differentiated type, is associated with EBV.38


The nonkeratinizing carcinoma, undifferentiated type represents 60% of all NPC in adults and is the most frequent type in the pediatric population. The cells of undifferentiated carcinoma have prominent eosinophilic nucleoli with dispersed to vesicularappearing nuclear chromatin and a round nucleus often with prominent eospinophilic nucleoli.5 In contrast to the other NPC types, the cell margins of this carcinoma are often indistinct creating a syncitial growth pattern. A prominent benign lymphoid component is usually present, and despite invasive growth there is often an absence of a desmoplatic response. As such, in the face of a prominent lymphoid cell proliferation that may overrun the neoplastic cells and the absence of a desmoplastic response, it may be difficult by histologic evaluation to identify the presence of invasive carcinoma. In this setting, the use of cytokeratin staining will greatly facilitate the identification of the malignant cells. Furthermore, the cytomorphologic features of the neoplastic cells as well as the tendency to grow in a dyscohesive manner may result in diagnostic confusion with a non-Hodgkin’s malignant lymphoma. Since the neoplastic cells are of epithelial origin, they will be immunoreactive for epithelial markers (e.g., cytokeratins) and negative for lymphoid markers (e.g., leucocyte common antigen, others). The nonkeratinizing carcinoma, undifferentiated type can have a syncitial growth with cohesive cells (Regaud type) or a diffuse cellular infiltrate with independent, dyscohesive cells (Schmincke type). The growth characteristics of a given neoplasm has no bearing on the diagnosis, therapy, or prognosis of these neoplasms, and these two have no distinctly different clinical behavior compared with each other.5 The nonkeratinizing carcinoma, undifferentiated type is highly associated with EBV.38

All three histologic types stain positive for cytokeratin and negative for leukocyte common antigen. Also, these three types may overlap with each other in up to 26% of cases40 but the tumor will be classified according to the dominant component.

The categories have distinct clinical implications.40 Undifferentiated NPC has a predilection for dissemination to regional nodes and distant sites and are radioresponsive. The keratinizing squamous cell carcinomas behave like those in other head and neck sites, typically occurring in patients 40 years or older and associated with a smoking/drinking history.6 Nasopharyngeal squamous cell carcinomas tend to present with more locally advanced primary tumors with fewer involved nodes and metastases than the nasopharyngeal nonkeratinizing carcinomas but with increased radioresistance compared with the other two.40,41,42,43,44 Overall survival is lower for patients with nasopharyngeal squamous cell carcinomas compared with those with nasopharyngeal nonkeratinizing carcinoma, undifferentiated type.40,45,46,47 Five-year disease-free survival is reported to be 15% to 42% lower with squamous cell carcinoma versus nonkeratinizing carcinoma, undifferentiated type.41,43,48 The nonkeratinizing carcinoma, differentiated type is clinically more similar to nonkeratinizing carcinoma, undifferentiated type than to squamous cell carcinoma and are associated with elevated EBV serology.49

Basaloid squamous cell carcinoma, a high-grade variant of squamous cell carcinoma, can rarely occur as primary tumor of the nasopharynx. It is morphologically identical to the same tumor more commonly occurring in other head and neck sites, such as the hypopharynx (pyriform sinus) and larynx. Histologically, the tumor is infiltrative composed of lobules, festoons, trabeculae, and solid foci of pleomorphic, mitotically active basaloid cells with pale-staining nuclei, interspersed with variable amounts of mucoid matrix or hyaline material. Comedo necrosis is common. Neurotropism is often identified. An identifiable squamous cell carcinoma, either in the form of invasive carcinoma or in situ, is often identified but may be absent. When present, it usually is limited in extent and represents a minor component in this carcinoma. Immunohistochemical staining is consistently reactive for epithelial markers including cytokeratins (AE1/AE3, CAM5.2, CK903, others) and epithelial membrane antigen. Neuroendocrine markers, including chromogranin and synaptophysin, are typically absent but in rare case may be positive. Melanocytic markers are negative.

Carcinomas histologically similar to nasopharyngeal nonkeratinizing carcinomas, differentiated and undifferentiated types, have been found in other head and neck sites including the oropharynx, the Waldeyer ring,50 the larynx,51 the thymus,52 and the major salivary glands.53 These “lymphoepithelial carcinomas” are infrequent (e.g., <5% of base of tongue and tonsil carcinomas), but their biologic behavior and response to treatment qualifies them further as carcinomas of nasopharyngeal type. The role of EBV in some of these carcinomas is strongly suggested by serologic profiles, presence of EBV-associated nuclear antigen in the carcinoma cells, and by high levels of viral genomes in the DNA.


Signs and Symptoms

Patterns of Spread and Clinical Presentation. NPC, especially of the WHO types II and III, usually arises in the region of the fossa of Rosenmüller.4 The primary tumor may extend anteriorly into the nasal cavity, superiorly into the floor of the sphenoid sinus, anterosuperiorly into the posterior ethmoid air cells and the orbits, laterally into the parapharyngeal space and the pterygoid muscles, superiorly into the foramen lacerum and the sphenopalatine fossa, and inferiorly into the oropharynx (Fig. 22-2).38 Tumor extension through the fibrocartilage of the foramen lacerum enables direct entry into the cavernous sinus and the middle cranial fossa, resulting in cranial neuropathy including diplopia due to involvement of cranial nerve VI as well as facial pain and paresthesias due to infiltration of the branches of cranial nerve V. Involvement of cranial nerves III and IV indicates more advanced disease along the cavernous sinus (Fig. 22-3). Tumor extension into the parapharyngeal space and involve cranial nerves IX, X, and XI, thus producing a jugular foramen syndrome.

First echelon lymphatic spread most commonly involves the superior jugular, the retropharyngeal, and the posterior cervical chain nodes.38 Ninety percent of patients will have clinical evidence of unilateral nodal involvement whereas 50 % will have bilateral lymphadenopathy. Involvement of the upper jugular and the posterior chain nodes are usually painless unless very large. However, retropharyngeal lymph node metastasis, when extensive, produces a characteristic syndrome of pain referred to the ipsilateral neck, ear, head, forehead, and the orbit. It may be associated with a stiff neck or pain upon neck flexion.

Patients most commonly present with a painless neck mass in more than one-third, whereas other common manifestations including hearing loss or ear drainage in about one-quarter and nasal bleeding or obstruction. Nasal symptoms including breathing obstruction, epistaxis, and discharge can occur. A small proportion of patients may present with cranial nerve deficit, most commonly involving the cranial nerves VI and V (V2 most commonly). Patients may also present with facial pain, headaches, or neck discomfort. Proptosis will occur when cancer invades through the posterior portion of the orbit. Trismus is an indication of the pterygoid muscle invasion.

Physical examination includes inspection of the nasopharynx, either indirectly with a mirror or preferably by direct visualization through a fiberoptic endoscope. The tumor usually appears as an asymmetric mass with telangiectasia on its friable surface and is centered in the fossa of Rosenmüller. Depending on the size of the primary tumor, distortion of the soft palate can occur. Straw-colored serous otitis media is usually unilateral. The earliest signs of cranial nerve involvement are usually extraocular muscle dysfunction, especially lateral rectus palsy, and signs of trigeminal nerve involvement such as hyperesthesia and atrophy of masticatory muscles.


FIGURE 22-2. Patterns of spread in sagittal and coronal views. Potential areas of spread include superiorly into the sphenoid sinus/clivus, anteriorly into the nasal cavity/maxillary sinus, posteriorly into the prevertebral muscles and prepontine cistern as well inferiorly into the oropharynx. Note proximity of the brain stem, the spinal cord, and the visual pathways as well as the superior and the middle constrictor muscles. Lymphatic spread to the jugular and the retropharyngeal nodes is common.

For patients in whom the tumor in the nasopharynx is clinically obvious, biopsy can usually be done under the topical anesthetic by topical anesthetic applications through the nasal cavity. Sometimes, however, no primary lesion is evident in the nasopharynx but NPC is suspected on the basis of the presence and location of the cervical lymph nodes. In such cases, fine-needle aspiration cytology will usually establish whether the cell type is consistent with NPC.37 Usually, clusters of cohesive tumor cells with vesicular nuclei and prominent nucleoli that stain for cytokeratin are present. If it is, radiologic assessment of the nasopharynx may indicate a target lesion for biopsy at examination under anesthesia. If not, a core biopsy of an involved node will provide tissue for fluorescent in situ hybridization (FISH) analysis to detect EBV viral genome constituents in the neoplastic cells, which is sufficient to establish the diagnosis of NPC.


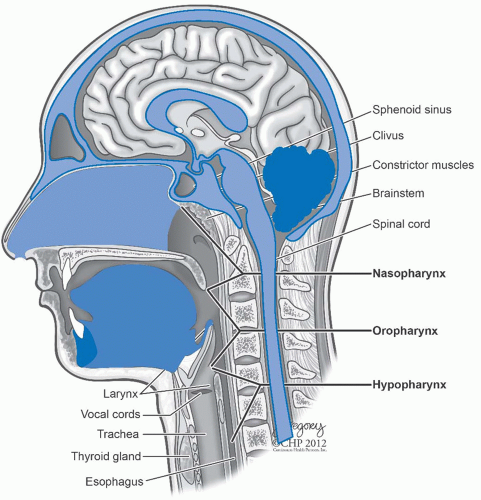
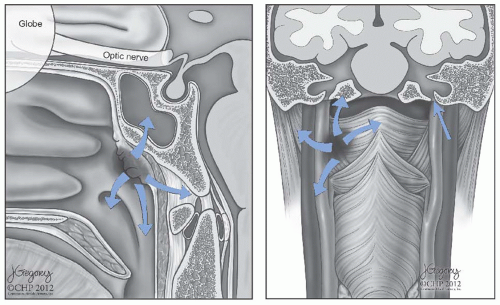
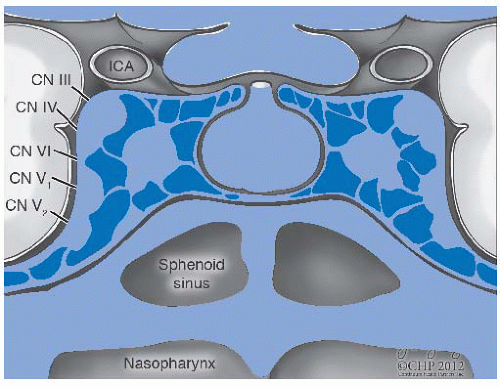
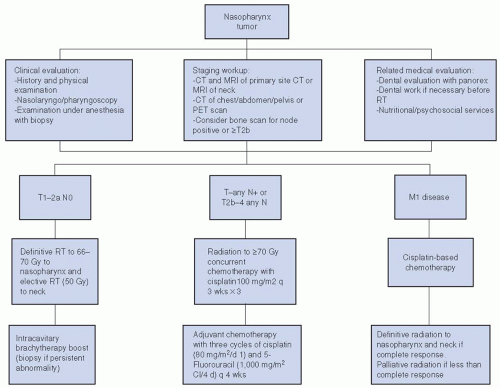
FIGURE 22-3. Anatomy of the cavernous sinus showing position of the cranial nerves in relationship to the nasopharynx. Cranial nerve V2 and V1 are in closest proximity to the skull base, while involvement of cranial nerve III and IV indicate advanced involvement of the cavernous sinus.


CLINICAL EVALUATION AND STAGING

Clinical staging begins with examination by indirect mirror exam and direct endoscopy of the nasopharynx, particularly the fossa of Rosenmiiller, and the roof as well as areas of potential spread including the nasal cavity and the oropharynx (Fig. 22-4). Inspection of the posterior pharyngeal wall may reveal bulging suggestive of bulky retropharyngeal nodes. Palpation of the neck nodes is essential especially of the posterior cervical and the upper jugular nodes. Neurologic examination of all cranial nerves is required.

Radiologic examination of the nasopharynx, its surrounding soft tissue, cavities, osseous structures, and lymphatics requires computed tomography (CT) evaluation of the face, the paranasal sinuses, the skull base, and the neck. CT provides excellent evaluation of the draining nodal basins as well as detection of bone invasion of the floor of the sphenoid sinus, the adjacent middle cranial fossa, the clivus, and the pterygoid plates. It provides good soft tissue delineation of tumor
extension through the foramen lacerum into the middle cranial fossa, laterally into the parapharyngeal space, anteriorly into the nasal cavity and the maxillary sinuses, inferiorly into the oropharynx, and anterolaterally into the ethmoids and the orbit. Magnetic resonance imaging (MRI) allows superior soft tissue delineation of tumor involvement into the sinuses where it can discriminate between mucus secretions and tumor, as well as evaluate intracranial extension of the prepontine area, the cavernous sinus, and the Meckel cave. MRI can also detect infiltration of the clivus more accurately than CT.54 It is also useful in the tracking of perineural spread to the skull base foramina and the pterygopalatine fossa area. Moreover, MRI offers superior multiplanar imaging in identifying the course of spread. Evaluation of the jugular chain, the posterior cervical, and the retropharyngeal nodes is crucial given the propensity of early nodal involvement. CT of the neck with contrast is usually the primary imaging modality that is important; however, PET imaging is complementary.


FIGURE 22-4. Algorithm for the workup and management of nasopharynx cancer.

The majority of patients with NPC present with locoregionally advanced disease, and at least one-fifth will have occult distant metastases (DM).55,56 Sites of predilection for metastatic spread most commonly include in order of greatest frequency: bone, the lung, and the liver.


Staging

The current staging system is the seventh edition of the American Joint Committee on Cancer57 and represents the outcome of an evolution of 20 different systems and an international consensus of different staging systems used by the International Union Against Cancer (UICC) system and the AJCC and that used in Southeast Asia according to Ho as well as prognostic factors culled from clinical data from the Asian databases, primarily from Hong Kong.58 The seventh edition has led to modifications from the sixth edition in both T and N staging. Most importantly, for early-stage tumors, those involving the oropharynx or the nasal cavity have been down staged from T2a to T1. Regarding nodal staging, the presence of unilateral or bilateral retropharyngeal nodes <6 cm are classified as N1. Thus, stage T2aN0 (IIa) patients from the sixth edition are now stage I whereas T2bN0-1 (AJCC stage IIB) are now stage II (T2N0-1). The sixth edition and fifth editions are identical with regard to nasopharynx staging. A comparison of the fourth (1992) versus sixth (2002) edition of the American Joint Committee on Cancer staging is shown below59 (Table 22.1). It incorporates the importance of parapharyngeal extension especially in the T2 group as well as a nodal staging system that is distinct from that of other head and neck tumor
sites. Also of importance is that the sixth edition downstages N1 patients from stage III in the fourth edition to stage IIb, which is relevant in evaluating the Intergroup 0099 study which enrolled AJCC fourth edition stage III/IV patients.60


TABLE 22.1 Comparison of the 6th and 7th American Joint Committee on Cancer (AJCC) Staging Systems


T Stage


AJCC 7th edition (2010)


AJCC 6th edition (2002)


T1: Tumor involving nasopharynx with or without extension into oropharynx or nasal cavity


Tumor confined to nasopharynx


T2: Tumor involving soft tissue with parapharyngeal extension


T2a: Tumor involving oropharynx or nasal cavity


T2b: Tumor involving parapharyngeal space


T3: Tumor involves bony structures and/or paranasal sinuses.


Same


T4: Tumor with intracranial extension or involvement of the cranial nerves, infratemporal fossa, hypopharynx, orbit or masticator space.


Same


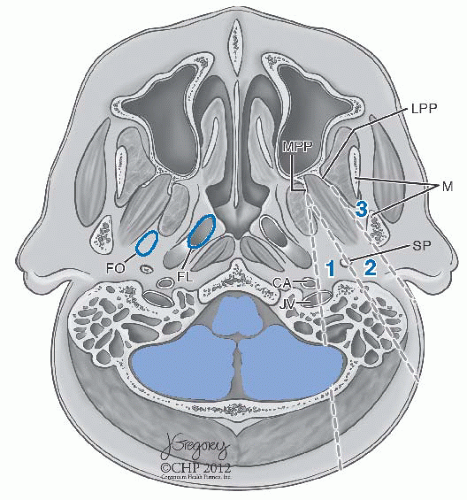
Parapharyngeal involvement is defined as the posterolateral spread of tumor beyond pharyngobasilar fascia. This corresponds to the line drawn from the medial pterygoid plate to the lateral aspect of the carotid artery. Tumor spread beyond the anterior surface of the lateral pterygoid muscle, lateral extension beyond the posterolateral wall of the maxillary antrum or involvement of the pterygopalatine fissure defines masticator space invasion.


7th Edition Nodal:


Regional Nodal staging is unique for nasopharynx cancers compared to other head and neck squamous cell cancers:


N1: Unilateral nodes up to 6 cm or less in greatest dimension without supraclavicular fossa involvement. Unilateral or bilateral retropharyngeal nodes up to 6 cm.


N2: Bilateral nodes up to 6 cm or less in greatest dimension without supraclavicular fossa involvement.


N3: Nodes >6 cm or involvement of the supraclavicular fossa.


N3a: >6 cm


N3b: Extension to the supraclavicular fossa.


The supraclavicular fossa is a 3-point area outlined as Ho’s triangle: 1) superior margin of the sternal end of the clavicle, 2) superior margin of the lateral end of the clavicle and 3) point where neck meets shoulder.


6th Edition Nodal Staging is the same as 7th edition except retropharyngeal nodes not specified.


7th Edition Staging:


0


Tis


N0


M0


I


T1


N0


M0


II


T1


N1


M0


T2


N0-1


M0


III


T1


N2


M0


T2


N2


M0


T3


N0-2


M0


IVa


T4


N0-2


M0


IVb


Any N3


M0


IVc


Any M1


6th Edition Staging:


0


Tis


N0


M0


I


T1


N0


M0


IIA


T2a


N0


M0


IIB


T1


N1


M0


T2a


N1


M0


T2b


N0-1


M0


III


T1


N2


M0


T2a/b


N2


M0


T3


N1-2


M0


IVa


T4


N0-2


M0


IVb


Any N3


M0


IVc


Any M1


Source: From American Joint Committee on Cancer (AJCC). Cancer Stastaging Manual. 6th ed. New York, NY: Springer-Verlag; 2002; 7th ed., 2010, with permission.


Teo reported that parapharyngeal extension is the strongest independent prognosticator for distant metastasis and survival in 903 NPC patients in patients without cervical nodal disease or skull base/cranial nerve palsy.61 Chua further detailed that the extent of parapharyngeal extension impacted both on local control (LC) and distant metastasis in 364 patients.62 The incidence of parapharyngeal extension was 73 % and degree of extension subgrouped into grade 1 (poststyloid), grade 2 (prestyloid), and grade 3 (masticator space) (Fig. 22-5). Patients with no or grade 1 extension had better 5-year LC (87% vs. 72%, p < 0.0001) and lower 5-year distant metastasis (13% vs. 32%, p = 0.0002) compared with those with grade 2/3 extension, respectively. The increased risk for local failure with advanced parapharyngeal extension was seen in T2 but not in T3 patients. The increased risk for distant metastasis with advanced parapharyngeal involvement was independent of nodal status and was independently prognostic in N2 and N3 patients.


Clinical Prognostic Factors

Early stage, female gender, nonkeratinizing histology, and younger age predict a more favorable outcome.16,40 Patients with haplotype Aw33-C3-B58/DR3 have a poorer prognosis compared with those with A2-Cw-11Bw46/DR9.4,16 Staging with MRI predicts a better outcome given the improved tumor delineation.63 Tumor volume based on CT showed an independent prognostic factor of treatment outcome beyond the Ho staging system, but a small study showed the tumor volume derived from MRI was not.64,65 Serum LDH was predicted for DM in two studies.54,66 Serum EBV markers are clearly an important predictive and prognostic factors that are to be explored to tailor management in upcoming trials (see “Etiology”).


FIGURE 22-5. Schematic diagram outline the grading of parapharyngeal extension by nasopharyngeal carcinoma. Grade 1: extension into the retrostyloid space as it invades past the line between the medial pterygoid plate (MPP) to the internal jugular vein (JV), Grade 2: extension in to the prestyloid space at it extends past the line between the medial pterygoid plate and the styloid process (SP) and Grade 3: extension into the masticator space as delineated by extension beyond the line between the lateral pterygoid plate (LPP) and the posteromedial margin of the ascending ramus of the mandible (M).


MANAGEMENT STRATEGIES

NPC is a highly radiosensitive head and neck cancer that can be treated effectively with radiation therapy (Fig. 22-4). Radiation therapy has been the mainstay treatment as it is able to cover the large areas of potential locoregional spread in a comprehensive manner. Nasopharynx cancers are located in a highly enriched lymphatic drainage area that favors early regional spread to the retropharyngeal and cervical nodes both unilaterally and bilaterally. The primary tumor exists in an occult location with a strong inclination to invade the skull base, surrounding sinuses, nerves, and soft tissue spaces before presenting clinically. Advances in radiation delivery, imaging, integration of chemotherapy, standardization of an internationally agreed upon staging system, improvement of multidisciplinary care as well as increased scientific exchange have led to significant advances in tumor control and quality of life (QOL).

In general, patients with early-stage tumors are amenable to treatment with radiation therapy alone with high rates of locoregional control, whereas those with T3/T4 lesions or significant nodal disease require more intensive treatment as outcomes with radiation therapy alone lead to higher rates of locoregional failure and DM. For the latter group, multiple large trials testing the addition of chemotherapy either sequentially concurrently or both with radiation therapy have been evaluated. Dose escalation and improved conformality of radiation therapy using a wide variety of techniques appear to improve outcomes. Altered fractionation has been explored as well as new biologic agents. For patients with recurrence after standard radiation, the role of surgical salvage and reirradiation have been explored.


Patterns of Failure

Patterns of spread include invasion into adjacent soft tissues, paranasal sinuses, skull base as well as spreading intracranially (Fig. 22-2).38 Potential areas of microscopic spread include the sphenoid sinus, the foramen ovale and the petrous tip, the posterior third of the nasal cavity/the maxillary sinus, the clivus, and the parapharyngeal space/the pterygoid fossa. Critical normal structures which are adjacent to the target volume and with tolerance doses that must be respected include the brain stem, the spinal cord, the optic nerve, the chiasm, the lens, the temporomandibular joints (TMJs), the cochlea, the vestibulocochlear nerves, the oral mucosa, and the external auditory canal. Most common sites of primary tumor spread based on MRI imaging of 308 patients have been reported (Table 22.2).38


Radiation Technique

Radiation treatment of nasopharynx cancer is technically challenging due to the proximity of tumors to critical structures including the spinal cord, the brain stem, the temporal lobes, the optic pathways as well as structures important for QOL and function such as the masticatory/the constrictor muscles, the temporomandibular joint, the salivary glands, and the auditory nerves. These tumors often wrap around the brain stem in a
concave manner as they spread into the parapharyngeal space, as well as intracranially through the skull base, the foramina, and along the nerves. As such, they may extend too close to critical adjacent structures for an adequate tumoricidal dose to be delivered depending on the treatment technique.


TABLE 22.2 Percentage Incidence of Involvement of 308 Nasopharynx Patients on MRI Imaging


Adjacent Soft Tissues


%


Bony Erosion/Paranasal Sinus


%


Intracranial/Orbital Extension


%


Nasal Cavity


87%


Clivus


41%


Cavernous sinus


16%


Parapharyngeal space


68%


Sphenoid sinus, foramina lacerum, ovale, rotundum


38%


Cerebrum, meninges


4%


Pterygoid muscle


48%


Pterygoid plate, pterygomaxillary fissure, pterygopalatine fossa


27%


Orbit, orbital fissure


4%


Oropharynx


21%


Petrous bone


19%


Pituitary fossa


3%


Prevertebral muscle


19%


Ethmoid sinus


6%


Infratemporal fossa


9%


Maxillary antrum


4%


Nasal septum


3%


Jugular foramen, hypoglossal canal


4%


Source: Chan JKC, Bray F, McCarron P. World Health Organization of tumours. Nasopharyngeal carcinoma. In: Eveson JE, Barnes L, Reichart P, et al., eds. Pathology and Genetics of Head and Neck Tumors. Lyon, France: IARC Press; 2005:87-99, with permission.


Radiation therapy treatment has improved vastly from the initial use of orthovoltage/radium sources, block-shaped beams, and plain film-based imaging with large setup uncertainty, to high-energy linear accelerator with dynamic leaf collimation and more sophisticated CT-based treatment planning with precise setup and immobilization.67 The evolution in treatment planning has provided for better targeted radiation delivery and dose escalation from 50-60 to 80 Gy.68,69,70

For many years, two-dimensional (2D) technique had been the mainstay of treatment and continues to remain so for many centers with good LC for early-stage cancers.67,71 Traditional 2D treatment planning involves parallel opposed lateral fields and a low anterior neck field. After an initial phase in which the brain stem and the cord are in the treatment field, shielding of these structures is required to maintain the dose within tolerance, potentially compromising dose to areas of tumor that extend to the skull base, the parapharyngeal area, or intracranially. Simultaneously, normal structures such as the parotids and the constrictor muscles are unavoidably treated with high doses.72,73 In addition, 2D technique does not account for tissue inhomogeneities that exist in the paranasopharyngeal area including the air cavities, multiple bony interfaces and variation in contour, and head and neck separation.74

Incorporation of volumetric imaging for treatment planning is crucial for improved dosimetry. Jian reported that the use of CT for 2D treatment planning was critically important to define an adequate clival margin, which was one of the most important factors for locoregional control in patients treated with radiation.75 Since the 1990s, technologic advances in treatment planning systems incorporating CT have led to the development of conformal therapies such as three-dimensional conformal therapy (3D CRT)74 and intensity-modulated radiation therapy (IMRT), which have enhanced dose conformality, improved dose homogeneity, permit dose escalation while simultaneously decreasing dose to normal tissue to lessen chronic toxicities.76,77,78

3D-CRT exploits the spatial relationship between tumor and normal tissue by manual selection of beam angle with a beam eye’s view and through an iterative process of beam weighting with correction of tissue inhomogeneities to achieve optimization. It has been estimated that 3D-CRT can increase the mean tumor dose by >10% and potentially increasing tumor control probability by 15% without added normal tissue complications.74

IMRT represents a major advance beyond 3D-CRT, adding an extra degree of freedom to treatment planning by modulating the dose intensity within each beam to generate virtually any shape of dose distribution. Instead of manually changing beam weighting and angles as with 3D-CRT, the IMRT planner sets the dose to the target volumes, assigns normal tissue penalties/constraints, and selects the number of beams/beam angles at the outset for delineated structures, before an inverse treatment planning system attempts to satisfy these criteria through a leastsquares, cost-function optimization process.78,79,80 Adjustments of the number of beams/constraints/penalties refine the plan further. Dose gradients of 5 % per millimeter can be achieved with a dose uniformity of 10% or less within the PTV.79

A crucial component toward achieving the maximal therapeutic benefit from conformal therapy is accurate delineation of the tumor volumes and adjacent critical structures. The appropriate dose and treatment margin to cure the tumor must be weighed against the potential to cause permanent toxicity. It requires not only precise visualization of gross tumor based on clinical and radiologic evaluation, but also a comprehensive understanding of potential areas of spread locally and regionally. If too precise, the probability of a geographic miss of occult disease increase which may be further magnified if small errors in reproducing patient setup occur. Thus, high-resolution imaging becomes a prerequisite toward achieving that goal. The latter should include both transverse and coronal CT cuts. Fusion with MRI or PET/CT as well as viewing in coronal and axial planes to accurately follow tumor spread three dimensionally is crucial.


Dose Prescription

The standard radiation dose prescribed to the primary site in nasopharyngeal cancer in most centers is an equivalent of 70 Gy over 7 weeks. Doses of 66 to 70 Gy are given to involved nodes, and clinically uninvolved nodes typically receive 50 Gy in 5 weeks whereas intermediate risk areas for subclinical disease receive 60 Gy. With IMRT, dose painting is possible in which differential doses to various target volumes are delivered simultaneously. Typically, higher doses per fraction (212-220 cGy/fraction) are delivered to areas of gross disease are delivered while lower dose (180 cGy/fraction) are delivered for areas at risk for occult disease.76,81,82


Kam demonstrated that superiority of IMRT-based plans compared with 3D-CRT and 2D technique of Ho in three different but common clinical stages: early stage (T1N0), a tumor with parapharyngeal extension and significant nodal disease (T2bN2), and a tumor with intracranial extension T4N2.81 All patients were treated to a final prescription dose of 66 Gy with standard dose constraints to the normal tissue. CTV included potential sites of microscopic disease as described above and GTV with at least 1-cm margin except a 5-mm posterior margin. A 3-mm margin was added to the CTV for the PTV. A total of 66 Gy in 33 fractions was prescribed to the gross volume whereas 60 Gy in 33 fractions was prescribed to cover areas at high risk for microscopic disease. In the Ho technique, the initial phase to 40 Gy is composed of opposed laterals with a low anterior neck, followed by a cone down to the primary with the addition of an anterior field to the opposed laterals with blocking of the pituitary, the optic nerve, and the tongue. The 3D technique comprised initial opposed laterals to 40 Gy, followed by six to eight coplanar beams as a 3D cone down. The IMRT plan consisted of seven coplanar beams. In the dosimetric comparison of the three techniques for the early-stage (T1N0) scenario, IMRT did not improve target coverage or dose, but better spared dose to the parotid (dose to 50% [D50] was 31 Gy [IMRT] vs. 50 Gy [3D-CRT] vs. 57 Gy [2D]) and the TMJs (D50 was 31 Gy [IMRT] vs. 64 Gy [3D-CRT] vs. 59 Gy [Ho-2D]). In the case of the tumor with parapharyngeal extension, the IMRT plan showed improved tumor coverage (D95 of PTV was 68 Gy [IMRT] vs. 64.8 Gy [3D-CRT] vs. 57.5 Gy [2D]). In the third scenario of intracranial extension of tumor, IMRT improved both PTV coverage (D95 of PTV was 67.5 Gy [IMRT] vs. 62 Gy [3D-CRT] vs. 55 Gy [2D]) and normal tissue sparing of the brain stem (maximum dose was 48 Gy [IMRT] vs. 65 Gy [3D-CRT] vs. 64 Gy [2D]) and temporal lobes (maximum dose was 46 Gy [IMRT] vs. 57.5 Gy [3D-CRT] vs. 66.5 Gy [2D]). Furthermore, in the IMRT-treated patients with T2b or T4 disease, an additional 3D boost of 14 Gy increased the probability of normal tissue complications primarily to the parotid gland by 20% but <1% to the brain stem, the spinal cord, and the TMJ. The latter data demonstrate the potential of IMRT to permit safe dose escalation to 80 Gy.


Radiation Therapy Only

Outcomes after radiation therapy alone using conventional fractionation and 2D technique have shown generally good locoregional control rates for early-stage tumors but suboptimal outcomes for locoregionally advanced tumors. After conventional radiation, local failure occurs in 5% to 25% for T1-2 and 20% to 56% for T3-4 tumors (Table 22.3).43,63,68,83,84,85,86,87 Improvements in outcomes using 2D technique have resulted from better staging, comprehensive radiation coverage, improved imaging, use of a simulator, mobilization, a high-output linear accelerator, customized blocks, accurate dose calculation, verification films, training of radiation technical staff, addition of boost techniques, and integration of chemotherapy for locoregionally advanced cases.67,68,88,89,90


TABLE 22.3 Local Control by Tumor Stage after Conventional Radiation Therapy


T1 (No. of Patients)


T2 (No. of Patients)


T3 (No. of Patients)


T4 (No. of Patients)


Hoppe et al. (1976)88


87% (38)


94(16)


68(19)


44(9)


Chu et al. (1984)98


76% (25)


79(14)


37(19)


55(22)


Vikram et al. (1984)140


65% (47)


100(3)


48(57)


Wang et al. (1971)85


76% (17)


54(23)


34(11)


42(10)


BID


67(14)


84 (30)


78(12)


52(12)


Sanguineti et al. (1997)68


93% (55)


79% (138)


68% (67)


53% (118)


Perez et al. (1992)96


85% (21)


75% (33)


67% (26)


45%(63)


Lee et al. (1993)89


91%


87%


80%


77%


One of the largest North American series of nonendemic patients was reported by the MD Anderson Cancer center on the outcomes of 378 patients treated from 1954 to1992 with primary radiation therapy.68 Three-quarters were of Caucasian origin and 51% with WHO I histology whereas 41% were lymphoepitheliomas. The median age of patients was 52 years with 74% male and three-quarters presented with stage IV disease (AJCC, 1992). Patients were treated to doses ranging from 60 to 72 Gy depending on T stage with dose escalation for all T stages in the more modern eras (61 Gy [1954-1971] → 67 Gy [1972-1982] → 70 Gy [1983-1992]) as well as a transition from multifield 2D technique at the primary site in nearly two-thirds at the beginning of the study period to opposed laterals for nearly all patients during the latest period. At a median follow-up of 10 years, the 5-/10-year actuarial rates of local, regional control, and overall survival were 71%/66%, 84%/83%, and 48%/34%, respectively. LC was increased over 20% for tumors with lymphepithioloma versus squamous cell histology (p < 0.0001) with a trend toward improved control with higher doses (p = 0.09). The 5-/10-year actuarial rates of grade 3 to 5 late complications were 16%/19%. The incidence of treatment-related mortality was 3% (primarily spinal cord and cranial nerves) with virtually all cases occurring before 1971. There was a strong influence of treatment technique with incidence of grade ≥3 late complications highest in the three-field technique (AP/lats) versus 25% with opposed laterals (p < 0.0001).

The largest series of endemic patients treated with conventional fractionation and 2D technique was reported by Lee on the outcomes of 2,687 consecutive patients treated at multiple institutions in Hong Kong from 1996 to 2000.91 The breakdown of patients were as follows: stage I: 7%; stage II: 41%; stage III: 25%; and stage IV: 28%. Patients were treated to a median total dose of 66 Gy and 90% were treated with the 2D technique of Ho. About 55% had additional boost treatment with external beam or brachytherapy. About one-fourth received chemotherapy (14% concurrent, 9% sequential). At a median follow-up of 3.4 years, 5-year local, nodal, and distant failure-free survival rates were 85%, 94%, and 81%, respectively. Five-year progression-free, overall, and cancer-specific survival were 63%, 75%, and 80%, respectively. Five-year LC by T stage were as follows: T1: 91%;
T2: 87%; T3: 80%; and T4: 77%. Five-year regional control by N stage were as follows: N1: 95%; N2: 92%; and N3: 83%. Among stages I to II patients, 5-year distant metastasis-free survival (DMFS) was 90% versus 81%, for those with locoregional control versus those with locoregional failure. For stage III to IV, the corresponding 5-year DMFS was 75% versus 65%, respectively. The results of this period (1996-2000) were compared with 5,037 patients treated from 1976 to 1985 and showed significantly better LC (85% vs. 66%, nodal control 94% vs. 67%, distant-free survival 81% vs. 62%, and overall survival 80% vs. 52%). Better imaging (CT/MR vs. plain radiography/tomography) and radiation delivery technology (linear accelerator) and use of conventional fractionation are identified as the most important factors for the improvement. The one-third of patients staged by MRI (860/2,687 = 32%) achieved better overall survival regardless of stage compared with those staged only by CT (stages I-II 93% vs. 83%, p = 0.001 and stages III-IV 72% vs. 63%, p = 0.001). MRI-staged patients had better LC (T1-2: 91% vs. 87% and T3-4: 83% vs. 76%).


NECK CONTROL

In contrast to carcinomas at other head and neck sites, neck disease is managed with primary radiation regardless of N stage. Regional control with primary radiation therapy is excellent regardless of N and T stage. Regional control rates of 80% to 90% for N1-2 are the rule after definitive radiation without chemotherapy and 70% to 80% for N3.68,85,91,92 In the MD Anderson series reported by Sanguinetti, regional control for 378 patients treated from 1954 to 1992 was 83 % at 5 years for the entire group and by N stage (AJCC, 1992). Five-year actuarial rates were as follows: 95% (NO), 94% (N1), 91% (N2a), 80% (N2b), 77% (N2c), and 71% (N3).68 The series from Washington University reports regional control of 98% for N0-1, 71% for N2, and 64% for N3.92 Patients with recurrent disease to the neck after definitive radiation are treated with salvage neck dissection.


CRANIAL NERVE IMPROVEMENT AFTER RT

Due to the proximity of the nasopharynx to the skull base and the cavernous sinus, a small but significant group of patients can present with cranial neuropathy from 11% to 29% in some series.93,94 In a study of 93 patients who presented with CN palsy, 70% of patients showed improvement after definitive radiation therapy.95 The most common cranial nerve palsies involved CN V (38%), CN VI (26%), CN XII (11%), and CN III (9%). Upon completion of RT, the complete recovery rate was 51 % and partial recovery rate was 19%. At 6 months, the rate improved slightly to 58% complete recovery and 17% partial recovery. Patients with parasympathetic nerve, CN II, IX, and XI palsies showed complete recovery rates of 100% (3/3), 100% (2/2), 87% (7/8), and 100% (1/1), respectively, whereas the rate of complete recovery was worst for CN VII and XII (40% [2/5] and 40% [8/20], respectively). For the most common palsies, the complete recovery rate of CN V and CN VI were 44% (29/66) and 50% (23/46), respectively. Pretreatment duration of >3 months was associated with worse recovery of CN function (62% vs. 88%, p = 0.002) than those with a shorter period of cranial nerve palsy.


Dose-response Effect of RT

The preponderance of retrospective data reports that dose escalation above 66 Gy improves LC.43,70,71,83,88,89,92,96,97,98,99 However, some have shown no relationship.90,100,101 The lack of consistency is likely related to confounding factors including small patient numbers, historic bias in which patient outcomes are compared over long periods of time, different staging systems, improved conformality of treatments with 3D planning, brachytherapy and stereotactic radiation, better target identification with improved imaging such as MRI, use of altered fractionation regimens, and integration of chemotherapy.63,68,90

Vikram reported on 107 nasopharynx patients treated with definitive radiation alone using consistent staging and treatment techniques.83 More than half had T4 lesions and 87% with stage IV disease. Radiation was delivered with a 3-field technique to doses ranging from 40 to 77 Gy to the primary site with conventional fractionation. Minimum follow-up of at least 2 years was achieved in 98 of the 107 patients. Fifty-five patients relapsed, of whom 60% relapsed at the primary site. Patients receiving 57 to 67 Gy were at increased risk for local failure compared with those treated to 67 to 77 Gy (local failure: 43% [26/60] vs. 28% [12/43], p = 0.08, respectively). The dose response was especially pronounced for T4 lesion (local failure 46% [11/24] vs. 7% [1/14]). Patients having treatment breaks of >3 weeks had increased local failure (67% vs. 34%, p < 0.05) compared with those treated without such breaks and higher dose did not appear to compensate for the treatment break. Patients receiving the higher doses without treatment break had LC of 84%.

In a large multicenter pooled analysis of 2,426 patients treated in five Hong Kong regional centers, the benefit of escalation of dose beyond 66 Gy is evident.102 All centers used the same 2D technique according to Ho. All patients received 66 Gy with external beam radiation and about two-thirds (n = 1,572/2,426) received a boost dose. Boosts doses and technique depended on the tumor stage. For T1/T2a tumors, intracavitary boost was favored (n = 146, 10 Gy/2 fractions or 18-24 Gy/3 fractions) although some were boosted with 2D EBRT (n = 61, 15 Gy/3 fractions). All T2b-4 tumors were boosted with EBRT as follows: ipsilateral 3D posterior oblique boost (n = 211, 20 Gy/10 fractions and n = 634, 10 Gy/5 fractions) for T2b tumors and 2D boost (n = 487, median dose 10 Gy/fractions) for T3/T4 tumors. The boost was planned for most T2b/T3/T4 tumors and given to T1-T2a if biopsy residual disease remained after initial treatment. About 20% (n = 511) received chemotherapy with 12% receiving concurrent chemotherapy. Median follow-up was 4.2 years. Both early-stage T1-T2 and advanced tumors (T3-T4) treated with radiation alone benefited from an RT boost above 66 Gy, but not patients treated with chemotherapy regardless of T stage. For T2b patients, a 20-Gy boost was superior to 10 Gy in decreasing local failure. Although the impact of boost on long-term morbidity was not reported, no excess mortality were attributable to RT complications.

A steep dose-response relationship for LC was demonstrated in the range from 65 to 85 Gy of physical dose delivered and for biologic equivalent dose (BED) 10 Gy from 80 to 125 Gy.103 The data suggest a 15% decrease in local failure for every additional increase in 10 Gy BED 10 corrected for treatment time. However, dose escalation beyond 72 Gy using 2D technique is associated with significantly higher incidence of chronic toxicity such as hearing impairment, trismus, and temporal lobe necrosis based on a retrospective analysis of 849 consecutively treated patients in a single institution.104

An attempt to dose escalate using a 3D boost after initial 2D treatment was reported.69 Sixty-eight patients were treated with initial 2D technique up to 50.4 Gy followed by a 3D boost to 7,020 to 7,560 cGy (median dose 70 Gy). Lateral fields were prescribed to midplane whereas the boost was prescribed to an isodose curve. The mean dose to the PTV was on average 13% higher with the 3D portion compared with the 2D technique. About half of patients received concurrent cisplatin chemotherapy. At a median follow-up of 42 months, the 5-year LC was 77%, regional control was 97%, and progression-free survival
was 56%. These did not appear to have dramatically improved compared with a historic group of 33 patients treated with 2D technique at the same institution. However, the dose escalation was modest, the patient cohorts were small, and it is unclear how similarly imaged and staged was the historic control compared to the reported group.


Brachytherapy

Dose escalation using adjuvant brachytherapy have primarily been confined to early-stage tumors which can be encompassed adequately by the dosimetry. The combinations of external beam and brachytherapy approach have included (a) external beam doses of 60 to 70 Gy with HDR brachytherapy of 12 to 18 Gy in 3Gy BID fractions,105 (b) 60 to 62.5 Gy EBRT combined with brachytherapy boost of 18 to 24 Gy/8 Gy × 2 to 3 weekly fractions,61 (c) 64.8 to 68.4 Gy of EBRT followed by brachytherapy boost of 5 to 16.5 Gy in 1 to 3 fractions,106 and (d) 64 Gy → 7 to 10 Gy intracavitary boost (Table 22.4).97

The literature supports the benefit of brachytherapy in decreasing local failure by 50% for T1-2 patients treated with radiation alone with modestly improved disease-free survival.102 The largest series is reported by Teo in a retrospective analysis of 743 patients with T1-2 cancers all treated with the Ho 2D technique.102 One-hundred eighty-eight received brachytherapy (18-24 Gy in 3 fractions over 2 weeks) plus EBRT whereas 555 received EBRT alone. EBRT was delivered to a dose of 60 Gy in 4 weeks in the majority of patients. Neoadjuvant chemotherapy was delivered in 13% of patients. Brachytherapy was delivered within 4 to 6 weeks after EBRT for persistent disease in 126 patients (24 Gy) and as adjuvant (18 Gy) to complete responders in 62 patients. Median follow-up was 79 and 88 months in the brachytherapy arm and EBRT-alone arms, respectively. At 5 years, the brachytherapy group had fewer local failures (5.8% vs. 11.7%, p = 0.013) and lower disease-specific mortality (12.2% vs. 15.2%, p = 0.08) compared with the EBRT-alone group. No difference in regional failure (8% in each arm) or DM (13% in each arm) are reported. Multivariate analysis showed the independent benefit of brachytherapy in decreasing local failure. The two groups showed comparable chronic radiation complications. However, patients receiving brachytherapy had an increased incidence of nasopharyngeal ulceration and necrosis occurring in 6% versus 0.2% in the EBRT-alone arm.

Only gold members can continue reading. Log In or Register to continue

Stay updated, free articles. Join our Telegram channel

Jun 21, 2016 | Posted by in ONCOLOGY | Comments Off on General Principles and Management

Full access? Get Clinical Tree

Get Clinical Tree app for offline access