Introduction
Population ageing is considered one of humanity’s greatest success stories. It is also one of the greatest challenges to cope with in socioeconomic and health policies. Worldwide, the proportion of people aged 60 years and over has risen from 8% in 1950 to 11% in 2007 and is expected to reach 22% in 2050.1 In addition, it is predicted that decreasing fertility rates and increasing longevity will ensure the continued ‘greying’ of the world’s population. Ageing is a complex process and apart from factors intrinsic to the individual, extrinsic and treatable factors also play a role, such as environmental and lifestyle variables.2 Since extra years in old age are not always spent in good health, the question often is raised, ‘How do I get old healthy?’ Analyses of the major causes of death clearly show that the burden of chronic diseases has increased rapidly. Most data come from self-reported (co-)morbidity and medical records confirm this trend. Partly this increase may reflect improved medical knowledge and health service use in elderly people. Such progress leads to a longer period of morbidity, but with an improved functional status.3 Many of the health risk factors are related to nutrition and inactivity and include high blood pressure, high concentrations of serum cholesterol, low intake of fruits and vegetables, being overweight and alcohol and tobacco use. These factors may lead to, amongst others, cardiovascular disease, type 2 diabetes, certain types of cancer and osteoporosis. These global epidemiological data have prompted the WHO (World Health Organization) and FAO (Food and Agriculture Organization) to set up a Joint WHO/FAO Consultation on Diet Nutrition and the Prevention of Chronic Disease. The report of this group provides dietary recommendations, including the following guidelines:4
- limit energy intake from fat and shift consumption away from saturated fats and trans-fatty acids towards unsaturated fat;
- increase consumption of fruits and vegetables and also legumes, whole grains and nuts;
- limit the intake of ‘free’ sugars;
- limit salt (sodium consumption from all sources) and ensure that salt is iodized;
- achieve energy balance for weight control.
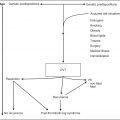
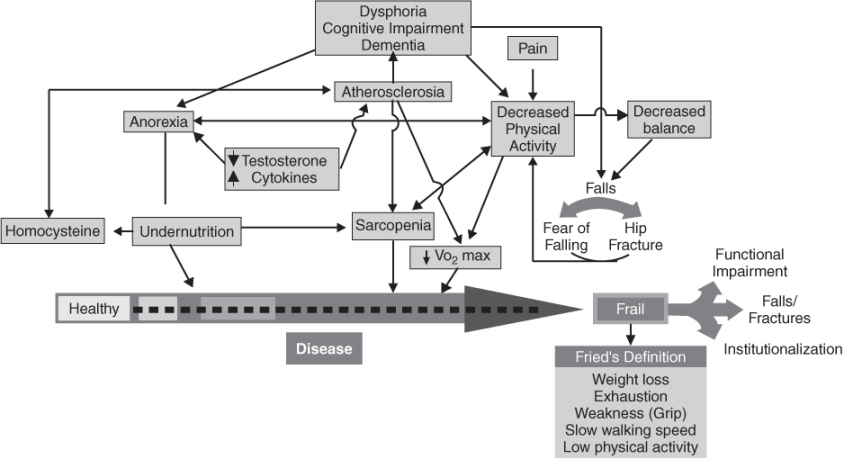
The guidelines are evidence based for younger adults and more recent research has shown the potential impact in older adults. In old age, frailty is likely to develop (Figure 15.1) and therefore may expand the role of nutrition from the prevention of diseases to the supply of specific nutrients and the maintenance of food intake. This food intake should be sufficient to combat frailty and to maintain quality of life. Frail is defined here as an age-related physiological vulnerability resulting from impaired homeostatic reserve and reduced capacity of the organism to withstand stress.
Figure 15.1 The pathophysiology of frailty. (Reproduced with permission from Morley;5 www.cyberounds.com/conferences/geriatrics/.)
In view of the desired adaptation of the dietary guidelines to health priorities in older adults, we discuss in this chapter epidemiological evidence for this age group on:
- body weight, body composition and health;
- dietary intake, dietary patterns, diet scores in relation to mortality: differences within and between populations;
- high-risk nutrients;
- determinants of food choice and vulnerable groups;
- effects of nutrition supplements on health indices;
- dietary guidelines in old age.
Body Weight, Body Composition and Health
Body Weight Change, Changes in Body Composition and Usual Ageing
In cross-sectional studies, the prevalence of high body weight or obesity [body mass index (BMI) >30 kg m−2] increases with age up to about 60 years, remains stable until about 70 years and then declines.6 Studies indicate that both weight loss and weight gain are associated with adverse health outcomes, such as decreased functional status, institutionalization and increased mortality.7
In considering changes in body mass and health, changes in body composition have to be included. A decline in lean body mass occurs in the third decade.6 This loss in lean body mass, much of which may be due to a sedentary lifestyle, tends to be offset by gains in fat mass that continues until age 65–70 years. At any given BMI, older people will be considerably fatter than younger adults of similar body weight because the fat-free mass diminishes by as much as 70% between the ages of 30 and 70 years. Studies in very healthy elderly people indicate that only very small decreases in weight (0.1–0.2 kg per year) appear to occur in association with normal ageing. Therefore, weight loss should never be dismissed as part of the ageing process.
Most of the studies on BMI in the aged have been conducted in the United States [e.g. the Baltimore Longevity Study, the New Mexico Study and the older age group of NHANES III (National Health and Nutrition Examination Survey)] and in Europe [e.g. SENECA (Survey in Europe on Nutrition and the Elderly—a Concerted Action) and the elderly part of EPIC (European Prospective Investigation into Cancer and Nutrition)]. Available data indicate that demographic changes are even more dramatic in the less developed countries. One study including other demographic groups was the International Union of Nutrition Societies (IUNS) cross-cultural study on ‘Food Habits in Later Life’. In this study, people of 70 years and older from communities in Australia, Greece, China, Japan, the Philippines and Sweden were involved. The results showed that on average BMI for Caucasian men and women is about 25 kg m−2, with the highest for Greek women (30 kg m−2). Filipino and Chinese had average BMIs between 20 and 22 kg m−2. The estimated fat mass showed, as expected, a large gender difference with on average 43–50% for women and 25–35% for men, but differences in fat mass between ethnic groups were less striking.8
The Association Between BMI, Weight Loss and Health
Many studies have documented that the relative risks of a high BMI may become less pronounced with ageing. A systematic review and meta-analysis conducted to determine the effect of an elevated BMI on all-cause mortality risk in men and women aged 65 years and over concluded that elderly with overweight (25–29 kg m−2) do not have a significantly increased risk of mortality. A BMI in the obese range (30 kg m−2 and over) is associated with only a modest increase in mortality risk regardless of gender, disease status and smoking status.9 Several explanations for this phenomenon have been put forward, such as selective survival, cohort effects and/or a ceiling effect of mortality rates. The most important explanation might be that BMI is not a good indicator of body composition. The U-shaped relation between BMI and mortality in younger adults may be the result of a positive association between body fat mass and mortality and an inverse linear association between fat-free mass and mortality. As stated above, the ratio between the two compartments (fat and fat-free mass) changes with ageing and the BMI does not measure this. Further, kyphosis in old age makes it difficult to measure height and, therefore, may result in unreliable estimates of BMI. For this reason, changes in weight (rather than changes in BMI) are a preferable measure, although in the interpretation the possibility of oedema has to be taken into account.10 As a final reason for the less pronounced relative risk of a high BMI, it is suggested that an excess fat mass is less detrimental in old age. However, recent views on pro-inflammatory factors related to adiposity indicate that fat loss ameliorates some catabolic conditions of ageing since some cytokines may directly affect muscle protein synthesis and breakdown. A voluntary decrease in weight may also ease the mechanical burden on weak joints and muscle, thus improving mobility. Therefore, only weight-loss therapy that minimizes loss in muscle and bone condition is recommended for older obese persons. Especially in the case of sarcopenic obesity, prevention of further loss of muscle mass is urgently required. Sarcopenic obesity is defined as the coexistence of diminished lean mass and increased fat mass).11
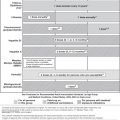
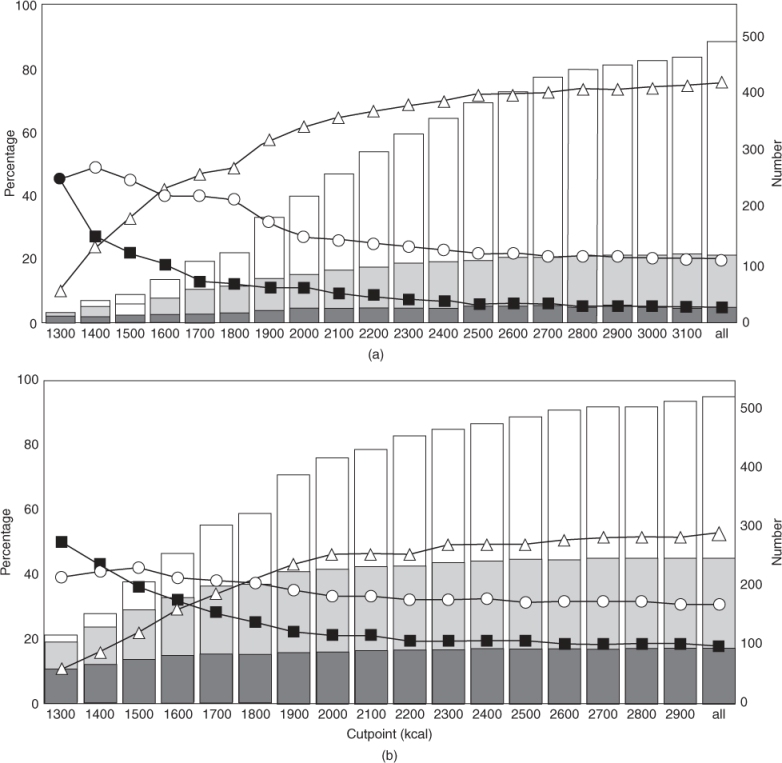
At the other end of the scale, reflecting body weight, prospective studies have shown that weight loss, a decline in BMI, can be both a marker of and an independent contributor to adverse health outcomes. Involuntary weight loss in elderly subjects is likely to reflect sarcopenia, a loss of lean body mass and particularly muscle mass. Other types of weight loss are cachexia, a disease-related weight loss, and starvation or undereating reflecting loss of mainly fat mass. Weight loss may contribute to the increased mortality, especially if the initial body weight is relatively low. Incidence rates of 5–15% have been reported in studies of involuntary weight loss in community-dwelling older adults.7 In frail elderly people often dependent on professional care, rates of over 25% up to 40% have been observed. Body weight loss is considered the most important indicator of undernutrition. A loss of 10% in 6 months, 7.5% in 3 months or 5% in 1 month is considered very serious, owing to the direct relationship with morbidity and mortality. Further, nutritional deficits are associated with low energy intake, as is shown in Figure 15.2.12
Figure 15.2 Number and percentage of (a) men and (b) women with an inadequate intake of no nutrients ( and Δ), one nutrient (
 and
and  ) and at least two nutrients (
 and
and  ) for groups with energy intakes under different cut points (Reproduced from de Groot et al.,12 by permission of Oxford University Press.)
Central Adiposity and Health
Redistribution of body fat with ageing further limits the applicability of BMI as a risk indicator in older adults. There is evidence in younger adults that those who have the majority of their adipose tissue around their waist (high waist-to-hip ratio) have a higher prevalence of diabetes mellitus, hypertension and coronary artery disease than those who have predominantly hip adiposity. Folsom et al.13 examined the role of body fatness on mortality in a random sample of 31 702 Iowan women aged 55–69 years, followed for 11–12 years. Waist-to-hip ratio was positively correlated with mortality, also after correction for smoking, alcohol and estrogen use. Waist-to-hip ratio is, however, increasingly difficult to interpret with further advancing age. Whereas the waist measures abdominal fatness, hip circumference may also reflect variations in pelvic width and gluteal muscle. In elderly people, narrow hips may reflect peripheral muscle wasting, which may correlate with chronic conditions.
The current literature gives inconsistent answers to the question of how useful it is to measure, in addition to BMI, the waist-to-hip ratio or waist circumference only. So far, except for the oldest age group, the conclusion of Canoy14 based on current epidemiology may be clinically useful: adipose tissue distribution assessment ideally should provide a single risk estimate that captures the separate effects of abdominal and peripheral adiposity. Although far from perfect, waist-hip ratio or just waist circumference is a simple and inexpensive measure that captures these effects and can help to improve CHD and other chronic disease risk assessments. This conclusion should not stop further research and development of an appropriate protocol for the diagnosis of adipose tissue distribution, including the search into cut-off points for specific ethnic, age and other population groups.
Fluid Status and Dehydration in the Elderly
Older adults are at risk for dehydration because of both reduced fluid intake and increased fluid losses. Even in healthy, successful ageing, there is a reduction in thirst in response to water deprivation, which is evidenced both in a lower self-reported thirst score during dehydration and in ingestion of less water after the dehydration period. Acute weight loss of 3% or more of the body mass or more than 1 kg weight loss per day points to dehydration. It is a common and potentially lethal problem in both institutionalized and community-dwelling elderly people. In hospitals, the mortality rate may be up to 50% in those older adults with dehydration. The most common causes of dehydration are infection, altered level of consciousness, cognitive impairment and use of diuretics. Schols et al.15 concluded that dehydration is a common problem in nursing homes, often due to failures in detection of dehydration and appropriate management. An overload of water and salt is also common and may result in impaired recovery from surgery or perioperative mortality and morbidity. For the elderly, it is advised to take about 1.5 l of fluid per day.
Ageing, Bone Loss and Nutrition
Bone loss commences around the age of 40 years and is on average between 0.5 and 1% per year in men; in women, the rate of bone loss accelerates around the menopause to about 2% per year. When bone density falls below 2.5 SD of the mean bone mineral density (BMD) of young adults, the WHO16 refers to osteoporosis. The latter is a multifactorial disease and defined also as ‘a systemic skeletal disease characterized by low bone mass and microarchitectural deterioration of bone tissue, with a consequent increase in bone fragility and susceptibility to fractures’. Biological, environmental and genetic factors and also lifestyle factors may play an important role in the onset and development of osteoporosis. The incidence of osteoporosis varies widely between countries and between and within ethnic groups. For instance, the NHANES III study17 showed that low BMD is most common among elderly non-Hispanic white women (21% osteoporosis) and among Mexican American women (20% osteoporosis) and lower in non-Hispanic black women (18%). In Europe it is estimated that 179 000 men and 611 000 women suffer a hip fracture every year and these numbers are expected to double in the next 40 years.18
Although a low percentage of the bone mass can be explained by nutritional factors (less than 20%), it can still have a large impact on bone health. The benefits of supplementation of populations at risk for osteoporosis with vitamin D and calcium are well established in studies with endpoints such as effects on BMD, bone turnover and a reduced risk of fractures without side affects. The vitamin D requirement may be higher in regions where calcium intake is low. Vitamin D also has a beneficial effect on the risk of falling, explained by an improvement of muscle function. Evidence for associations between optimal protein intake and bone mass is diverse, positive, negative and no associations having all been found. Other dietary factors, such as vitamin K, vitamin A, caffeine, fluoride, phosphorus and zinc, are also subjects of current bone research and it is under debate whether they are important and truly associated with bone health.19
Dietary Intake, Dietary Patterns, Diet Scores in Relation to Mortality: Differences Within and Between Populations
Macronutrients as Sources of Energy
Population-based nutritional surveys have shown a gradual decline in energy intake in old age. Shifts in the percentage of energy coming from various macronutrients while ageing are less clear. Between populations, the macronutrient composition appears to vary considerably. Across studies, intakes range from 12 to 18% energy from protein, from 20 to 42% energy from fat and from 38 to 65% from carbohydrates.8 In a background paper, Prentice20 considered the extent to which the development of recommendations for dietary energy needs to account for the macronutrients. He discussed the issue with a view to avoiding undernutrition in addition to obesity. He concluded that ‘at the metabolic level, only diets with the most extreme macronutrient composition would have any consequences by exceeding the natural ability to modify fuel selection. However, diets of different macronutrient composition and energy density can have profound implications for innate appetite regulation and hence energy consumption’. The Omni-Heart study,21
Stay updated, free articles. Join our Telegram channel

Full access? Get Clinical Tree


